
-
AuthorSearch Results
-
July 10, 2025 at 9:50 pm #27376
In reply to: Forex Forum
July 10, 2025 at 2:18 pm #27355In reply to: Forex Forum
July 8, 2025 at 1:00 pm #27227In reply to: Forex Forum
SOL ETF Approval May Come Early, Solana Activity Soars
Key points:
· SSK’s strong debut with $33M volume puts pressure on SEC to approve more Solana ETFs quickly.
· Network daily active addresses spike to 14.63M, signalling rising user interest and platform usage.
Solana ETF Coming Earlier?
The U.S. Securities and Exchange Commission (SEC) is moving faster than expected on spot Solana (SOL) ETF applications. According to two sources familiar with the matter, the SEC asked fund issuers to submit updated S-1 filings before the end of July. These updates must include details on staking and in-kind transactions.
Although the Commission has until October 10 to make a final decision, it may act before that date. This shift in pace appears connected to the recent approval of the REX-Osprey Solana and Staking ETF (SSK). That fund launched under the Investment Company Act of 1940, which allowed it to start trading without a formal approval unless the SEC intervened.SSK Launch Raises Urgency for Other Filings
SSK’s launch gives it a key advantage over other proposed ETFs still under review. It became the first Solana staking fund available to U.S. investors. The SEC has previously tried to avoid giving early access to one fund by approving similar products at the same time. This was the case with spot Bitcoin and Ethereum ETFs.
One person familiar with the matter said the existence of an active Solana ETF could increase pressure on the SEC to approve additional filings without delay. The Commission’s request for issuers to update their paperwork suggests the process may now move faster than originally planned. Strong Trading Start for First Solana ETF
SSK began trading last week and drew $12 million in inflows on its first day. It also recorded $33 million in volume, based on data from Bloomberg analyst Eric Balchunas. These early numbers reflect growing interest in Solana-related investment products.
Notably, on-chain data shows a sharp increase in the network’s usage. According to Sentiment data, daily active addresses reached 14.63 million on July 7. Just days earlier, activity had remained below 5 million.
Meanwhile, the rise in user activity comes at a time when Solana’s market price has stayed steady. SOL was trading at $150.06 at press time, down 1.48% over the past 24 hours.
Over the last week, the price has gained 0.61%. Trading volume sits above $4.28 billion. If activity on the network continues to grow, it may support long-term interest from investors and fund managers.
 July 7, 2025 at 8:15 am #27157
In reply to: Forex Forum
Bitcoin Rises Toward Record High. Why Trump, Fed Rates, ETFs May Be Driving Cryptos
The Bitcoin price was rising again Monday, defying a stock-market selloff and putting the cryptocurrency on the brink of a new high.
The world’s largest token by total market capitalization was up 0.8% to $108,944 over the past 24 hours, according to data from CoinDesk. It’s less than 3% below the record price of nearly $112,000 it hit back in May.
Other digital assets also rose in early trading. Ethereum was up 1.9%, Solana had gained 2.1%, and XRP had added 1.6% over the past 24 hours, according to data from the crypto exchange Kraken.
It wasn’t obvious what was driving the price action, but one factor could be investors diversifying out of stocks ahead of Washington’s July 9 tariff deadline. Futures tracking the benchmark S&P 500 slid 0.5% Monday as the market fretted about President Donald Trump’s pledge to start setting unilateral levies over the next few days.
The president said “tariff letters and/or deals” will be delivered starting Monday and threatened an additional levy on countries aligned with the Brics group — which includes Brazil, Russia, India and China — in a post on Truth Social overnight.
“Any Country aligning themselves with the Anti-American policies of BRICS, will be charged an ADDITIONAL 10% Tariff. There will be no exceptions to this policy,” Trump said.
Other factors pushing up digital-asset prices could include more institutional investors piling into crypto exchange-traded funds, or a slight shift in the market’s expectations about the chances of the Federal Reserve cutting interest rates later this year.
 July 5, 2025 at 6:58 pm #27141
In reply to: Forex Forum
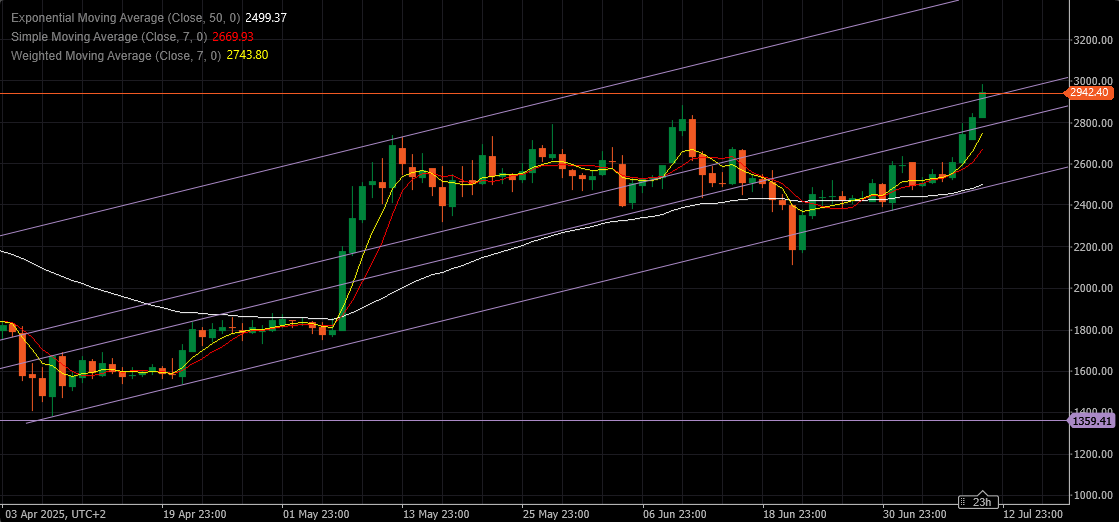
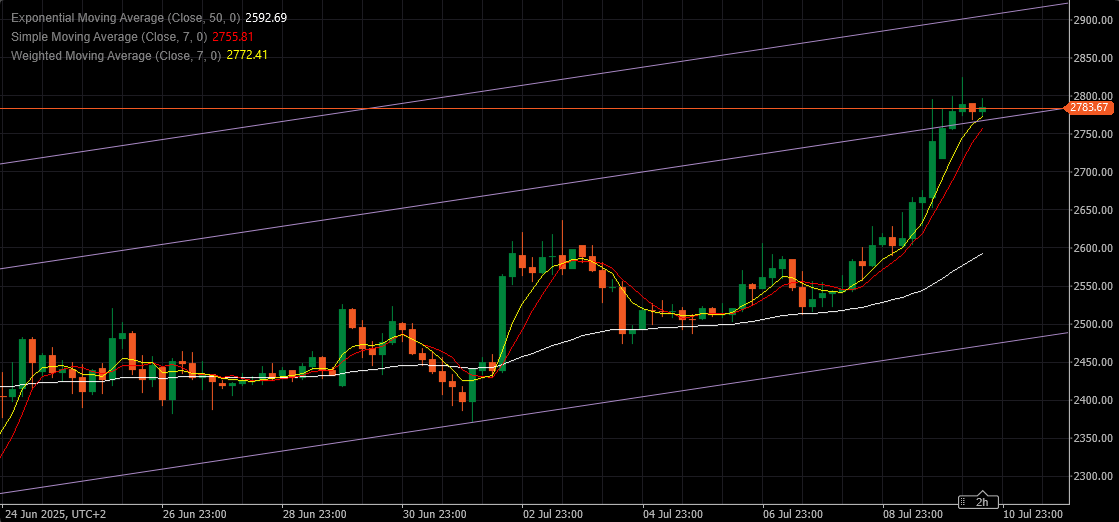
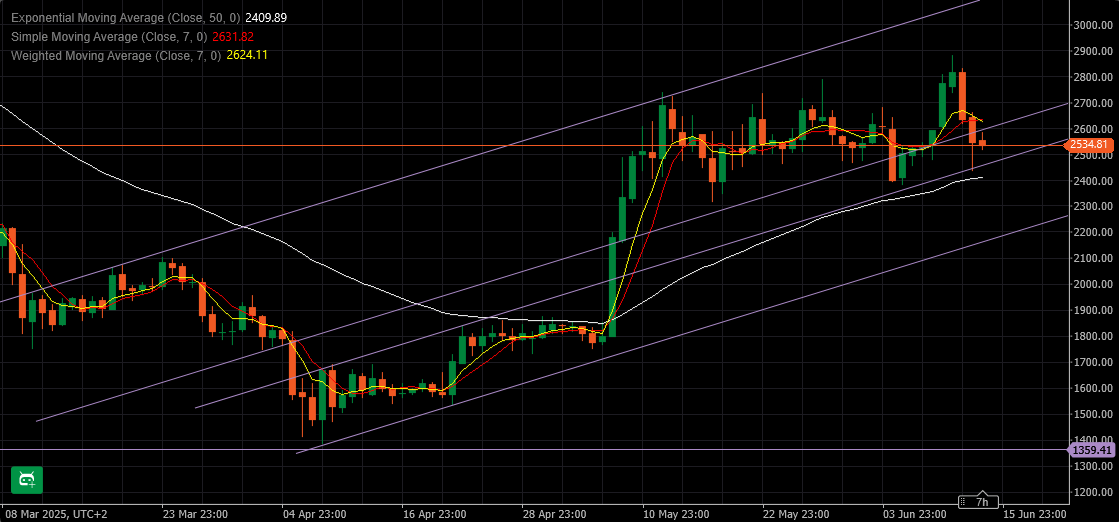
ETHUSD – Ethereum
Ether just couldn’t profit with this last push Up.
Now the whole picture is starting to look very Bearish.
There are some important supports that might give some footing, but if lost space is open for run at 1360.00
Supports: 2440.00, 2275.00 & 2105.00
Resistances: 2530.00, 2635.00 & 2725.00
 July 2, 2025 at 7:44 am #27028
In reply to: Forex Forum
Solana (SOL) at Crossroads — Bounce Likely If $142 Remains Intact
Solana started a fresh decline and retested the $145 support zone. SOL price is now recovering and might aim for a fresh increase above the $150 zone.
· SOL price started a fresh decline after it failed to clear $160 against the US Dollar.
· The price is now trading below $150 and the 100-hourly simple moving average.
· There was a break above a key bearish trend line with resistance at $147 on the hourly chart of the SOL/USD pair (data source from Kraken).
· The pair could start a fresh increase if it clears the $152 resistance zone.
Solana Price Trims Gains
Solana price struggled to continue higher above $160 and started a fresh decline, like Bitcoin and Ethereum. SOL declined below the $155 and $152 support levels.
It even dipped below $150 and tested the $145 zone. A low was formed at $144 and the price is now correcting some losses. There was a move above the 23.6% Fib retracement level of the downward move from the $160 swing high to the $144 low.
Besides, there was a break above a key bearish trend line with resistance at $147 on the hourly chart of the SOL/USD pair. Solana is now trading below $150 and the 100-hourly simple moving average.
On the upside, the price is facing resistance near the $150 level. The next major resistance is near the $152 level. It is close to the 50% Fib retracement level of the downward move from the $160 swing high to the $144 low. The main resistance could be $155. A successful close above the $155 resistance zone could set the pace for another steady increase. The next key resistance is $160. Any more gains might send the price toward the $165 level.
Another Decline in SOL?
If SOL fails to rise above the $150 resistance, it could start another decline. Initial support on the downside is near the $145 zone. The first major support is near the $142 level.
A break below the $142 level might send the price toward the $136 zone. If there is a close below the $136 support, the price could decline toward the $125 support in the near term.
Technical Indicators
Hourly MACD – The MACD for SOL/USD is losing pace in the bearish zone.
Hourly Hours RSI (Relative Strength Index) – The RSI for SOL/USD is above the 50 level.
Major Support Levels – $145 and $142.
Major Resistance Levels – $152 and $155.
 July 2, 2025 at 4:33 am #27018
In reply to: Forex Forum
Ethereum Price Drops After Bullish Attempt — Support Area Under Pressure
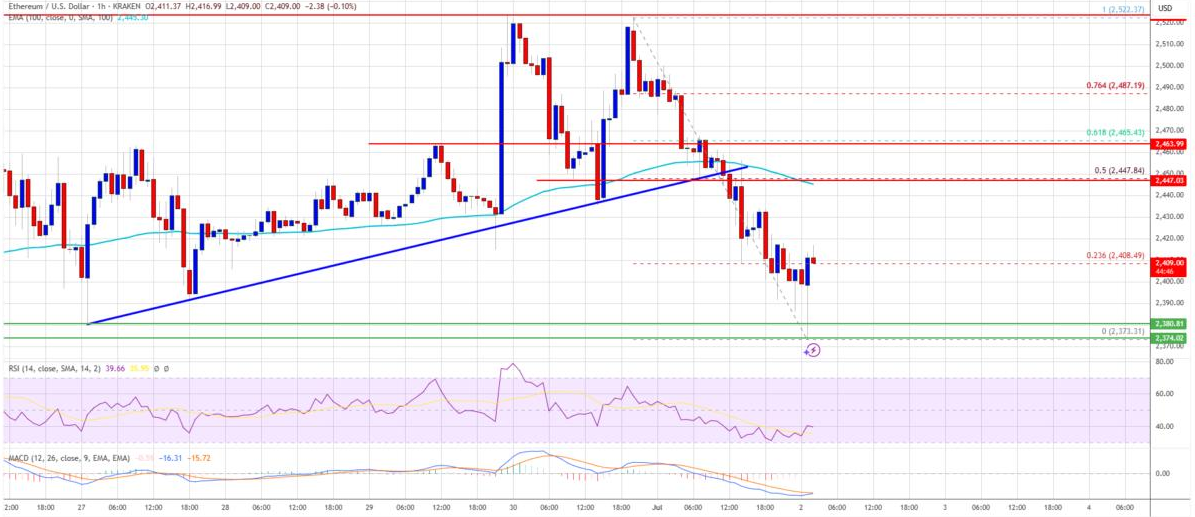
Ethereum price started a fresh decline from the $2,520 zone. ETH is now back below $2,450 and struggling to stay above the $2,350 support.
· Ethereum started a fresh decline from the $2,520 level.
· The price is trading below $2,450 and the 100-hourly Simple Moving Average.
· There was a break below a key bullish trend line with support at $2,450 on the hourly chart of ETH/USD (data feed via Kraken).
· The pair could start a fresh increase if it remains stable above the $2,350 zone in the near term.
Ethereum Price Trims Gains
Ethereum price started a fresh decline from the $2,520 resistance, like Bitcoin. ETH price declined below the $2,500 and $2,450 levels to enter a short-term bearish zone.
Besides, there was a break below a key bullish trend line with support at $2,450 on the hourly chart of ETH/USD. The pair even spiked below the $2,400 level. A low was formed at $2,373 and the price is now attempting to recover some losses.
It climbed above the 23.6% Fib retracement level of the downward move from the $2,523 swing high to the $2,373 low. Ethereum price is now trading below $2,450 and the 100-hourly Simple Moving Average.
On the upside, the price could face resistance near the $2,420 level. The next key resistance is near the $2,450 level. It is close to the 50% Fib retracement level of the downward move from the $2,523 swing high to the $2,373 low. The first major resistance is near the $2,465 level. A clear move above the $2,465 resistance might send the price toward the $2,520 resistance.
An upside break above the $2,520 resistance might call for more gains in the coming sessions. In the stated case, Ether could rise toward the $2,550 resistance zone or even $2,650 in the near term.
Another Decline In ETH?
If Ethereum fails to clear the $2,450 resistance, it could start a fresh decline. Initial support on the downside is near the $2,375 level. The first major support sits near the $2,350 zone.
A clear move below the $2,350 support might push the price toward the $2,280 support. Any more losses might send the price toward the $2,220 support level in the near term. The next key support sits at $2,150.
Technical Indicators
Hourly MACD – The MACD for ETH/USD is losing momentum in the bearish zone.
Hourly RSI – The RSI for ETH/USD is now below the 50 zone.
Major Support Level – $2,350
Major Resistance Level – $2,450
 July 2, 2025 at 4:30 am #27017
In reply to: Forex Forum
XRP Price Retreats From Highs — Is The Rally In Jeopardy?
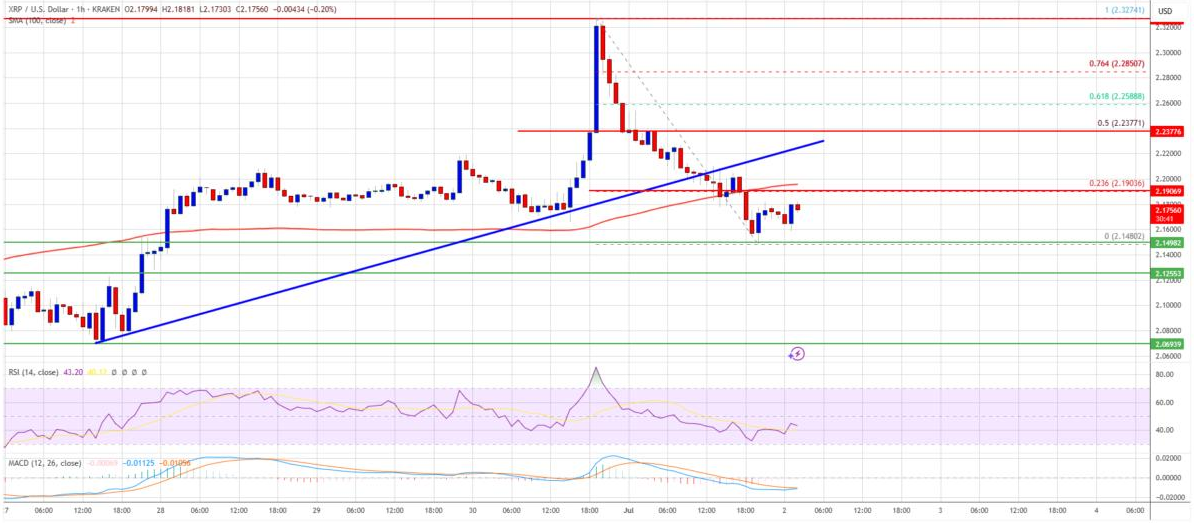
XRP price started a fresh decline from the $2.320 zone. The price is now correcting gains and might find bids near the $2.120 zone.
· XRP price started a fresh decline from the $2.320 zone.
· The price is now trading below $2.220 and the 100-hourly Simple Moving Average.
· There was a break below a key bullish trend line with support at $2.20 on the hourly chart of the XRP/USD pair (data source from Kraken).
· The pair could extend losses if it fails to clear the $2.220 resistance zone.
XRP Price Dips Further
XRP price failed to extend gains above the $2.320 resistance and started a fresh decline, like Bitcoin and Ethereum. The price declined below the $2.250 and $2.220 support levels.
Besides, there was a break below a key bullish trend line with support at $2.20 on the hourly chart of the XRP/USD pair. The pair even spiked below the $2.150 level. A low was formed at $2.148 and the price is now consolidating losses below the 23.6% Fib retracement level of the downward move from the $2.327 swing high to the $2.148 low.
The price is now trading below $2.220 and the 100-hourly Simple Moving Average. On the upside, the price might face resistance near the $2.20 level. The first major resistance is near the $2.220 level. The next resistance is $2.2380. It is close to the 50% Fib retracement level of the downward move from the $2.327 swing high to the $2.148 low.
A clear move above the $2.2380 resistance might send the price toward the $2.2850 resistance. Any more gains might send the price toward the $2.30 resistance or even $2.320 in the near term. The next major hurdle for the bulls might be $2.40.
Fresh Decline?
If XRP fails to clear the $2.220 resistance zone, it could start another decline. Initial support on the downside is near the $2.150 level. The next major support is near the $2.120 level.
If there is a downside break and a close below the $2.120 level, the price might continue to decline toward the $2.050 support. The next major support sits near the $2.020 zone.
Technical Indicators
Hourly MACD – The MACD for XRP/USD is now losing pace in the bearish zone.
Hourly RSI (Relative Strength Index) – The RSI for XRP/USD is now below the 50 level.
Major Support Levels – $2.150 and $2.120.
Major Resistance Levels – $2.220 and $2.2850.
 June 30, 2025 at 6:17 pm #26957
In reply to: Forex Forum
June 27, 2025 at 3:41 pm #26861In reply to: Forex Forum
Ethereum chart signals ‘altseason’ as analysts predict $10K ETH price top
Key takeaways:
· Ether’s technical breakouts suggest ETH price may hit $10,000 this cycle.
· Altcoin Season Index says it’s prime time to accumulate “lagging” altcoins.
· Bitcoin dominance nearing 70% could trigger a full-blown altseason soon.
Ether’s ETHUSD technical setup suggests that the altcoin is poised for sharp price gains that could mark the start of an “altseason” over the next few weeks or months.
ETH price could top $10,000 this cycle – Analysts
Technical analysis using the Wyckoff method points to a potential Ethereum price breakout to the $3,200 mark
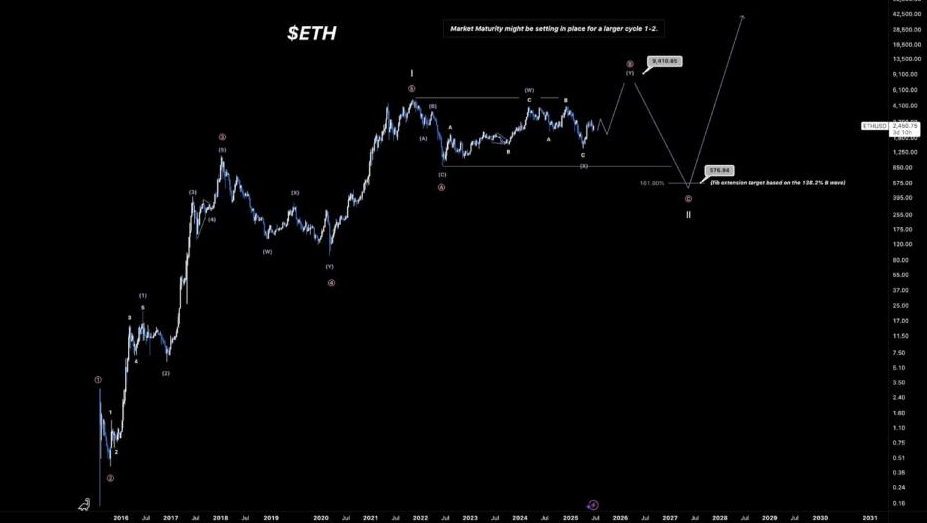
Several analysts have made similar projections, targeting $10,000 and above per ETH, citing historical fractals, increased institutional demand via Ethereum ETFs, and other factors. An accompanying chart showed an Elliott Wave analysis projecting a possible breakout to $9,400.
“ETH is still looking to shoot for new ATHs this cycle and should end around $9,000-$10,000, give or take.
Prepare for altseason:
The Altcoin Season Index, a metric used to measure the performance of non-Bitcoin cryptocurrencies (ie, altcoins) in the cryptocurrency market, suggests now is the time to get into altcoins.
Bitcoin has outperformed altcoins over the last 60 days, with the altcoin season index in the green zone below 20%.
Bitcoin dominance—a metric measuring Bitcoin’s market share relative to the overall crypto market—is one of the indicators commonly used to indicate whether the altseason has begun. It can provide traders with the overall investor sentiment and risk appetite in the market.
At the time of publication, BTC dominance is at 65.77% maintaining the uptrend, indicating that it is still “Bitcoin season.”
 June 22, 2025 at 12:05 pm #26584
In reply to: Forex Forum
Bitcoin Dominance Skyrockets as ETH and Other Altcoins Plummet
Bitcoin’s price took another turn for the worse in the past 24 hours after the US attacked multiple Iranian nuclear sites, and the asset plunged to a multi-week low.
The altcoins have posted even more notable price declines, which is evident from the growing BTC dominance.
Bitcoin Tries to Recover
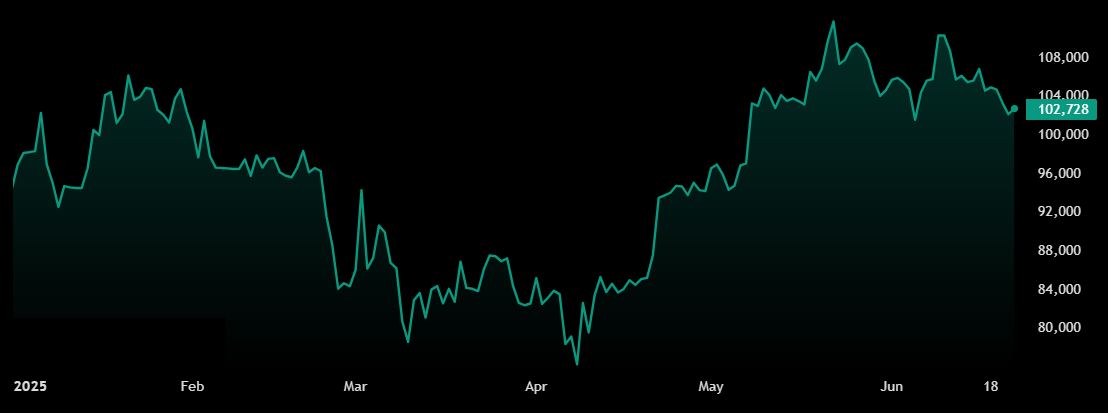
The business week began on a different note as the primary cryptocurrency shot from under $105,000 to $109,000 by Tuesday. However, it faced an immediate and violent rejection that pushed it south hard as the tension in the Middle East continued to rage on.
In a matter of hours, BTC dumped to $103,500 before the bulls initiated an impressive leg up that drove the asset higher by around $3,000. Nevertheless, the overall negative market sentiment continued, and bitcoin started to lose value once again in the following days.
The culmination came earlier today as the US launched “successful” attacks against multiple nuclear sites in Iran, as described by the POTUS. Moreover, Trump warned that there will be more violent strikes if Iran decides to retaliate in any form.
Bitcoin’s price tumbled below $101,000 for the first time in almost three weeks. However, it remained within a six-digit price territory and has recovered to $102,500 as of now.
Its market cap is down to $2.040 trillion on CG, but its dominance over the alts has skyrocketed to almost 63% as most bleed out.Alts Deep in Red
The rising BTC dominance in times when the cryptocurrency’s price is dropping means only one thing – the alts have it even worse. Interestingly, it’s not just the lower caps that are suffering badly. Ethereum, the largest of the bunch, has dumped by over 7% in the past 24 hours and is close to breaking below $2,200. Recall that ETH stood tall close to $2,800 just until a week ago.
Solana, Dogecoin, Cardano, SUI, LINK, HBAR, and LINK are also deep in the red from the bigger alts. Even more painful declines come from VIRTUAL, APT, INJ, TIA, TAO, SEI, JUP, FET, and PEPE, as all of them are down by double-digits on a daily scale.
These developments are only supporting a recent report, which claimed that those hoping for an altseason are relying mostly on “wishful thinking” rather than any hard data.
 June 21, 2025 at 3:00 pm #26570
In reply to: Forex Forum
Crypto Market Slows Down As Fed Rate Cut Expected In September
Bitcoin is hovering near $103,700. There is growing uncertainty in its price action as global tensions rise. Retail sentiment is also weakening, adding to the pressure on BTC. But the current dip may just be a cool-off phase, and not the end of the bull cycle.
Retail Sentiment Hits April Lows
Crypto analytics firm Santiment shared recently that the retail sentiment has turned sharply negative, hitting its lowest point since early April. This is similar to levels seen in April, just before Bitcoin rebounded. With bearish comments rising, the panic could signal a rebound.
The Fed rates are also steady, which has kept BTC stuck between $100K and $ 110 K. On-chain data shows that whales are accumulating while traders pull back.
A Healthy Cool-Off Phase?
The crypto market is currently in a slow correction phase. Altcoins have been declining since December, while Bitcoin remains stuck between $100K and $ 107K. Ethereum is struggling below $3,000, and overall trading volume is dropping, which are clear signs that retail investors are staying out for now.
However, there have been no major crashes or negative events. This is a typical cooling-off period within a larger uptrend, similar to what happened in 2017 and 2021. These phases often follow major rallies and can last a few months.
Looking ahead, there is a positive macro signal too. The Fed may cut rates in September, with a 71.8% chance according to CME FedWatch. This could boost crypto markets, and even the anticipation of rate cuts can lift sentiment and bring life back to risk assets.
Cycle May Extend Into 2026
Real Vision CEO Raoul Pal also believes that the current crypto market closely resembles 2017, when Bitcoin rose steadily before exploding in December. He notes that macro conditions indicate that this cycle could be longer than expected, possibly extending into Q2 2026.
Many long traders were recently wiped out on Binance as open interest dropped. This “cleanup” happened right after the Fed paused rate hikes. With fewer traders now in risky positions and past trends showing Bitcoin often rises after such events, CryptoQuant analysts see this as a potential setup for a Bitcoin bounce.
 June 21, 2025 at 2:54 pm #26569
In reply to: Forex Forum
ETH Sell Off Surge! Who Is Selling Ethereum?
Ethereum is currently trading at $2442.32, down over 4% in the past day. In the last 24 hours, Ethereum has moved between $2389.71 and $2556.98.
Bearish Pressure Grows as Dormant Wallets Turn Active
ETH’s Liveliness has hit a record high of 0.69, according to Glassnode, indicating that long-term holders are moving their coins and are likely to sell. This rise shows dormant accounts are becoming active amid weak demand and a sluggish market, adding to the growing bearish pressure on Ethereum.
Data from Defilama shows that the Ethereum chain has experienced a significant drop over the past few weeks. It has dropped from 27.99 million ETH on the 6th of May to around $25 million.
Besides, weak buying interest and falling capital inflows are adding to the pressure. If selling continues, it could fall to $2,185 or even to its May low. However, a bounce in demand could flip the trend and shift momentum back to the upside.
ETF Outflows Add to Short-Term Price Risks
On June 20, Ethereum ETFs saw a net outflow of $11.3 million, according to Farside Investors. The biggest withdrawal came from ETHA with $19.7 million, while ETH and ETHV saw modest inflows of $6.6M and $1.8M. Other ETFs reported no activity.
Ether Sees Huge Liquidations
Ethereum has seen $170 million liquidations in the last 24 hours, with $157 million in long positions. Santiment data shows that ETH is flowing into centralized exchanges at an unusually high rate, significantly more than outflows. Unless buying picks up, ETH could face more short-term downside.
ETH Stuck Below $2.5K
Ethereum’s moving averages also show a mostly bearish picture. Short-term indicators like the 10-day to 30-day EMAs and SMAs are all signaling sell, with prices below key resistance levels around $2,500.
If Ethereum breaks above the $2,800–$2,850 resistance zone in the next 30 days, it could climb toward $3,000. This move may be backed by strong fundamentals and new inflows from ETH ETFs. But the current trend is weak, so a real breakout will need stronger buying momentum to hold. But if macro conditions worsen, it risks dropping to $2,280.
 June 21, 2025 at 1:47 pm #26567
In reply to: Forex Forum
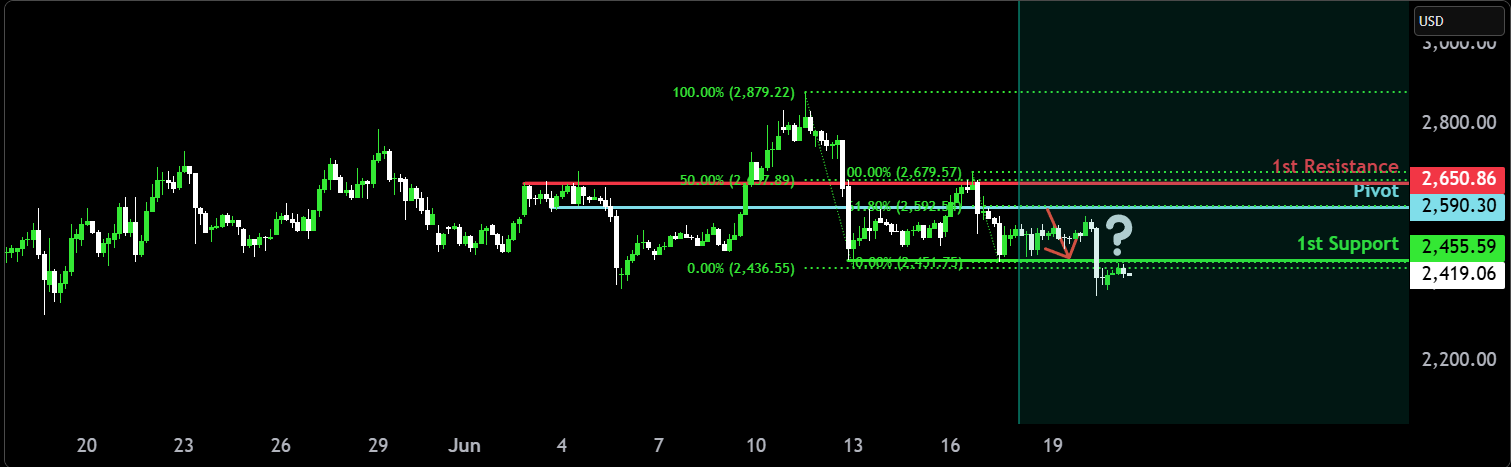
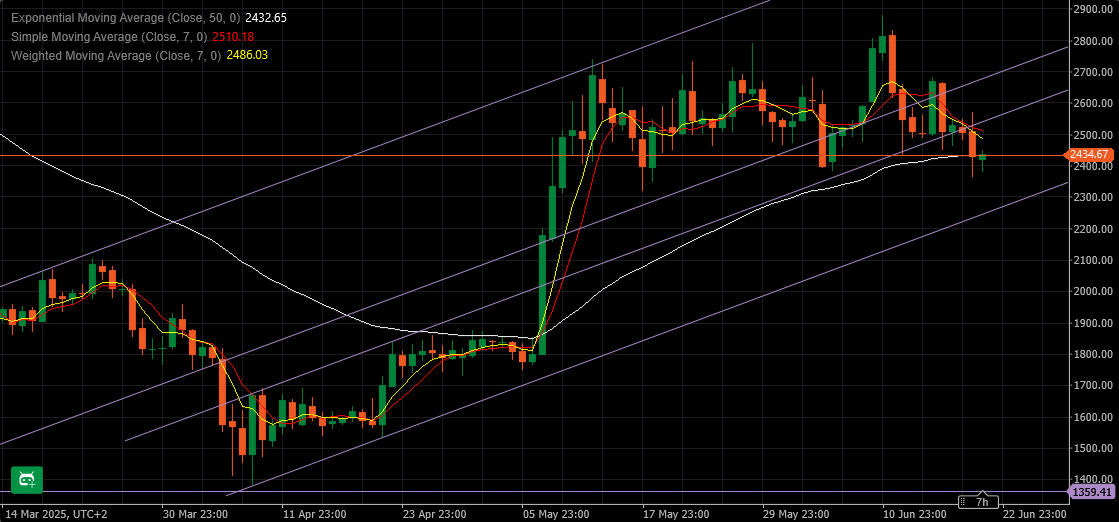
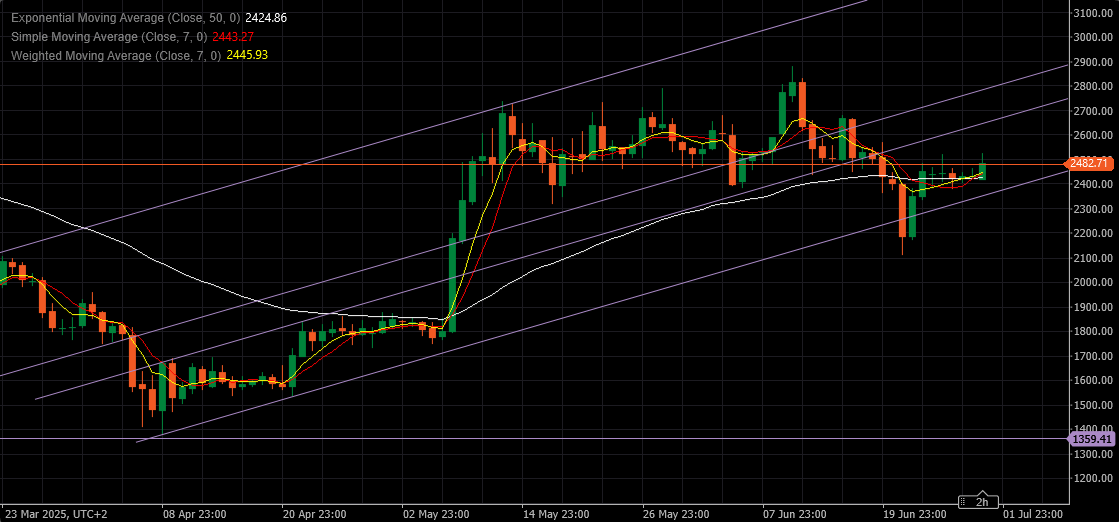
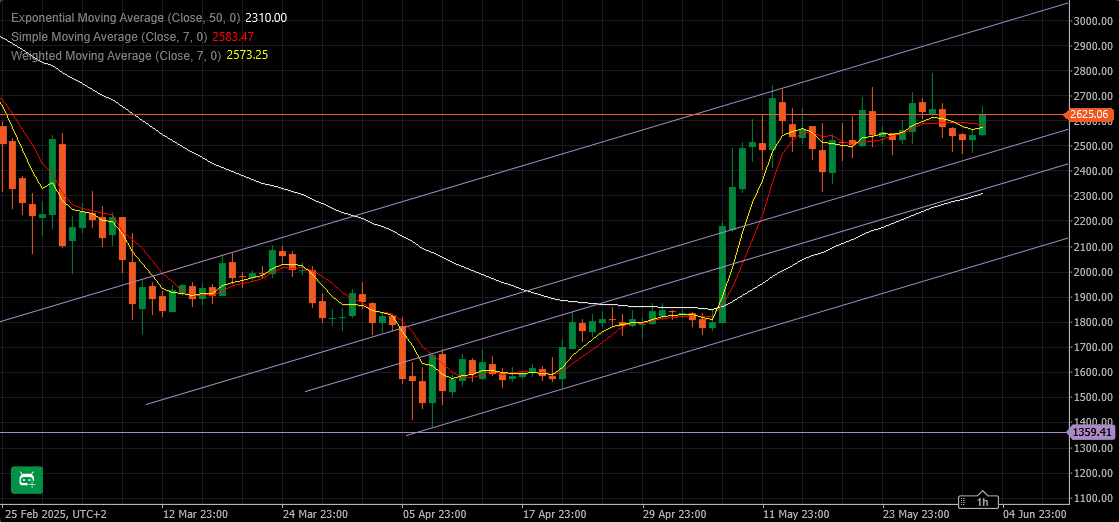
ETHUSD – Ethereum
Ether correcting nicely after hitting a high at 2880.00
Resistances: 2450.00, 2480.00 & 2505.00
Supports: 2380.00, 2365.00 & 2250.00
Ideal scenario would be for Ether to reach support trendline at 2250.00 and bounce back up – and continue towards current target in 3200.00 area
If however 2250.00 lost, the whole rally would be negated and would open a road for retest of 1380.00
 June 19, 2025 at 7:10 pm #26511
In reply to: Forex Forum
Ethereum Analysts Eyes High Timeframe Close – Range Break Above $2,800 Could Be Violent
Ethereum is currently facing a pivotal moment as it continues to consolidate below the $3,000 level. Bulls are targeting a breakout above this key resistance zone, which could trigger a major upward move. However, broader market conditions remain fragile. Geopolitical tensions—particularly the ongoing conflict between Israel and Iran—continue to create a high-risk macroeconomic environment, leading to increased volatility and intermittent selling pressure across risk assets.
Despite these challenges, ETH has shown resilience by holding above the $2,500 support zone. The price has remained locked in a narrow trading range for weeks, reflecting market indecision and caution among participants. According to a technical analysis shared by top analyst Daan, Ethereum continues to trade within this very tight range, with price wicks on both sides consistently getting absorbed. This type of price action signals growing compression, often a precursor to a strong directional move once one side gives in.
Traders are now closely monitoring the structure for a higher timeframe close above $2,800, which could validate bullish momentum and open the path toward $3,000 and beyond. Until then, the market appears balanced, and any shift in geopolitical developments may quickly tilt sentiment in either direction.
Ethereum Prepares For Breakout as Market Awaits Confirmation
Ethereum remains over 60% below its 2024 high of $4,100, but the asset is showing signs of recovery after months of downward pressure and indecision. Bulls have struggled to regain control throughout the year, but recent price action indicates the start of a potential rally. This recovery, however, remains tentative and will require confirmation through a higher timeframe close above critical resistance levels, particularly the $2,800–$3,000 range.
The broader environment continues to weigh heavily on sentiment. Escalating geopolitical tensions in the Middle East, coupled with macroeconomic uncertainty—including rising U.S. Treasury yields and concerns about inflation—are creating headwinds for risk assets, Ethereum included. Despite this, ETH has managed to hold key support above the $2,500 level, a sign that bulls are defending their ground.
 June 14, 2025 at 1:39 pm #26275
In reply to: Forex Forum
June 10, 2025 at 2:48 pm #26069In reply to: Forex Forum
June 6, 2025 at 12:23 pm #25935In reply to: Forex Forum
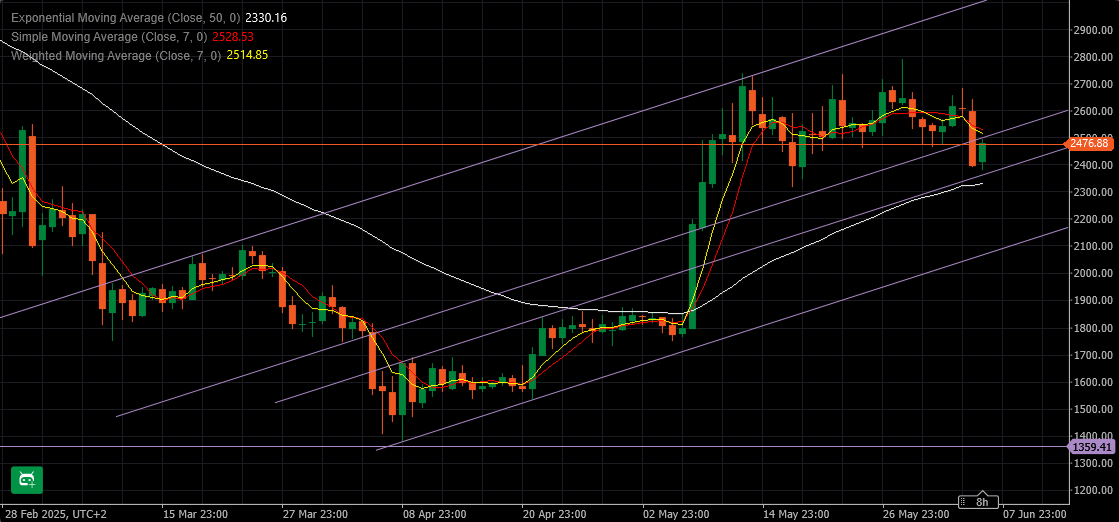
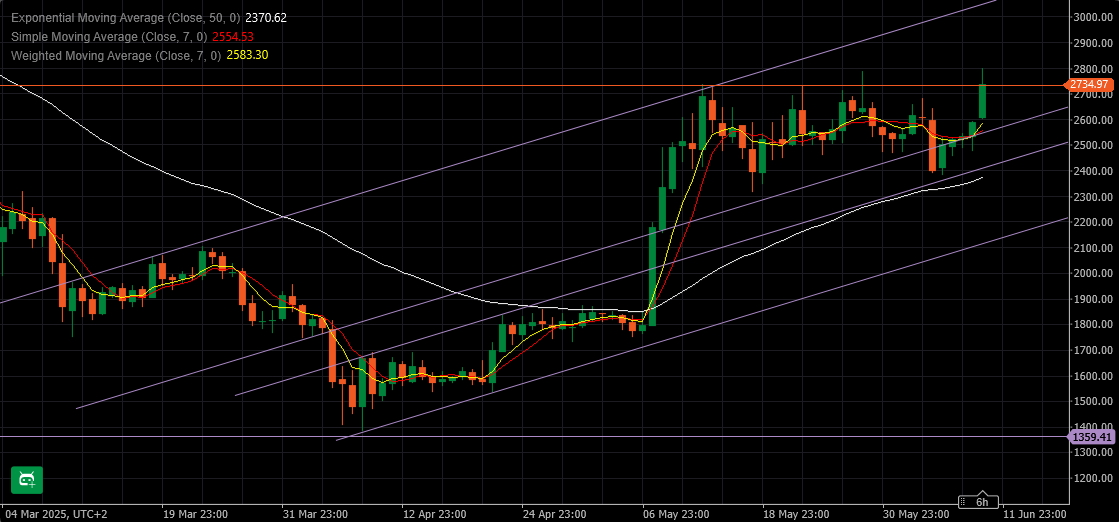
ETHUSD – Ethereum
Ether lost 2570.00 support, went through 2495.00 and all that last night.
Sometimes it is not enough to know the direction up front, but you have to be present to act…
Resistances: 2495.00, 2550.00 & 2640.00
Supports: 2360.00, 2205.00 & 2085.00
Failure to move back above 2495.00 confirms that correction is not only under way, but might lead all the way to 2085.00
 June 5, 2025 at 5:42 pm #25897
In reply to: Forex Forum
June 4, 2025 at 3:59 pm #25833In reply to: Forex Forum
June 4, 2025 at 11:30 am #25810In reply to: Forex Forum
Ether poised for ‘significant breakout’ as ETH price strengthens vs BTC
Key takeaways:
Ether’s price is up 46% in 30 days.
ETH/BTC is up 30% in the past month, signalling stronger demand for Ether.
Spot Ethereum ETFs see 12 consecutive days of inflows.
Ether’s price is up by 7% over the last three days, leading to optimism among traders that the biggest altcoin is ready for a breakout. Interestingly, the ETH/BTC trading pair has also increased, boosting Ether’s recovery prospects in the coming days.
Ether’s ETHUSD price trading at $2,630, up 46% over the last 30 days.
Ethereum is trying to reclaim $2,500 as support and solidify it as the new range low of the $2,500-$4,000 macro range
Altseason coming? Ether gains on Bitcoin
The ETH/BTC pair is also up 30% over the last month, reaching a 10-week high of 0.02618 on May 14. ETH/BTC trades at around 0.02503, up 48% from the multi-year low of 0.01766 reached on April 22.
If you want to track how altcoins are likely to perform relative to $BTC, one of the main factors will be the $ETH/BTC chart strength.
Spot Ether ETF inflows continue
The rise in the ETH/BTC ratio indicates increased demand for Ether, with institutional investors opting for ETH over BTC in the past few days.
US spot Ethereum ETFs have witnessed net inflows for twelve consecutive days.
 June 3, 2025 at 7:13 pm #25782
In reply to: Forex Forum
May 25, 2025 at 12:37 pm #25354In reply to: Forex Forum
May 24, 2025 at 2:35 pm #25348In reply to: Forex Forum
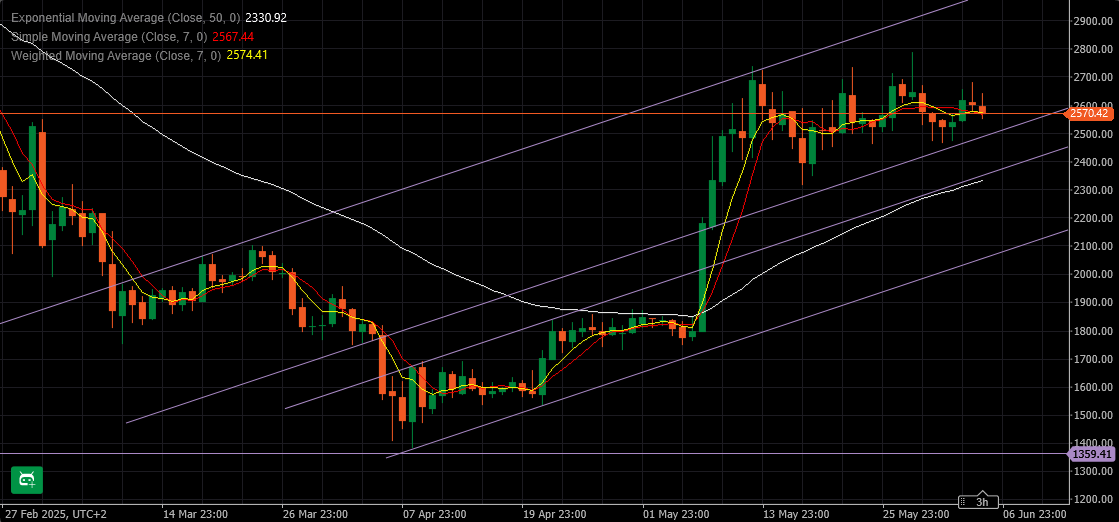
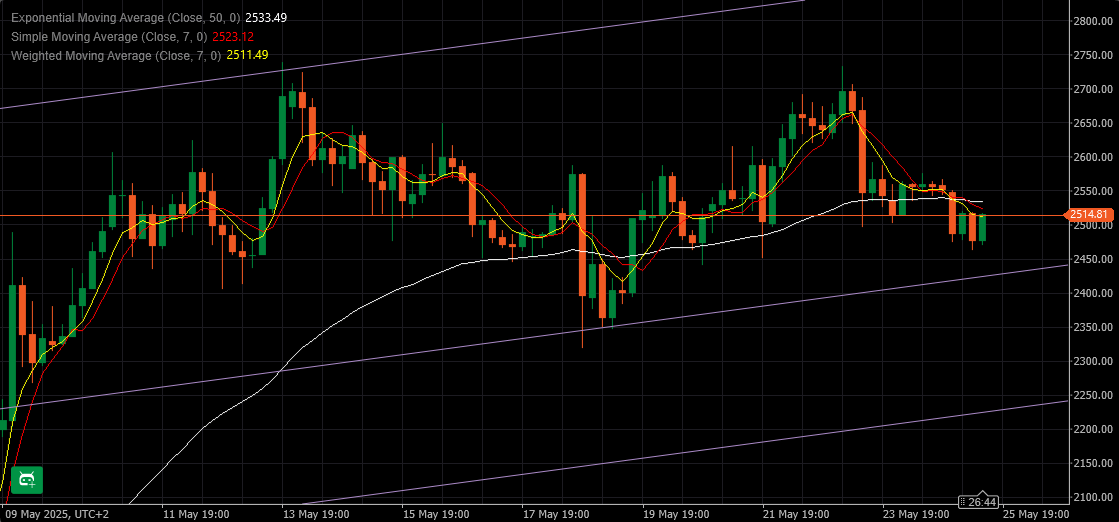
ETHUSD – Ethereum 4h
Ethereum is in a similar position as Bitcoin when it comes to intraday situation.
However, there is one significant difference – Ethereum has Double top above it….
It is at 2735.00
Supports: 2540.00, 2450.00 & 2395.00
Resistances: 2575.00, 2735.00 & 2855.00
As long as above 2395.00 ETH has a chance breaking above that double top and reaching levels around 3.000
 May 23, 2025 at 2:49 pm #25306
In reply to: Forex Forum
Ethereum Leads Altcoin Rally with Solana and Dogecoin – Best Crypto to Buy Now
SOLUSD+0.95% DOGEUSD−3.67%
Bitcoin broke all previous records over the past 24 hours, hitting a new all-time high of $111K.
This is particularly remarkable if we remember that $BTC was still languishing around $75K in early April. This marks a 50% increase in under two months.
$BTC’s newfound momentum seems to have rubbed off on other top cryptos as well, including Ethereum, Dogecoin, and Solana:
· $ETH is already up 45% in May, currently trading at around $2,570.
· $SOL is trading at around $177 after a +20% bump this month.
· $DOGE isn’t far behind, with gains of over 30%; the coin is now trading at $0.2328.
Christmas came early in May, with a sharp crypto reversal and no signs of stopping anytime soon. Ethereum, not Bitcoin, is at the forefront of this crypto rally, though. $ETH’s daily gains have beaten $BTC’s recently.
The number of active daily users on Ethereum DEX has also jumped to 64,000, the highest in three months.
What’s more, $ETH’s current DEX volumes of around $15B suggest increasing market participation in the coming months.
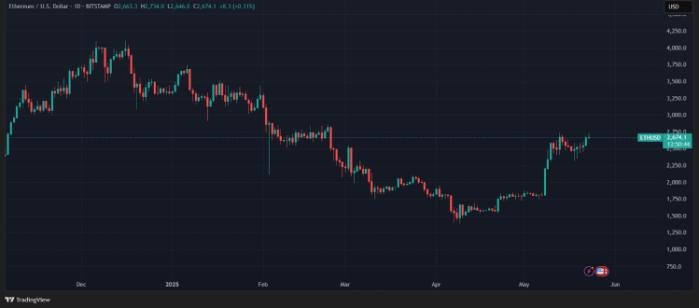
ETHUSD Chart
 May 18, 2025 at 4:04 pm #25028
In reply to: Forex Forum
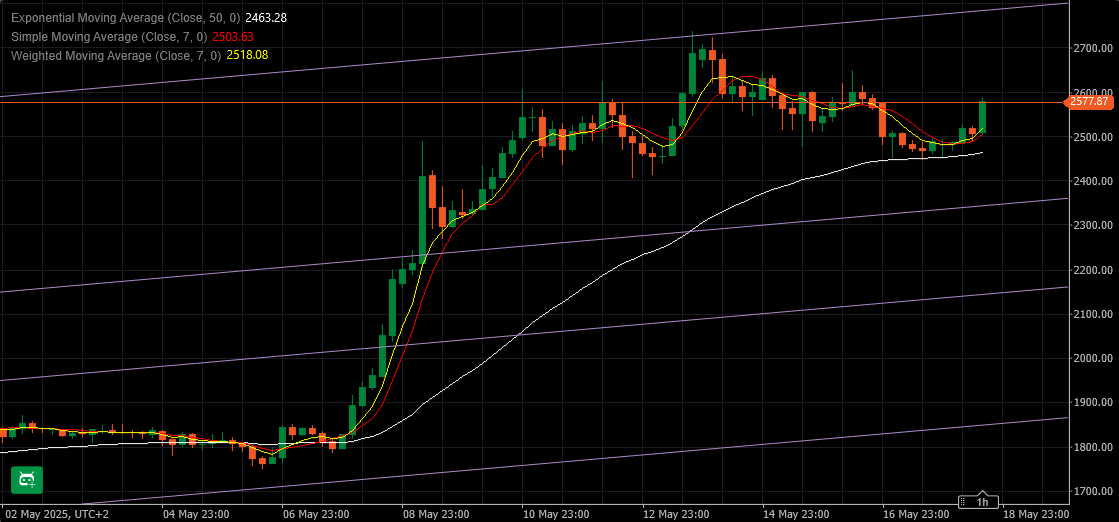
ETHUSD – Ethereum 4h
Ethereum trying to follow the suit by Bitcoin, but that is where all similarity ends.
ETHUSD is far far away from the All time high, and it has to mature to be able to reach that again.
Supports: 2550.00, 2525.00 & 2490.00
Resistances: 2605.00, 2650.00 & 2740.00
Overall target of this move should be somewhere in 2795.00 area
 May 17, 2025 at 8:56 am #25013
In reply to: Forex Forum
Ethereum Price Risks Further Crash To $2,350 With Lower Lows Formation
The Ethereum price has ranged low now after making a new monthly high back on Tuesday. This increase had come as a much-needed relief for the crypto market, which had watched the ETH price struggled while Bitcoin thrived. However, the bullish breakout has not lasted long as bears have once again taken control and sellers are now dominating. Given this recent trend, it is possible that the Ethereum price has seen the end of price decline.
Ethereum Lower Lows Present Troubling Trend
The opening range for the week had established the current monthly high before breaking low. This showed an entry of large players into the market as the Ethereum price was pushed up rapidly to touch the $2,700 mark for the first time in over a month. This had set a bullish tone for the week, following into the next day as Tuesday also showed recovery strength,
The next day, Tuesday, the Ethereum price did pump once again and placed a higher high than Monday, suggesting that a continuation was in play. The day also closed out in the green as ETH bulls remained dominant through the trading day.
By Wednesday, there had been a turn in the market, whereas the previous days were dominated by bullish rallies, consolidation was the order of the day. This brought the Ethereum price back inside the opening range high of the week and then marked the first red close of the week.
This first red close,was a bearish signal. It initially didn’t signal that the Ethereum price would continue to crash. However, it did show that the bullishness that began on Monday might finally be over. Then, by Thursday, it was already a full-blown reversal as the market tested the previous day’s lows. Thursday’s red close was just as bearish as the market turned in expectation of bearish news.
There could be a possible breakdown of the price. In this case, the Ethereum price could again crash back below $2,400, wiping out a notable amount of gains accumulated over the last few weeks.
 May 12, 2025 at 8:32 pm #24745
In reply to: Forex Forum
May 11, 2025 at 4:18 pm #24666In reply to: Forex Forum
Ethereum to $10K ‘can’t be ruled out’ as ETH price makes sharp gains vs. SOL, XRP
Key points:
· Ether has rebounded from key parabolic and triangle support levels, reviving the case for a $10,000 breakout.
· Historical fractals and RSI recovery mirror past pre-rally setups seen in 2016 and 2020.
· Altseason signals and strength against rivals like SOL and XRP boost Ethereum’s potential to outperform.
Ether ETHUSD, Ethereum’s native token, has soared over 44% in just three days to surpass $2,600 on May 11, fueling fresh speculation of a run toward $10,000 in the coming months.
A mix of fractal setups as well as Ether’s potential to outperform its top-ranking rivals, Bitcoin BTCUSD, Solana SOLUSD, and XRP XRPUSD, are serving as some catalysts behind the five-figure price prediction.
ETH’s “up band” target is around $10,000
Ether’s long-term price action continues to follow a parabolic curve that has defined its major market cycles since 2015.
As of May 2025, ETH has rebounded from the curve’s lower boundary near $2,100 — a historically significant support zone that has previously triggered major rallies.
If this parabolic trajectory holds, Ethereum’s next move could be toward the upper boundary of the curve, which currently intersects near the $10,000 level.
 May 10, 2025 at 12:29 pm #24650
In reply to: Forex Forum
ETHUSD Daily
Supports: 2365.00, 2345.00 & 2265.00
Resistances: 2435.00, 2490.00 & 2545.00
As 98K is for BTC, 2545.00 is for Ethereum – needs to go above it to have a sustainable Rally.
If it does succeed, we’ll be seeing 3500.00 fairly soon, but if not test of supports would be in line.
1360.00 is that important level that needs to hold for Ethereum to continue Up.

-
AuthorSearch Results


Search
© 2024 Global View