
- This topic has 27,907 replies, 54 voices, and was last updated 23 hours, 36 minutes ago by Mtl JP.
-
AuthorPosts
-
May 15, 2025 at 12:20 pm #24908
Traders Eye Data Deluge as US Equity Futures Drop Pre-Bell
US equity futures were lower pre-bell Thursday as traders looked ahead to a deluge of economic data.
Dow Jones Industrial Average futures slipped 0.4%, S&P 500 futures fell 0.4%, and Nasdaq futures were down 0.6%.
Oil prices fell, with front-month global benchmark North Sea Brent crude down 3.1% at $64.05 per barrel and US West Texas Intermediate crude 3.2% lower at $61.13 per barrel.
New unemployment claims, scheduled for release at 8:30 am ET, are seen rising by 1,000 to 229,000 in the week ended May 10. Producer prices are seen to have risen by 0.2% for the final demand for April following a 0.4% downtick in the preceding month. No change is expected for retail sales for April after March’s 1.4% increase.
Forecasters see industrial production, due at 9:15 am ET, rising by 0.2% for April following a 0.3% drop in the preceding month.
Business inventories, slated for 10 am ET, is expected to have risen by 0.2% in March. No change is expected for the housing market index at 40.0 for May.
May 15, 2025 at 12:16 pm #24907Is the XRP price rally over for now?
Key takeaways:
· XRP forms a double top and rising wedge, signaling short-term downside risk toward $1.94.
· NUPL indicates traders are in denial, resembling past pre-crash phases.
· Long-term charts still point to bullish targets between $3.69 and $17.
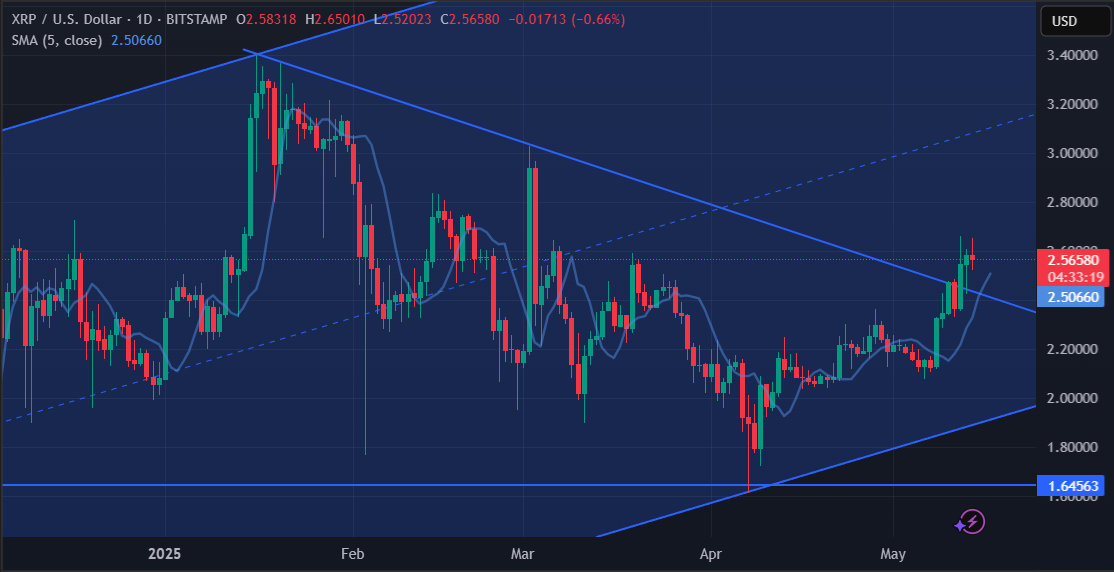
XRP XRPUSD has rebounded by more than 50% in a month after forming a local low at $1.80. Improving risk appetite and prospects of an “altseason” have boosted its price.
Could XRP rally further from current levels or risk a pullback in the coming days? Let’s examine.
XRP “double top” pattern hints at sell-off
XRP formed a double top near $2.65, signalling a possible trend reversal. The pattern includes two clear peaks and a neckline around $2.47. After the second peak, XRP dropped below the neckline, confirming the bearish setup.
A confirmed breakdown below this level points to a downside target near $2.30. The double top suggests weakening momentum after a strong rally. If buyers fail to break above $2.65, the pattern remains in play and bearish.
Rising wedge hints at possible 20% XRP price crash
XRP also broke down from a rising wedge pattern, signalling a shift from bullish to bearish momentum. Recent failed attempts to break above the pattern’s upper trendline from the pattern reiterate the same.
 May 15, 2025 at 12:03 pm #24905May 15, 2025 at 11:49 am #24903
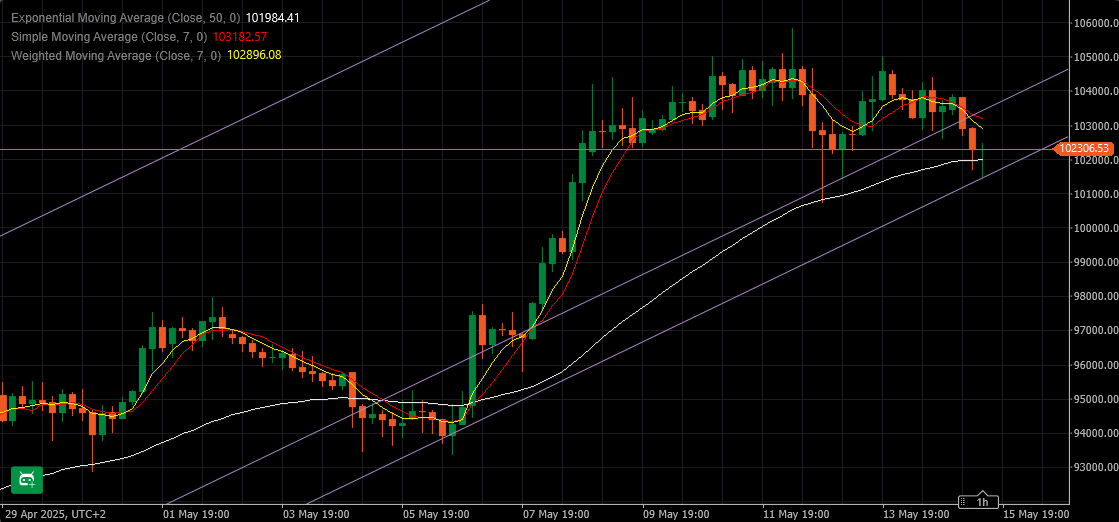
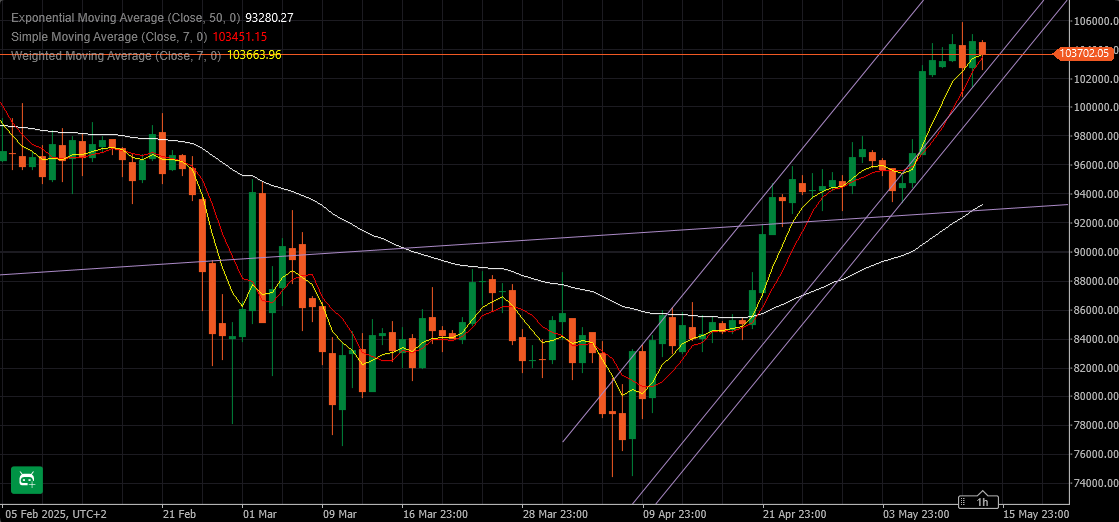
BTCUSD 4h
Support at 101.500 so far holding.
Another one is just below it – 100.700
If this is a correction starting ( or some kind of consolidation) , it shouldn’t go lower then 97.750
Bitcoin has to break back Up over 103.500 in next couple of hours to be able to continue Up, and if so this down pressure would be negated.
 May 15, 2025 at 11:20 am #24902
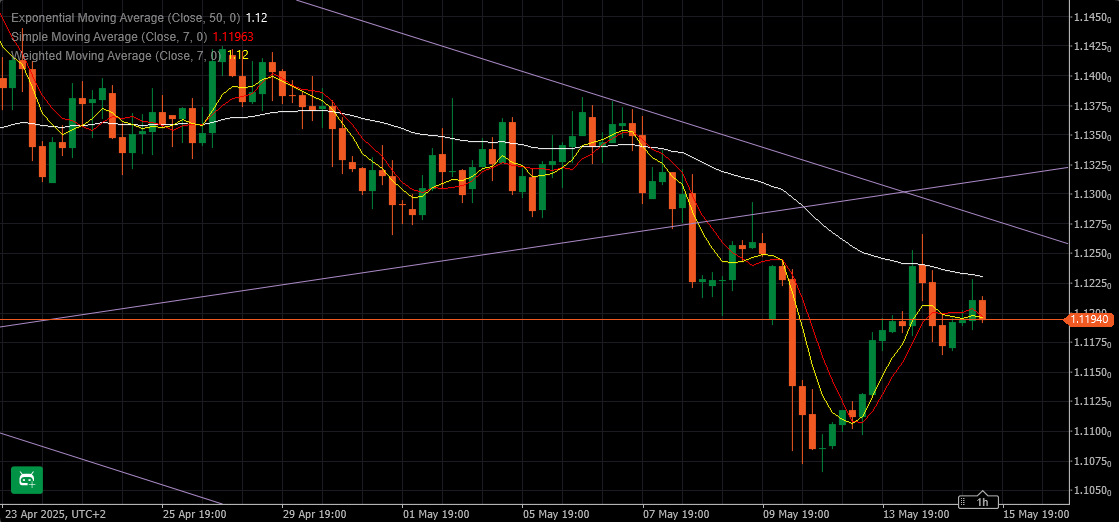
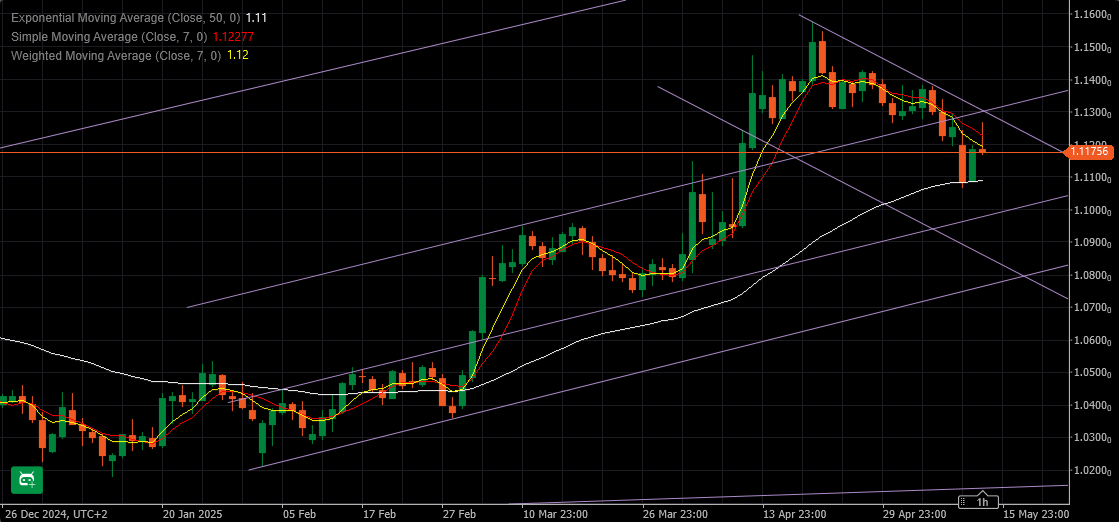
EURUSD 4h
1.11850 is a crucial now on the down side.
Break of will open a road for attack at 1.11600 & 1.11300
Close of this bar below 1.11900 would be start of new down wave.
However, close above 1.12050 would negate it and 1.12300 would be target once again.
Strong data coming in a bit over an hour.
 May 15, 2025 at 11:03 am #24900May 15, 2025 at 10:43 am #24899May 15, 2025 at 10:30 am #24898May 15, 2025 at 10:22 am #24897
For consensus forecast for today’s data, see our Economic Data Calendar
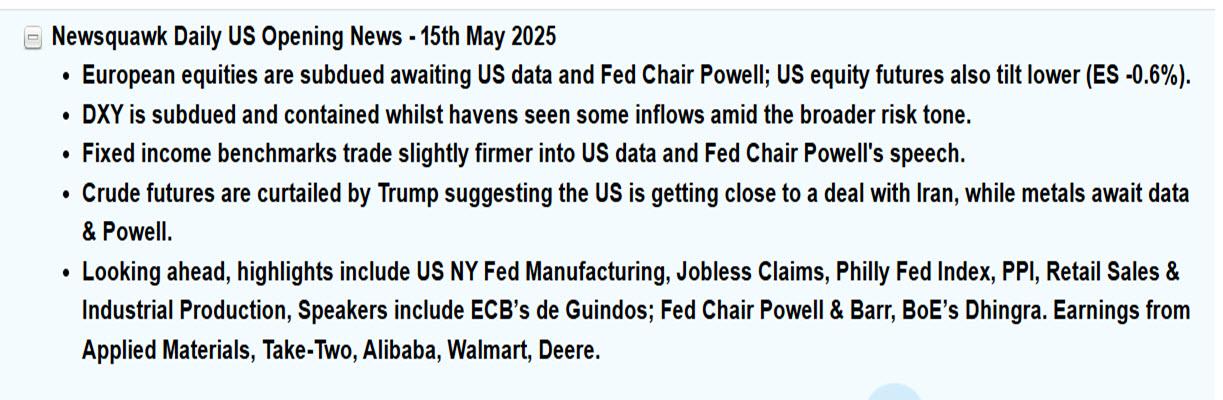
May 15, 2025 at 10:13 am #24894It’s looking very much like another “risk-off” day for the markets today, where stocks, the dollar and commodities are down, while bond prices are ticking up and safe-haven currencies like the Japanese yen and the Swiss franc are enjoying a rally.
The sugar rush earlier this week from the U.S./China trade truce seems to have given way to a sugar hangover. Traders seeking another hit will now be scouring data on U.S. consumer spending and various surveys of regional business activity, while also hoping to hear soothing words from Fed Chair Jerome Powell…. Reuters
May 15, 2025 at 10:04 am #24893May 15, 2025 at 9:41 am #24892May 15, 2025 at 9:33 am #24891Scanning the headlines this caught my attention as how talks play out will indicate whether Trump is viewing tariffs as a revenue source and as he says fair trade, not free trade.
 May 15, 2025 at 9:18 am #24890
EURUSD 4 HOUR – The “65” level
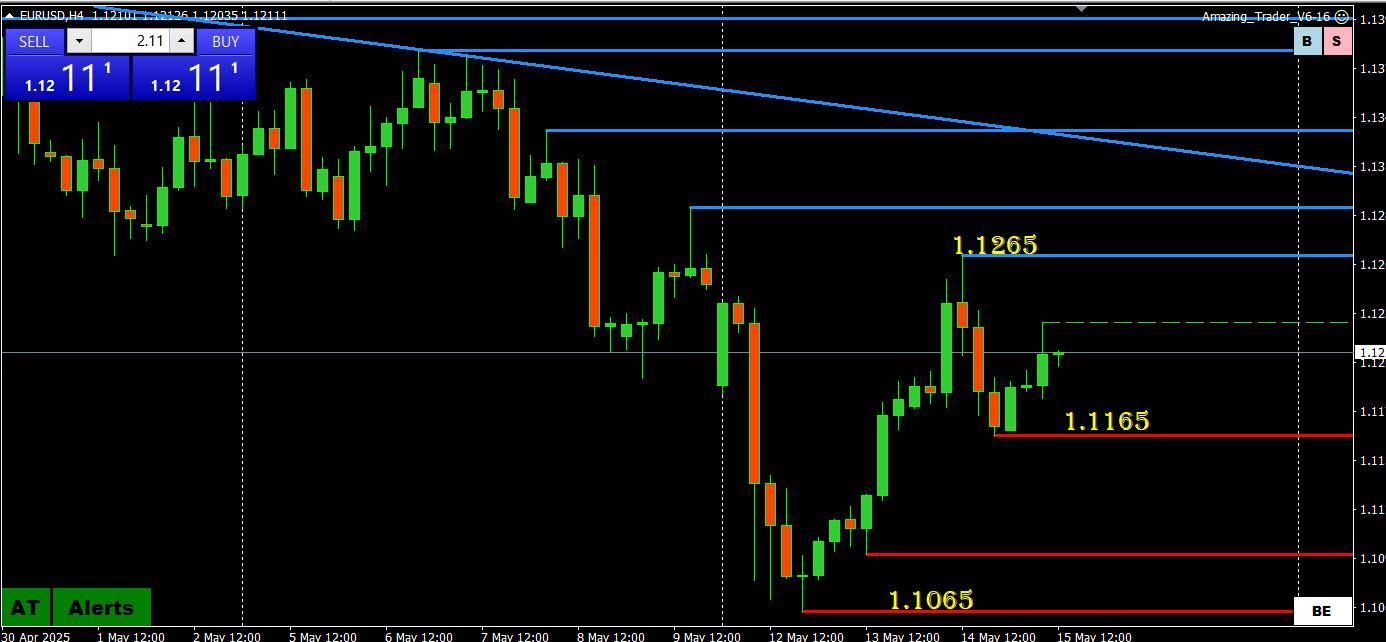
This may be just a coincidence but the “65” level has been a factor this week.
1.1065 (Monday low) => 1.1265 (wed high) => 1.1165 (Wed low)
I have a theory on this that I will discuss at a later date… meanwhile maybe this is just a coincidence but certainly worth noting.
May 15, 2025 at 9:10 am #24889May 15, 2025 at 8:59 am #24888Using my platform as a HEATMAP shows

… the dollar trading softer after not following through on yesterday’s firmer close, JPY outperforming
Focus on the USDKRW which traded higher and pulled Asian currencies along with it after a report the that forex was discussed at a meeting with the U.S. last week
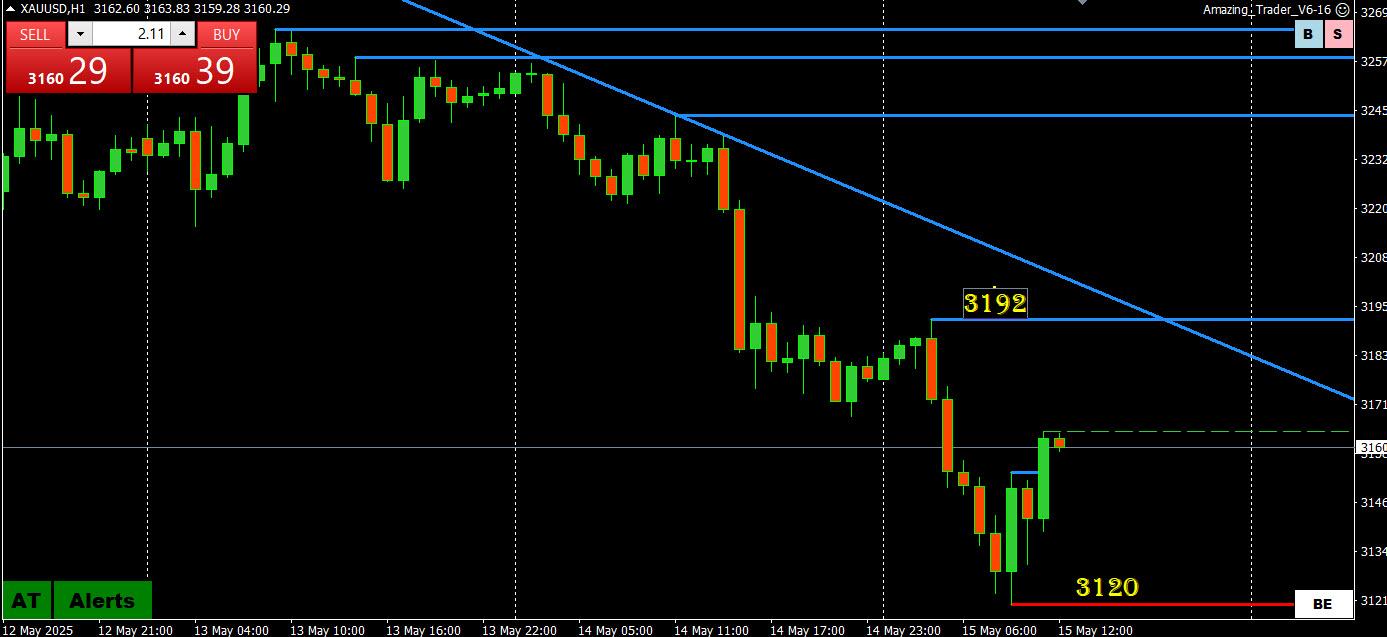
Gold extended low to 3120 before a bounce
US stocks down
Lookming ahead
U.S. retail sales, Powell speech, Walmart earnings
May 14, 2025 at 10:46 pm #24887May 14, 2025 at 10:29 pm #24886May 14, 2025 at 9:35 pm #24885May 14, 2025 at 8:39 pm #24881May 14, 2025 at 8:34 pm #24880May 14, 2025 at 8:33 pm #24879AUDUSD 4 HOUR – What AT is showing
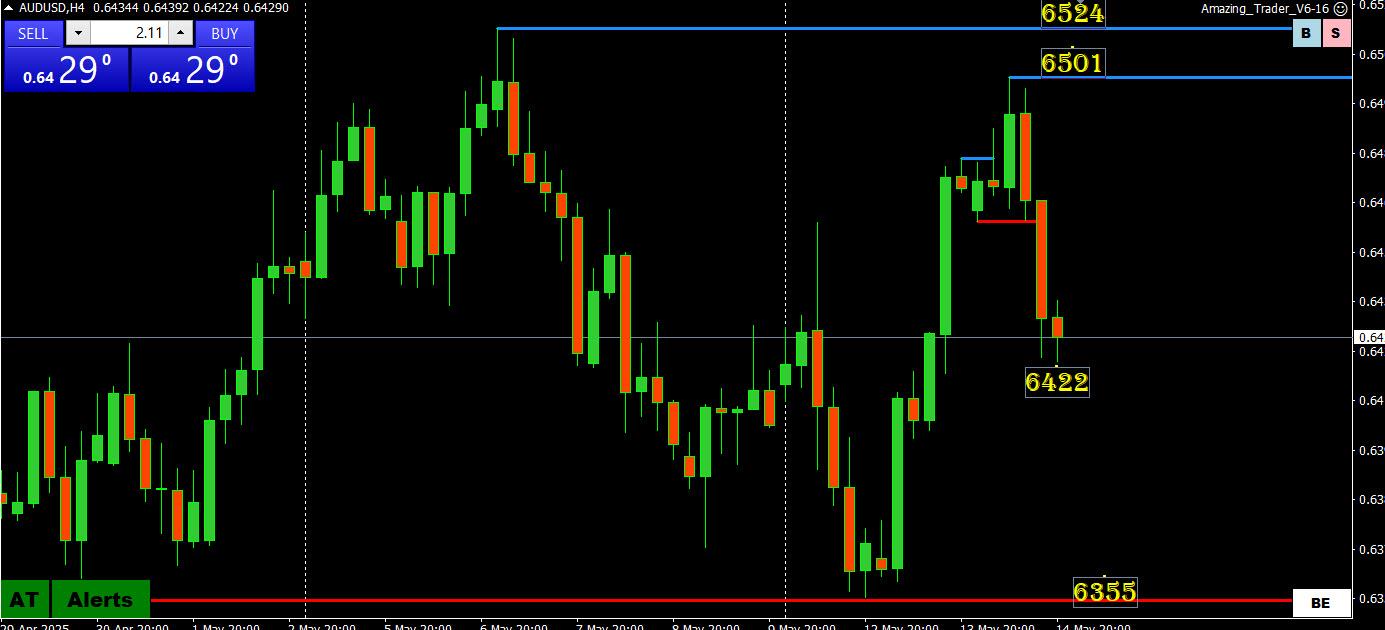
Upside failure to establish 6500+ and test 6524 have forced a retracement.
Key level is at 6355. an inviting target but only below there would confirm the end of this up episode.
One change now is that there are no key stops to run on the upside unless .6501 is taken ouit.
May 14, 2025 at 8:28 pm #24878NAS100 (NASDAQ) DAILY – What AT is showing

Keep this simple: Only level left is the record 22224 hig,, a potentially tough one to crack.
To make a run at it, 21059 needs to hold as support.
Only back below 19584 (or a clear failure to break the high) would negate the upside risk.
AT = The Amazing Trader
Get your 30 day trial by clicking on the Amazing Trader link un the menu bar at the top of this page)
May 14, 2025 at 8:24 pm #24877XAUUSD (GOLD) 4 HOUR CHART – What AT is showing?
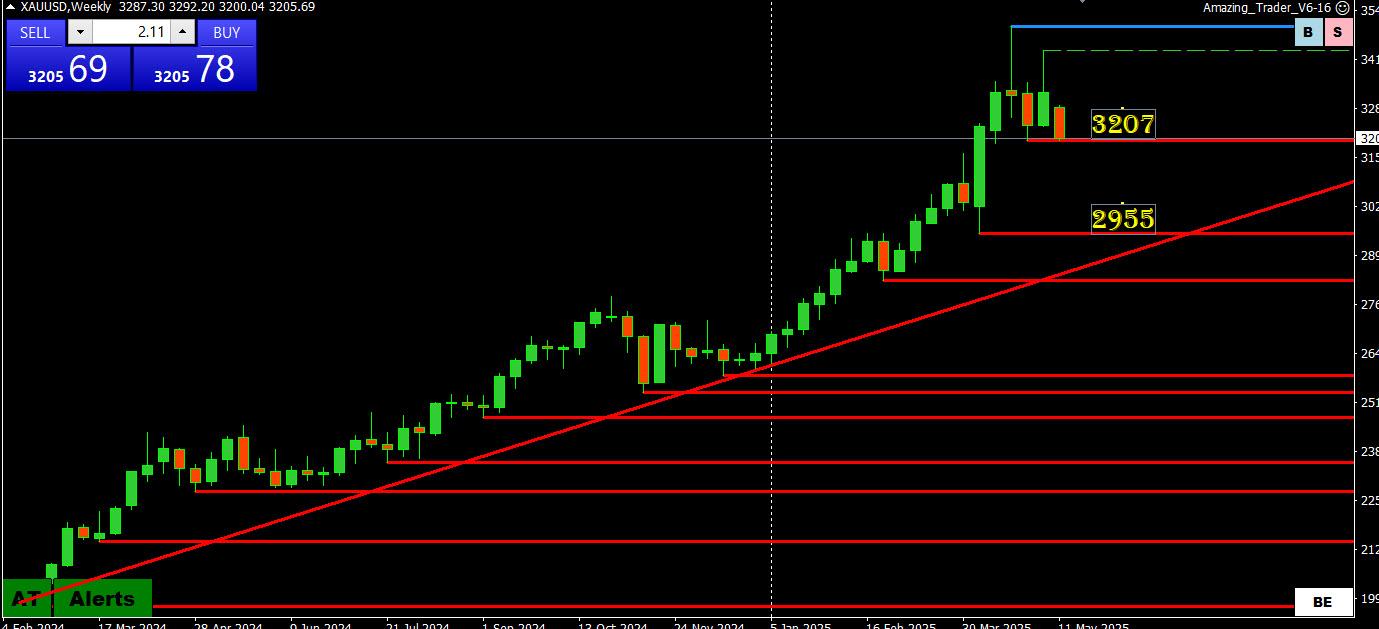
Break of 3200 continues the retreat from the record 3500 high.
Longer-term charts show a void until 2955… so unless 3200+ is regained, market will have to find a low on its own.
One possibility is 3150, which represents a 10% fall from 3500. I only point this out because it is a Power of 50 level.,
May 14, 2025 at 7:32 pm #24876May 14, 2025 at 7:25 pm #24875BTCUSD – Bitcoin
Bitcoin lost momentum and if it doesn’t make it tomorrow over 105.850, consolidation will be on cards at least…if not a full correction all the way to 93K
Supports: 102.600 & 100.950
However, if it does manage to go over 105.850 it is going to target immediately 109.500 and 112.500 after it.
 May 14, 2025 at 7:19 pm #24874
EURUSD Daily
Resistances: 1.11950, 1.12300 & 1.12650
Supports: 1.11650, 1.10950 & 1.10650
Tomorrow is the day filled with data, starting with UK, EU and USA at the end.
Base your trades on at least Hourly chart ( or smaller if you are familiar with it) , keep in mind that the playfield is 200 pips : 1.10650-1.12650
 May 14, 2025 at 6:23 pm #24873May 14, 2025 at 6:20 pm #24872
If this is true, then it is Bessent’s influence, not Trump’s view… probably influenced by the bout of a weaker USD leading to a flight from US assets
 May 14, 2025 at 6:07 pm #24871
 -
AuthorPosts




- You must be logged in to reply to this topic.
Search
© 2024 Global View