
- This topic has 28,094 replies, 54 voices, and was last updated 5 minutes ago by GVI Forex 2.
-
AuthorPosts
-
June 17, 2025 at 3:44 pm #26395June 17, 2025 at 3:32 pm #26394June 17, 2025 at 3:09 pm #26393
What’s Hot and What’s Not?
What’s Hot?
USD firmer but off its highs… not news driven
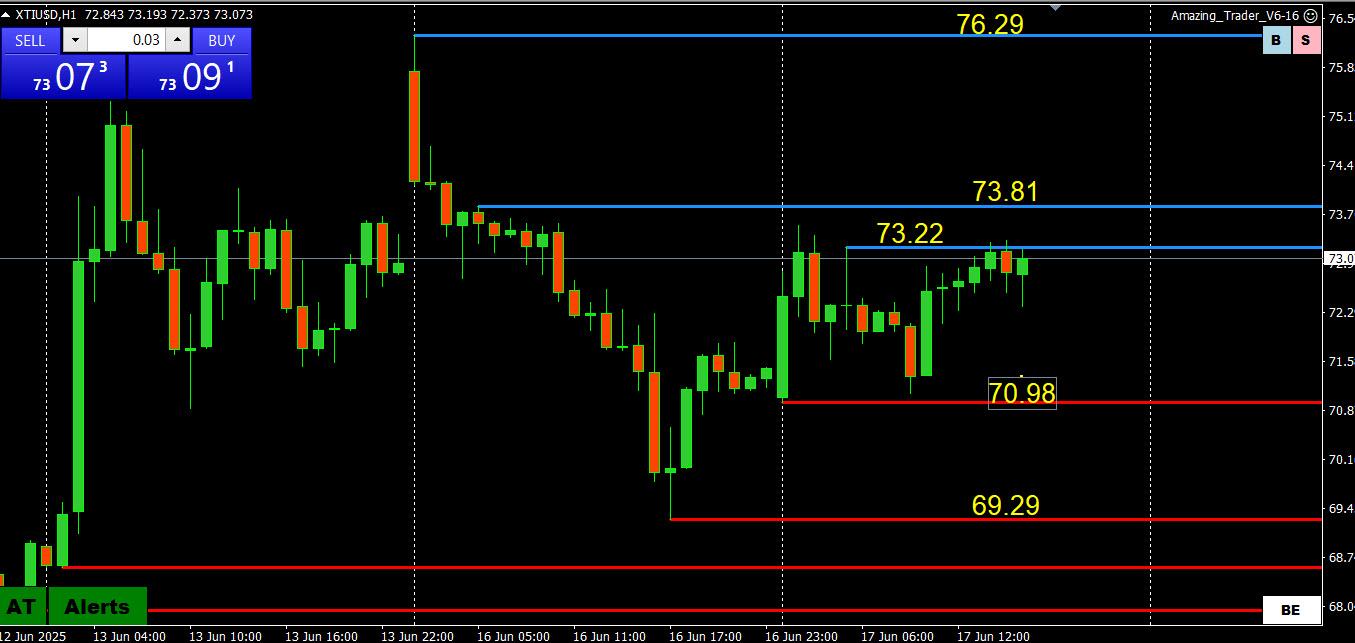
Crude oil up but XTIUSD paused dead on at the top of the 71.00-74.00 consolidation range
What’s Not?
Any currency other than the USD BUT… EURUSD holding above 1.l500 (low 1.,1511) and GBPUSD found support below 1.35… USDJPY trading above 145
GOLD down but off earlier low
US stocks: Down on the day but with a slight bid
 June 17, 2025 at 2:23 pm #26390June 17, 2025 at 1:36 pm #26389
Watch these Bitcoin price levels ahead of Fed Chair Powell’s speech
Key takeaways:
· Fed rate interest cut odds this week are now less than 0.1%.
· BTC price may drop as low as $92,000 if key support levels are broken.
Bitcoin’s BTCUSD price failed another attempt at breaking above the resistance at $110,000 on June 17, as tensions in the Middle East escalated. Since June 5, BTC price has been unable to break above $112,000.
With the Federal Open Market Committee (FOMC) meeting set to take place June 17-18, markets could see volatile price swings toward key BTC price levels over the next few days. The policy decision on the interest rate will be made on June 18 at 2.00 pm ET.
99.9% chance interest rates won’t change
There is a 99.9% chance that the current interest rates will remain between 4.25% and 4.50%, leaving just a 0.1% probability of a 0.25% rate cut, according to CME’s FedWatch tool.
However, market participants believe that any bearish price action from unchanged interest rates is already priced in.
Market participants have now turned their focus on Jerome Powell, the US Fed chair’s speech after the FOMC meeting. The Federal Reserve and Powell are under pressure from US President Donald Trump to lower interest rates.
Therefore, the market will keenly watch Powell’s language at the FOMC press conference to see if there is any shift in tone.
“If Powell comes out dovish, that’s extra fuel for the bulls,”
“With negative funding, it’s the bears who are now overexposed, … and that opens the door for a potential squeeze.”
there’s a 42% chance that Bitcoin’s price will drop to $100,000 by June 30, with a 23% possibility of hitting new all-time highs above $115,000.
Key Bitcoin price levels to watch
Bitcoin must flip the all-time high at $112,000 into support to continue its uptrend into price discovery.
For this to happen, BTCUSD must first regain its position above the psychological level at $108,000. The last time this level was broken was on May 21, when Bitcoin rallied to new all-time highs.
Above that, there is a major supply zone stretching from $109,000 to $110,500, which the bulls will also have to overcome.
Conversely, the bears will attempt to keep the $106,000 resistance in place, increasing the likelihood of pulling the price lower. A key area of interest lies between $104,000, where the 50-day simple moving average (SMA) currently sits, and the previous range lows at $102,800, reached on June 13.
 June 17, 2025 at 1:33 pm #26388June 17, 2025 at 1:31 pm #26387June 17, 2025 at 1:27 pm #26386
Fed Policy-Setting Meeting Begins as US Equity Futures Decline Pre-Bell
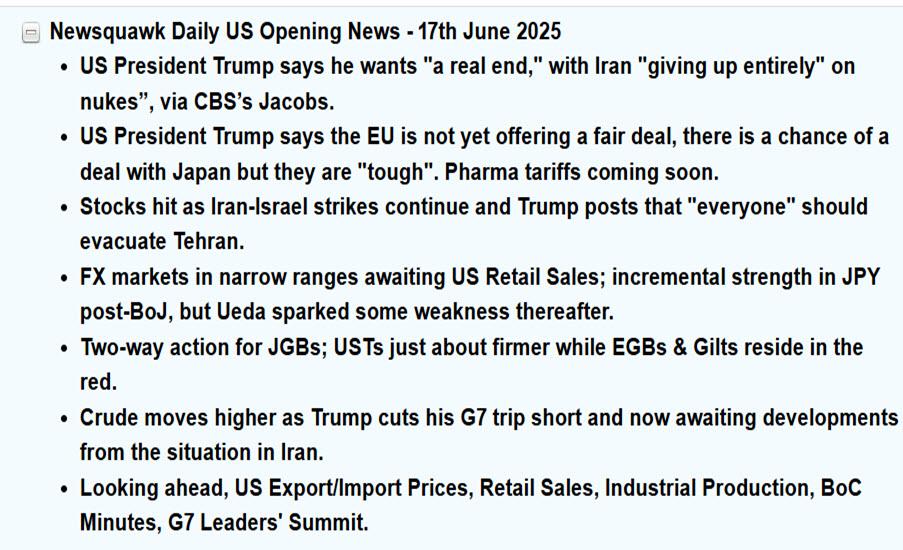
US equity futures were down before Tuesday’s opening bell as the Federal Reserve begins its meeting to discuss monetary policy while the ongoing Israel-Iran conflict continued to dampen investor sentiment.
Dow Jones Industrial Average futures, S&P 500 futures, and Nasdaq futures were all down nearly 0.5%.
Investors continued to monitor the ongoing Israel-Iran conflict, which has already entered its fifth day as the two countries continued to exchange attacks.
The policy-setting Federal Open Market Committee kicks off its two-day meeting Tuesday.
Oil prices were higher, with front-month global benchmark North Sea Brent crude up 1.6% at $74.37 per barrel and US West Texas Intermediate crude 1.5% higher at $71.28 per barrel.
The May retail sales report, released at 8:30 am ET, showed a 0.9% month-over-month decrease in retail sales following a 0.1% decline in April, compared with estimates compiled by Bloomberg for a 0.6% decrease. Import prices were flat in May versus estimates for a 0.2% decline, while export prices decreased 0.9% against estimates for a 0.2% decline.
The May industrial production report, due at 9:15 am ET, is expected to show a flat reading for the month to match the April report.
The housing market index, slated for 10 am ET, is expected to come in at 36 for June versus a 34 level in May. Meanwhile, no change is expected for business inventories for April.
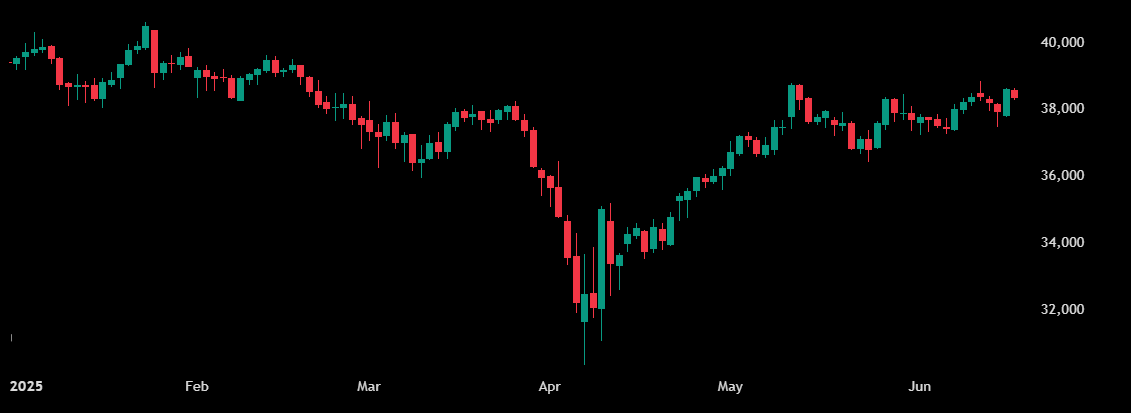
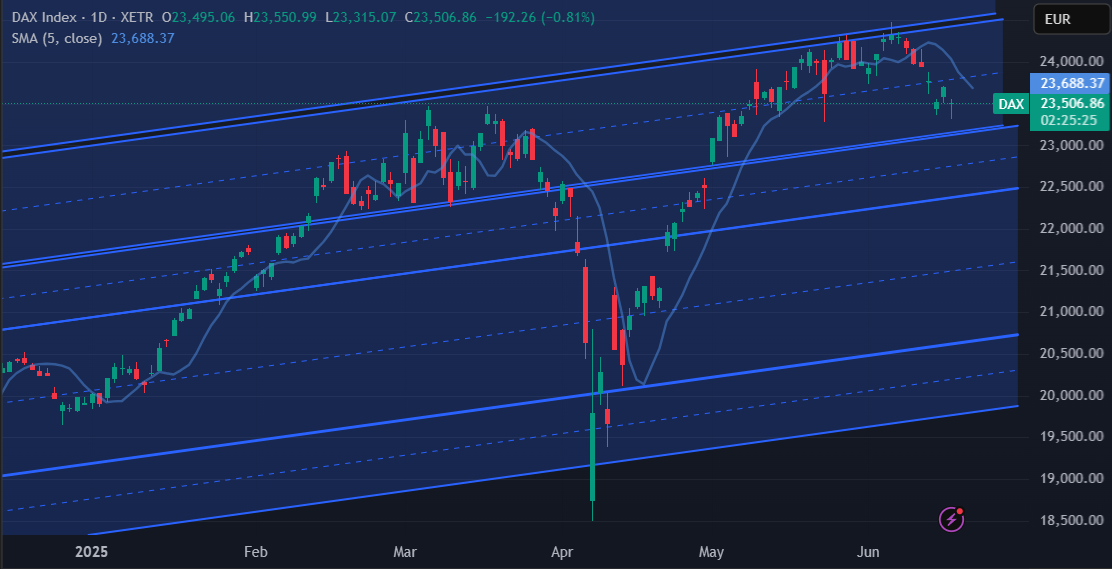
In other world markets, Japan’s Nikkei closed 0.6% higher, Hong Kong’s Hang Seng ended 0.3% lower, and China’s Shanghai Composite finished 0.04% lower. Meanwhile, the UK’s FTSE 100 was down 0.2%, and Germany’s DAX index was 0.9% lower in Europe’s early afternoon session.
In equities, Verve Therapeutics VERV shares were 76% higher pre-bell after the company agreed to be acquired by Eli Lilly LLY for up to $1.30 billion. BGSF BGSF stock was up 33% after the company said late Monday it has agreed to sell its Professional Division to Inspyr Solutions for $99 million.
On the losing side, shares of Enphase Energy ENPH, SolarEdge Technologies SEDG, and Sunrun RUN were down 20%, 31%, 36%, respectively, after the US Senate Finance Committee proposed a phase-out of solar and wind energy tax credits by 2028 as part of changes made to President Donald Trump’s tax-cut and spending bill.
Nikkei 225 chart
 June 17, 2025 at 1:25 pm #26385June 17, 2025 at 1:20 pm #26384
US Industrial Production misss on downside… usually not a market mover but USD and stocks dip on the data
 June 17, 2025 at 1:07 pm #26383June 17, 2025 at 12:35 pm #26382
Downside riss in US retail sales… back to square one after a brief flurry
 June 17, 2025 at 12:25 pm #26381
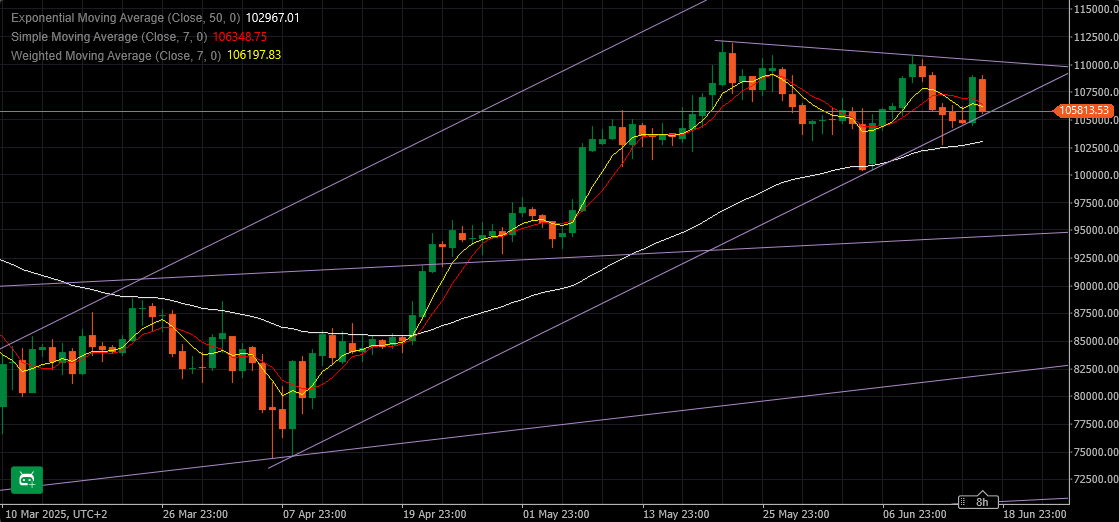
BTCUSD
This chart tells a whole story – few unknowns of course, but pretty clear.
BTC is stuck within two levels : 110.300 and 104.850
So which side will win??
Close tonight will be most important part of this day:
If it breaks below 104.850 and close there, BTC will go into some serious correction with the first target waiting at 90 K and even as low as 83K
In the case BTC manages to hold on support at 104.850 and closes above at least 106K ( 107+ would be more secure) it should attack tomorrow 110.300
 June 17, 2025 at 12:06 pm #26380June 17, 2025 at 12:06 pm #26379
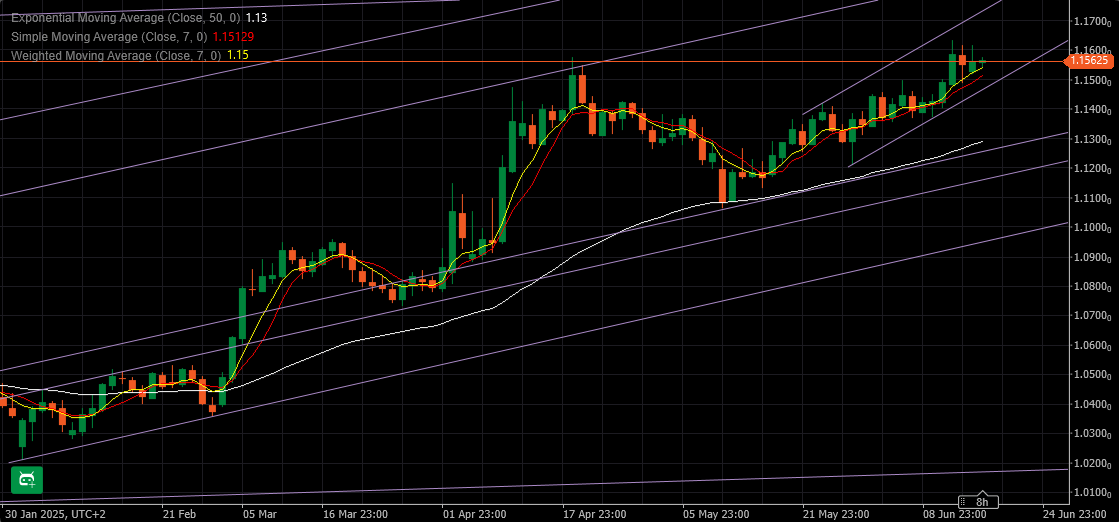
EURUSD Daily
Supports: 1.15400, 1.15200 & 1.14650
Resistances: 1.15950, 1.16300 & 1.17300
EUR is currently levitating in a very small range, trying to hold on the Uptrend it is in.
Danger to it is if below 1.14650 , but for now it is positioned to take out resistances and go for a new high.
Intraday wise – as long as 1.15600 holds, it will push up.
 June 17, 2025 at 10:59 am #26378June 17, 2025 at 10:33 am #26376June 17, 2025 at 10:24 am #26374June 17, 2025 at 10:20 am #26373
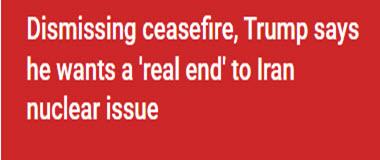
As I have been saying actions speak louder than words, especiqally those from news sources looking for a headline.
 June 17, 2025 at 10:07 am #26372June 17, 2025 at 9:56 am #26371
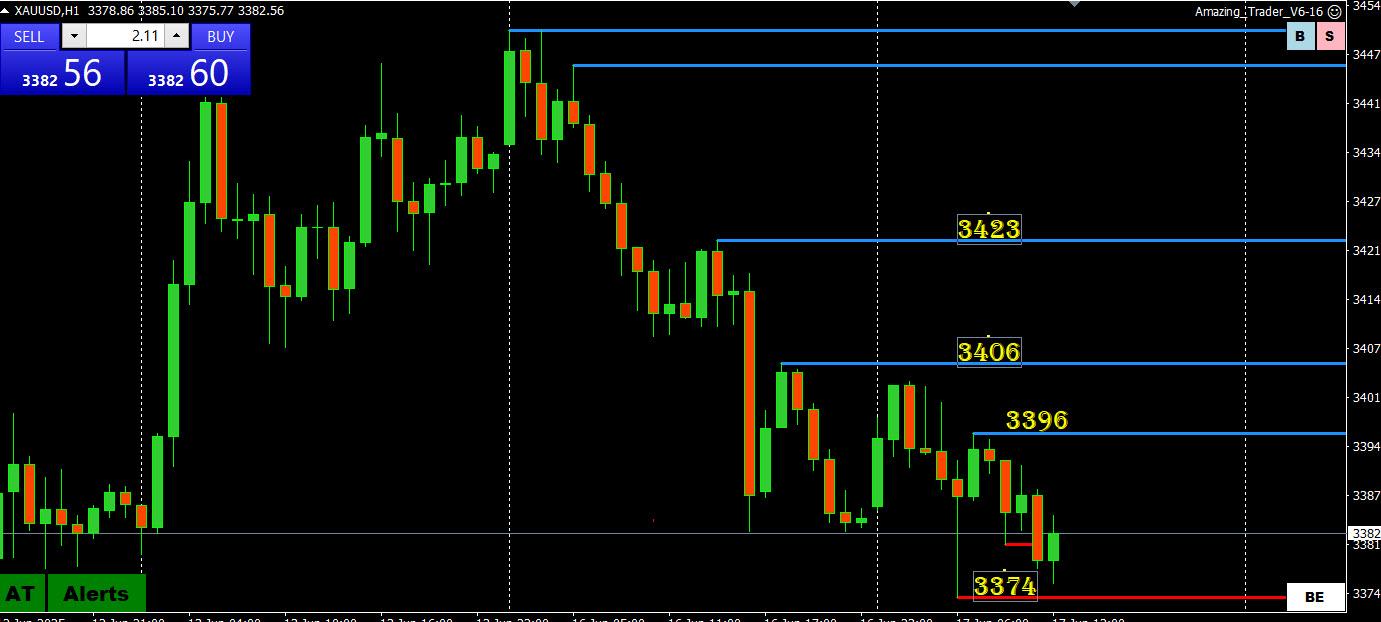
XAUUSD performing technically:
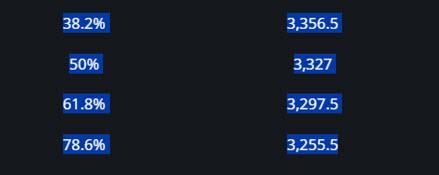
Failure to regain former 3407 support (high 3406) => followed by a r=un through stops below 3377 (low 3374) => then a bounce back above it that would need to regain 3406+ to negate the risk of a further squeeze on longs to 3338.
3374 now becomes a key support.
Note, on a daily chart it would need to trade through 3202 to fully negate the upside risk. This suggests the current retreat is still just a retracement.
XAUUSD (GOLD) 1 HOUR CHART
 June 17, 2025 at 9:47 am #26370June 17, 2025 at 9:39 am #26369June 17, 2025 at 9:36 am #26368June 17, 2025 at 9:31 am #26367
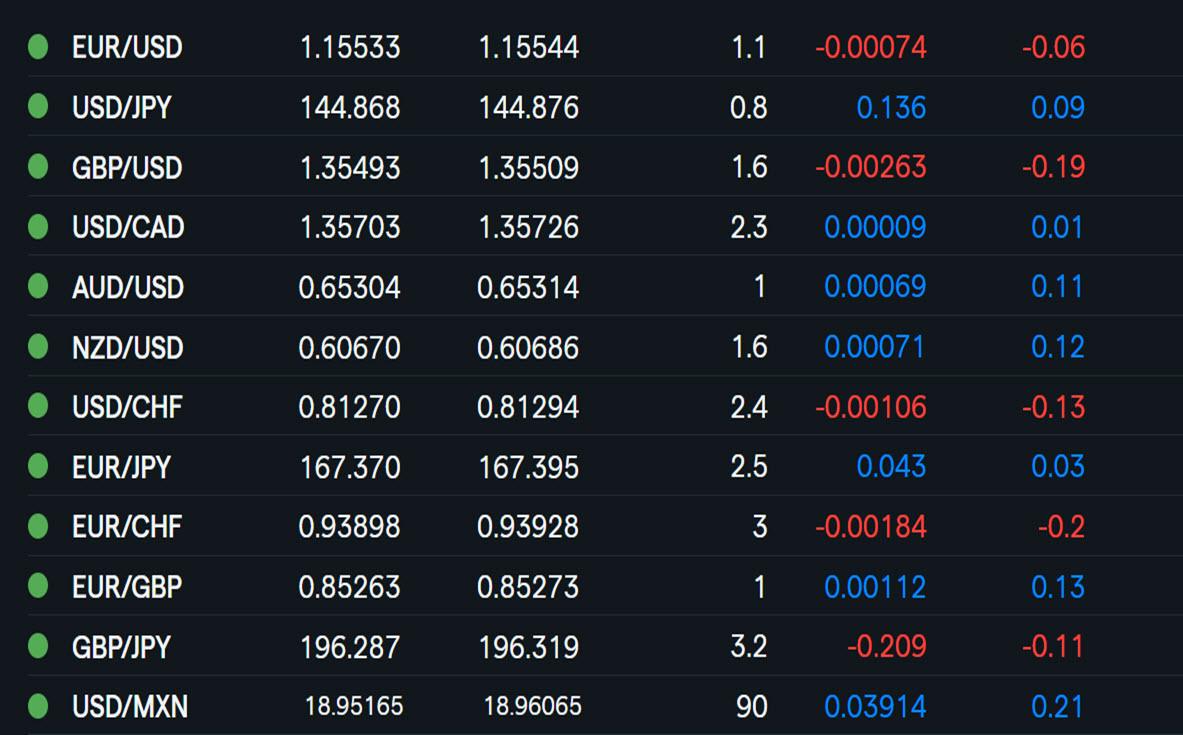
Treating my platform as a HEATMAP shows…
Markets unsure how to trade Israel-Iran war where a hope for a truce has faded and set a mild risk off mood.
This is reflected in the dollar whuch is trading not far from unchanged with only AUD and NZD upslightly
Stocks sre lower with US500 focused on 6000
Gold is weaker and clinging to support after failing to regain 3400.
Economic data: YS retail sales
 June 17, 2025 at 5:48 am #26366June 17, 2025 at 1:43 am #26365June 17, 2025 at 1:40 am #26364June 17, 2025 at 12:03 am #26363June 16, 2025 at 11:42 pm #26362
-
AuthorPosts








- You must be logged in to reply to this topic.
Search
© 2024 Global View