
-
AuthorSearch Results
-
August 21, 2025 at 12:11 pm #29378
In reply to: Forex Forum
ETHUSD – Ethereum
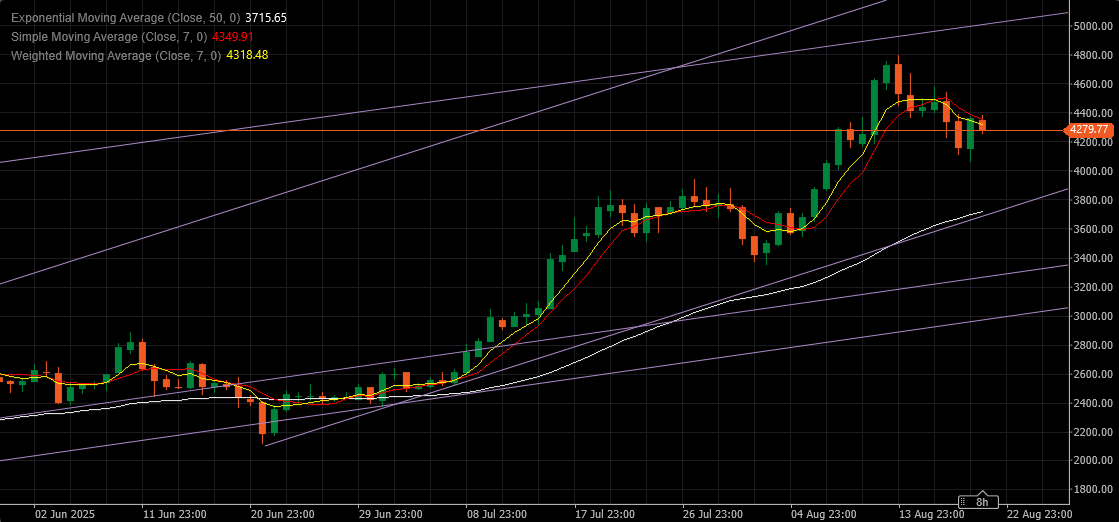
Ether looks healthier in contrast to BTC – there are no double tops above the head, and this Down wave after reaching a new high is kind of shallow.
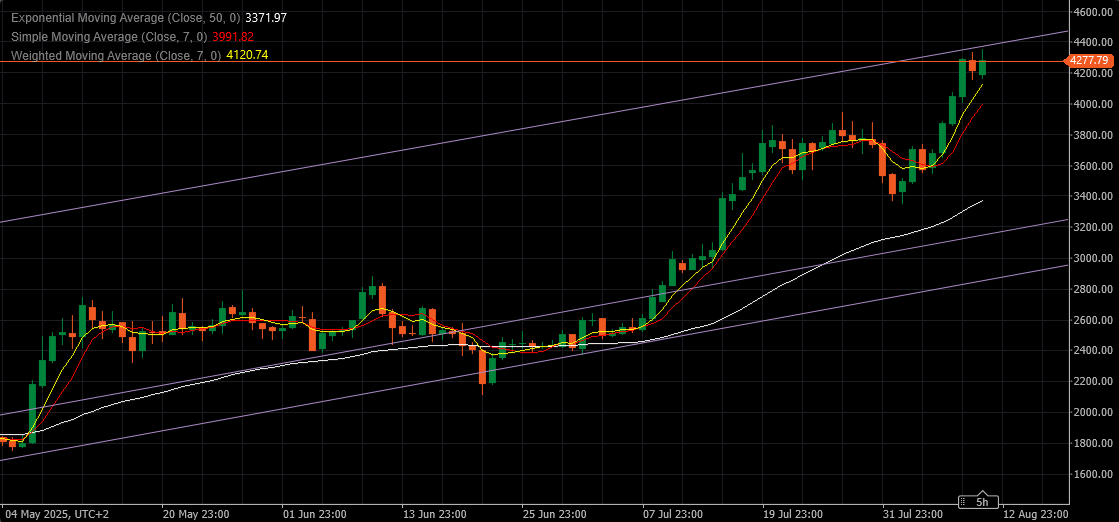
4380.00 is a breaking point on the upper side and if ETH manages above it today, situation will change dramatically.
Resistances: 4380.00, 4535.00 & 4580.00
Supports: 4255.00, 4155.00 & 4060.00
Intraday pressure: Down
 August 20, 2025 at 1:16 am #29295
In reply to: Forex Forum
Ethereum whale opens $16.3M long as ETH price eyes bounce
• ETH price has a short liquidation cluster “magnet” at $4,300–$4,360.
• Ether price technicals support the case for a rally toward $4,750–$8,000. An Ethereum whale has opened a massive $16.35 million long position on Ether ETHUSD, using 25x leverage, in what looks like a bold wager that the latest dip is over.
1% price ETH gain equals $163,000 in profit The position, entered at $4,229.83 per ETH, is already slightly in profit with ETH trading just above $4,240. At this scale, a mere 1% rise from the entry would add over $163,000 in profit.
Fresh liquidation heatmaps support the timing of the whale’s entry.
Data from Kingfisher shows a dense cluster of short liquidations above $4,300–$4,360, with a particularly large pocket near $4,336. Markets are often drawn toward such liquidity “magnets” as market makers hunt stops.
Strategically, this means ETH doesn’t need a full-blown breakout to validate the whale’s trade. A simple push into the $4,336 liquidity pool could generate multimillion-dollar paper gains.
The whale’s position could be up by nearly $450,000 in unrealized profit if ETH hits that level.
On the flip side, a 4.34% drop to around $4,046 would completely liquidate the trade, erasing the margin behind the position.
Did Ether find a local bottom?
Ethereum is also holding firm above its 20-day exponential moving average (20-day EMA; the green wave), a support that has guided the uptrend since July, barring a brief breakdown last month.
ETH could eye an upside target around $4,750, nearly 13% higher from current levels, if the wedge and 20-day EMA fractal play out. A close below $4,140, however, risks invalidating the setup.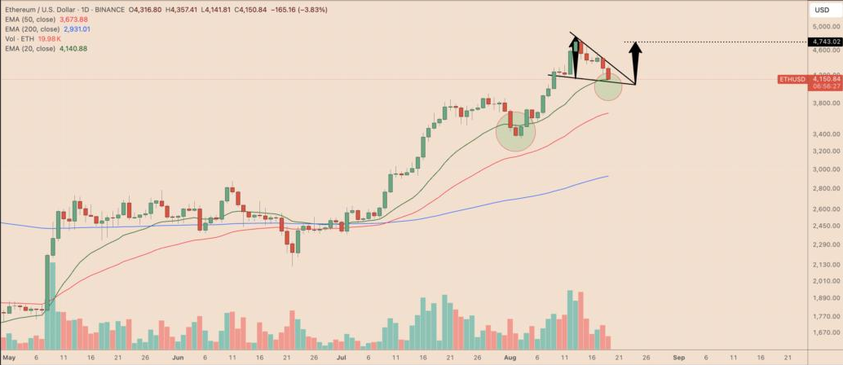 August 20, 2025 at 12:20 am #29293
In reply to: Forex Forum
Crypto Liquidations Top $506M as BTC Teases Below $113k
The crypto leveraged market, led by Ethereum ETHUSDT, recorded more than $506 million in net liquidations during the last 24 hours. According to market data analysis from CoinGlass, 143,027 traders were liquidated, with long traders involving more than $430 million compared to $77 million in short traders.
The wider crypto market followed major stock indexes in intraday correction. For instance, the S&P 500 dropped 0.6 percent on Tuesday while the NASDAQ index dropped 1.5 percent in the last 24 hours.
Top Reasons Why Crypto Dropped Today In the past two days, the overall demand for Bitcoin and Ethereum by institutional investors has significantly declined. For example, the U.S. spot Ether ETFs have recorded a net cash outflow of more than $250 million in the past two days led by BlackRock’s ETHA.
Additionally, the U.S. spot BTC ETFs, led by BlackRock’s IBIT, recorded a net cash outflow of more than $130 million in the last two days. On-chain data analysis also shows an accelerated selloff by whale investors.What are Midterm Expectations for Crypto Bull Market
The crypto market is awaiting tomorrow’s FOMC meeting minutes and U.S. unemployment claims to gauge Friday’s Fed Chair Jerome Powell speech. Furthermore, last week’s hotter than expected inflation data has faded the bets on Fed rate cut in September.
The midterm crypto outlook will heavily be influenced by Bitcoin and Ethereum’s price action. As for ETH, the lower edge of the CME gap around $4,098 remains a magnet, with technical analysis showing $4k as a major support level. Meanwhile, Bitcoin price must hold above the support level around $113k to invalidate a potential retrace towards $109k in the coming weeks. August 19, 2025 at 12:48 am #29227
In reply to: Forex Forum
Ethereum Lost 2.95% to $4337.97
Ethereum is down $132.01 today or 2.95% to $4337.97
• Largest percentage decrease since Aug. 14, 2025, when it dropped 3.92%
• Snaps a two day winning streak
• Up 16.13% month-to-date
• Up 29.7% year-to-date
• Down 10.85% from its all-time intraday high of $4865.81 on Nov. 10, 2021
• Up 65.83% from 52 weeks ago (Aug. 19, 2024), when it traded at $2615.95
• Down 9.44% from its 52-week intraday high of $4790.13 on Aug. 14, 2025
• Up 204.70% from its 52-week intraday low of $1387.85 on April 9, 2025
• Traded as low as $4228.80
• Down 5.40% at today’s intraday low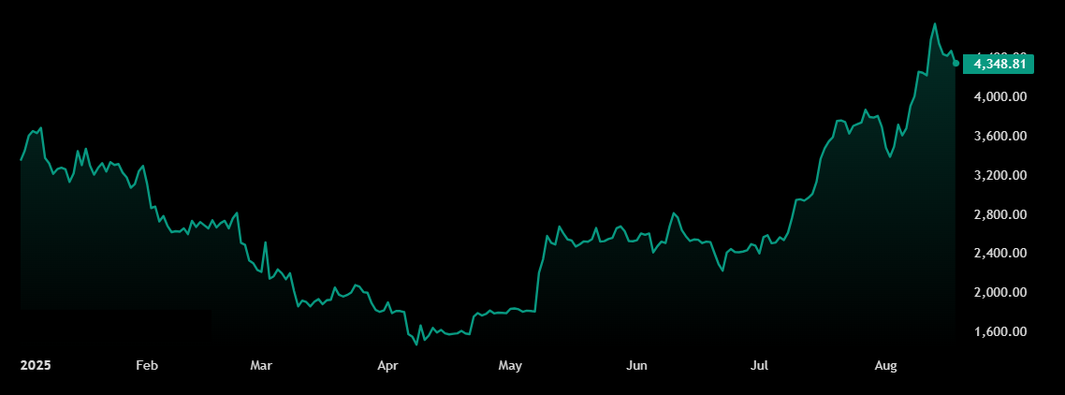 August 18, 2025 at 3:01 pm #29189
In reply to: Forex Forum
ETHUSD – Ethereum
Ether went yesterday above that 4510.00 level, but failed to close above it.
As I said last night : If below on close tonight ( 4510.00 )– Monday might bring a sharp move down
And what a down move that was….
Now unless some unseen force provides a great support and rebound ETH back up ( doubt that 😀 , Ether is destined to check on supports at:
3955.00 & 3685.00
Resistances: 4165.00 & 3940.00
Intraday pressure : Up
 August 17, 2025 at 6:34 pm #29145
In reply to: Forex Forum
ETHUSD – Ethereum
Levels to watch:
4510.00 – Important when it comes to Closing tonight – if above Ether would have a chance to push higher on Monday
If below on close tonight – Monday might bring a sharp move down
Resistances: 4580.00, 4670.00 & 4790.00
Supports: 4490.00, 4400.00 & 4365.00
In case Ether manages to hold above 4510.00 and take out 4580.00 it should target Channel Upper line at 4965.00
It is in the Bullish mode and as long as it stays above 3960.00 it should run for the new high within couple of days.
 August 16, 2025 at 3:37 pm #29124
In reply to: Forex Forum
Ethereum Price Prediction 2025, 2026 – 2030: Can ETH Reach $10k?
· The Ethereum price today is $ 4,414.62163157.
· ETH price with a potential surge could hit $6,925 in 2025.
· The price of Ethereum could reach a high of $15,575 by 2030.
Amidst the turn of events, most cryptocurrencies are riding the sideways wave. And Ethereum too is not left behind, the largest altcoin saw the drive coming from SharpLink Gaming’s $200M ETH purchase. On the other hand, spot ETH ETFs hit $1B+ inflows.
The Ethereum price today is $4,405.55, with an intraday price change of -4.85%. This has come after rising to a peak of $4,663.55. Curious about where the ETH price is heading in the long run? Read our latest Ethereum price prediction for potential price targets.
What will be the ETH Price tomorrow?
Based on the current price trend, the ETH price tomorrow could range between $4,300 and $4,700.
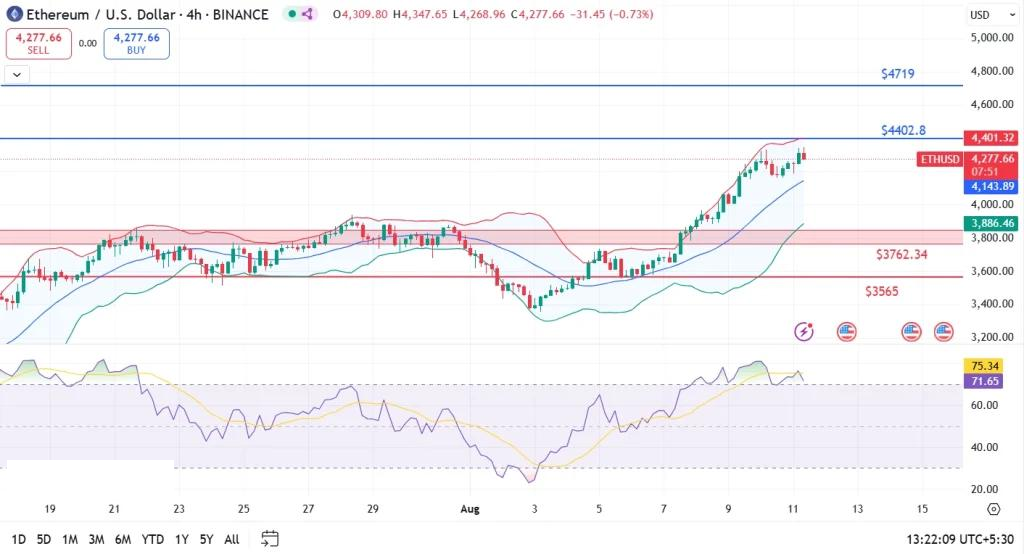
Ethereum, with a drop of 4.85%, is changing hands at $4,405.55. This has come amid a short-term exhaustion because the price extended well above the upper Bollinger Band. If the momentum resumes, ETH may test the $4,719 mark. Caution is advised, as profit-taking could trigger a brief pullback to $3,565.
ETH Price Prediction 2026
By 2026, the value of Ethereum is expected to reach a high of $6,610. On the other hand, the Ethereum price might drop to $5,566, with an average of $5,713.
Ethereum Price Forecast 2027
The Ethereum 2027 forecast expects the ETH coin price to make a new all-time high at $8,705. However, a correction based on market shortcomings may drive the ETH crypto to $6,800, with an average of $7,246.
ETH Price Prediction 2028
In 2028, the chances of Ethereum dominating the crypto market rise as the ETH price potentially makes a new high at $10,410. On the other hand, the altcoin might fall to $8,613, making an average of $9,482.
Ethereum Forecast 2029
Approaching its all-time high of $12,994 in 2029, the Ethereum price is expected to surpass the psychological barrier of $12,000. In case of a correction, ETHUSDT may reach a low of $10,192, with an average price of $11,111.
Ethereum Price Prediction 2030
As per our Ethereum Price Prediction 2030, the ETH crypto price is projected to reach a new all-time high of $15,575 in 2030, with a potential low of $12,647 and an average price of $14,163.
 August 13, 2025 at 1:33 pm #28927
In reply to: Forex Forum
August 12, 2025 at 3:43 pm #28861In reply to: Forex Forum
August 11, 2025 at 10:35 pm #28815In reply to: Forex Forum
Here’s what happened in crypto today
Bitcoin’s corporate boom raises “Fort Knox” nationalization concerns Corporate crypto treasuries have surged past $100 billion, raising concerns among analysts that the United States may one day nationalize some of these holdings in a move reminiscent of the gold standard era.
Corporate crypto treasuries have surpassed $100 billion of digital asset holdings, with Bitcoin (BTC) treasury firms amassing 791,662 BTC worth roughly $95 billion by the end of July, representing around 3.98% of the circulating supply.
The growing corporate holdings may present a new centralized point of vulnerability for Bitcoin, which may see the world’s first cryptocurrency follow the same “nationalization path” as gold in 1971, according to crypto analyst Willy Woo.
“If the US dollar is structurally getting weak and China is coming in, it’s a fair point that the US might do an offer to all the treasury companies and centralize where it could be then put into a digital form, not create a new gold standard,” Woo said during a panel discussion at Baltic Honeybadger 2025, adding:
“You could then rug it like happened in 1971. And it’s all centralized around the digital Bitcoin. The whole history repeats again back to the beginning.”
In 1971, US President Richard Nixon ended the Bretton Woods system, suspending the dollar’s convertibility into gold and abandoning the fixed $35-per-ounce rate, effectively ending the gold standard.
Ethereum bag holders will rotate back to Bitcoin: Samson Mow Bitcoin pioneer Samson Mow predicts Ethereum investors will switch back to Bitcoin once ETH prices get high enough, potentially reversing a five-week surge in Ether.
However, historical market cycle patterns could indicate otherwise. “Most ETH holders have a lot of BTC (ICO/insiders) and they are rotating that BTC into ETH to pump it on new narratives (Ethereum Treasury co’s),” said the CEO of Bitcoin adoption firm JAN3 on Sunday.
“No one wants ETH in the long run,” the Bitcoin (BTC) maximalist said. Mow, who has repeatedly ridiculed altcoins, added that it will be “challenging” for ETH to break all-time highs “because the closer you reach that psychological level, the stronger the drive to sell,” describing it as a “Bagholder’s Dilemma.”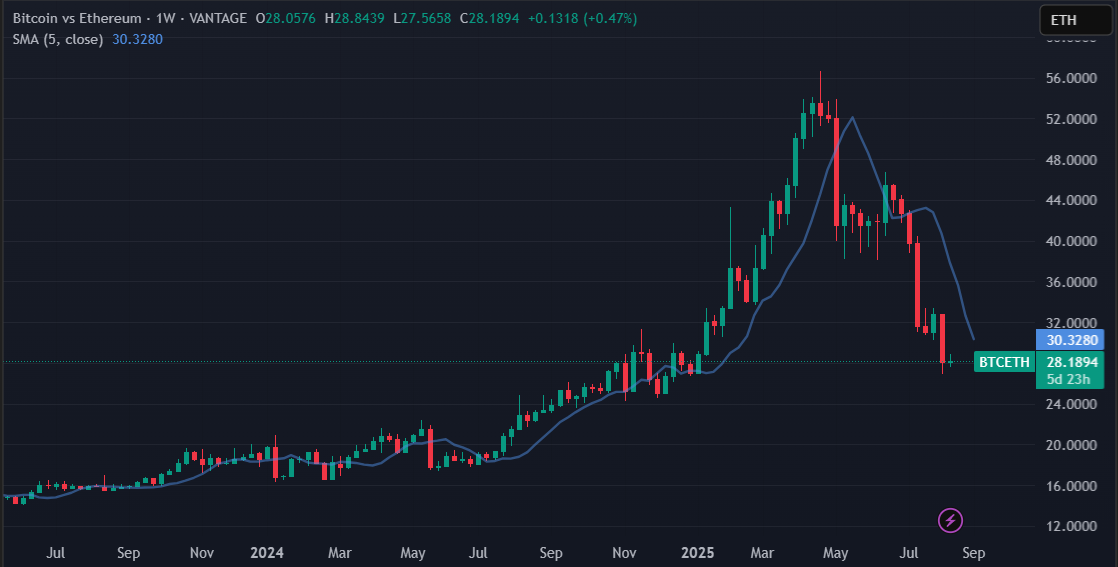 August 11, 2025 at 3:22 pm #28800
In reply to: Forex Forum
August 7, 2025 at 12:35 pm #28586In reply to: Forex Forum
ETHUSD – Ethereum
Ether is moving – again…
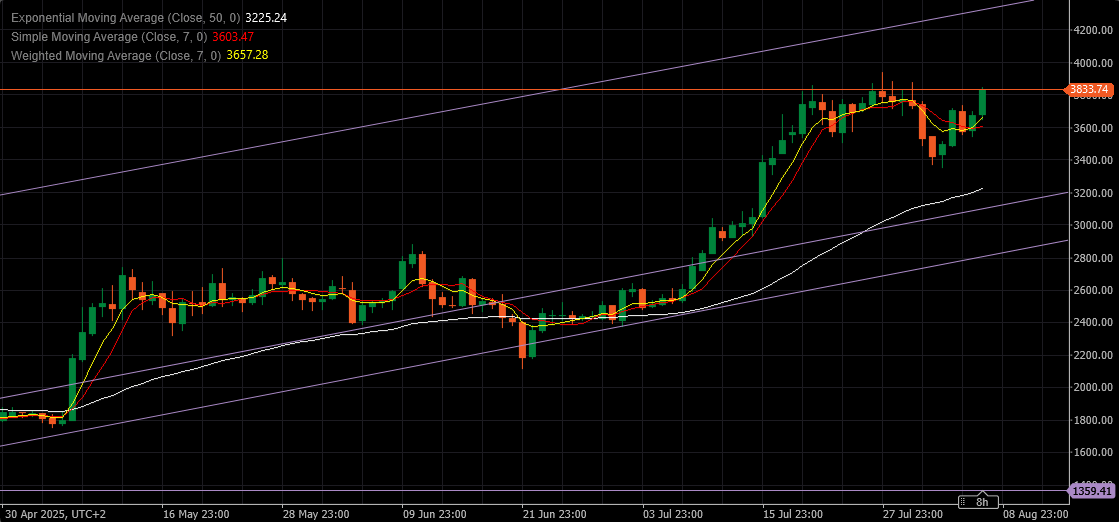
Ether successfully mastered 3735.00 resistance and is now just below another important one at 3885.00
It is in a very Bullish pattern and it should be testing 4 K soon.
4110.00 is the last barrier in front of possible taking of previous all time high at 4865.00
To do it so, first target comes at 4325.00 in this wave.
 July 30, 2025 at 1:32 pm #28162
In reply to: Forex Forum
BTC Capital Rotation or Fresh Fund Inflows: What’s Really Fueling ETH’s Rally?
The consensus in the crypto market is that the ongoing ether (ETH) rally, which has extended to other altcoins, is driven by capital rotation from bitcoin (BTC). However, on-chain data obtained by CryptoQuant has proven that the information is false.
According to a report by CQ’s analyst Carmelo Aleman, fresh inflow from investors is driving the ETH rally, not capital rotation from bitcoin. Market participants are not selling BTC to buy ETH – the Bitcoin Realized Capitalization serves as evidence for this claim.What is Driving Ether’s Rally?
This month, ETH has climbed over 60% from $2,400 to $3,850. On the other hand, BTC has increased by 14% from $107,000 to hit an all-time high (ATH) above $123,000. Although BTC declined briefly to the $115,000 zone, it has consolidated mostly between $117,000 and $120,000.
As of July 25, bitcoin reached a new ATH in Realized Cap at $1.018 trillion. This metric represents the market cap of bitcoin by telling the price at which each BTC was last moved on-chain. Hence, it reflects the total acquisition cost of all BTC in circulation, factoring in accumulation trends and large-scale selling.
The increase in Realized Cap indicates that the capital invested in bitcoin is rising, not declining. So, instead ofdumpingBTC for ETH and other altcoins, investors are allocating fresh capital to their other crypto holdings.No Major Capital Rotation
Addressing bitcoin’s consolidation concerns, Aleman explained that such price pauses can be attributed to capital accumulation phases that come before exponential rallies. The market has witnessed such dynamics in past bull cycles; this time will be no different.
“So, what’s happening with ETH? The answer is simple: following the Genesis Law, along with the strong growth prospects of the Ethereum ecosystem, there has been a surge in capital invested in ETH this July, but without reducing positions in BTC,” the analyst added.
In conclusion, there is no major capital rotation from BTC to ETH. Investors are just injecting new capital through exchange-traded funds (ETFs) and other investment products. Institutional demand for ETH is currently at peak levels, with spot Ethereum ETF purchasesaccountingfor more than the daily production of ether.
Ethereum investment products just recorded their second-largest weekly inflow at $1.59 billion. Inflows into the products this year have exceeded the total recorded in all of 2023.
Market Cap Chart
 July 29, 2025 at 1:40 pm #28100
In reply to: Forex Forum
ETHUSD – Ethereum
Supports: 3820.00, 3725.00 & 3625.00
Resistances: 3885.00, 3940.00 & 3975.00
4K is now very much in the reach for Ether, and Pattern wise it is just a question of time test it.
However, way more important levels to watch are 4090.00 & 4105.00 – that is where the real battle will unfold.
 July 29, 2025 at 5:38 am #28081
In reply to: Forex Forum
Ethereum Soars on $1.9B Inflows and ETF Optimism as BlackRock and SharpLink Double Down
Ethereum (ETH) is once again at the center of investor attention, pulling in a staggering $1.59 billion in inflows over the past week.
This marks the second-largest weekly inflow in Ethereum’s history, amid growing optimism that U.S. regulators will soon approve a spot Ethereum ETF. Overall, digital asset investment products attracted $1.9 billion, marking 15 consecutive weeks of positive flows.This surge in capital has pushed Ethereum’s price up 62% this month to $3,900, positioning it just below the critical $4,000 breakout level. Meanwhile, Bitcoin ETPs faced $175 million in outflows, signaling a capital rotation from BTC to ETH and other altcoins.
Analysts point to the passage of the Genius and Clarity Acts in the U.S. as key drivers of this trend, enhancing regulatory clarity for altcoin investment vehicles.BlackRock and SharpLink Boost Ethereum Exposure
Institutional investors are doubling down. BlackRock’s iShares Ethereum ETF (ETHA) surged past $10 billion in AUM, becoming the third-fastest-growing ETF globally, while the firm raised its ETH holdings to $10.47 billion, with 100% of its crypto exposure now allocated to Ethereum.
Simultaneously, Nasdaq-listed SharpLink Gaming purchased 77,210 ETH worth approximately $295 million, raising its total ETH treasury to over 438,000 ETH. This single purchase surpassed the network’s entire 30-day ETH issuance, underscoring the aggressive accumulation trend among institutions.
Technical Indicators and Risks Remain Ethereum’s rally is further supported by bullish technical signals. A “golden cross” pattern emerged, and the MACD shows strong upward momentum, despite an overbought RSI reading of 82.07, a level often associated with potential price pullbacks.
Solana and XRP also saw inflows of $311 million and $189 million, respectively, while Litecoin and Bitcoin Cash experienced minor outflows. Meanwhile, Ethereum’s on-chain activity surged 288%, reinforcing confidence in the network’s role as the leading smart contract and DeFi platform. As regulatory momentum builds and ETF approval appears within reach, Ethereum’s dominance in institutional portfolios signals a pivotal moment for altcoin adoption—though short-term volatility remains a factor to watch. July 28, 2025 at 1:58 pm #28048
In reply to: Forex Forum
ETHUSD – Ethereum
Ether continued reaching new high – currently 3940.00
Resistances that are awaiting it are: 3975.00 & 4105.00
Those two are a barrier separating Ethereum from All Time High at 4865.00
Right now supports are at: 3790.00, 3685.00 & 3585.00
Month’s end is quickly approaching and Pattern wise we should see another month of Rally Up, unless 4105.00 proves to be a hard nut to crack .
 July 24, 2025 at 1:49 pm #27937
In reply to: Forex Forum
ETHUSD – Ethereum 4h
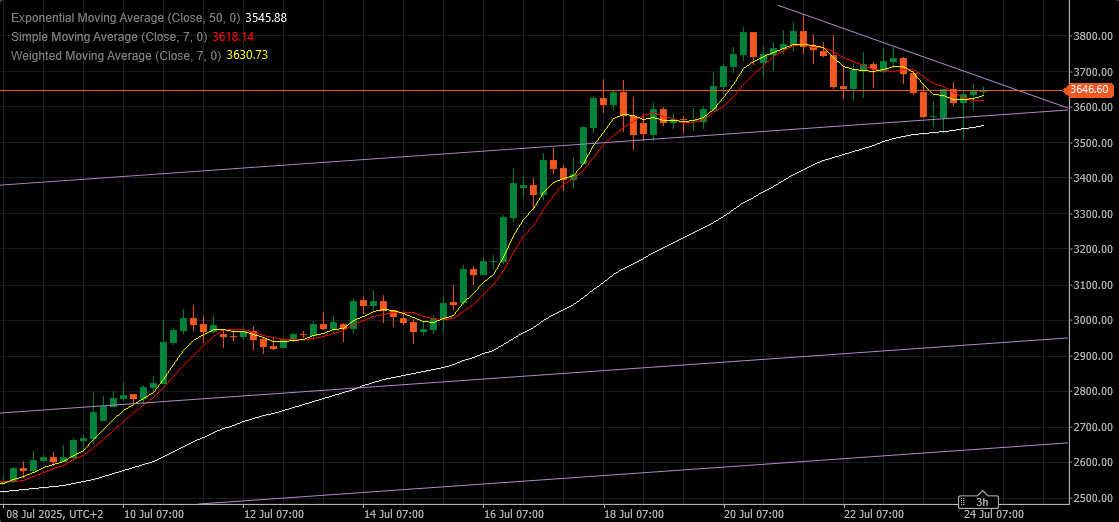
It is pretty clear what Ether is supposed to do to continue Rally – to take over that Resistance line at 3680.00
Supports: 3630.00, 3595.00 & 3555.00
Looking at the big picture – Daily – it is going to be very difficult – probability is to the down side for now.
So we’ll see how it develops in couple of hours
 July 23, 2025 at 8:32 pm #27901
In reply to: Forex Forum
ETHUSD – Ethereum
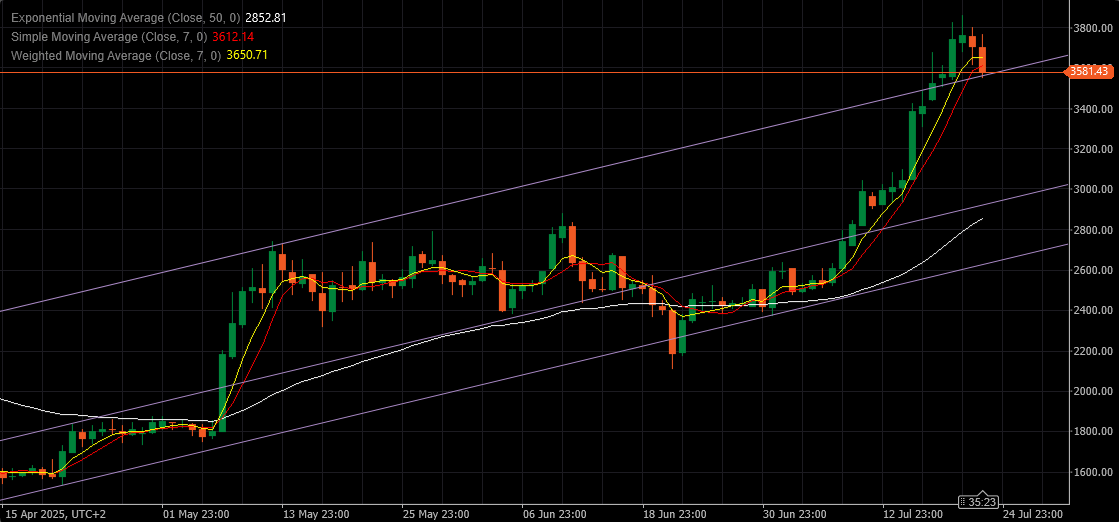
Ether is now testing channel support line at 3550.00
It doesn’t look good right now, and lots is depending on tonight’s close – above or below it…
If below, road would be open for 3295.00 support and even 2945.00
On the big picture, failure to overcome 4.100.00 might send it all the way back to everything between 1.000.00 and 1.500.00
So, as long as Ether manages to close this month above 2945.00 it would have a chance to deal with 4.100 next month….
On the brighter note, close of this week above 3.200.00 would still keep it in the Bullish mode.
 July 23, 2025 at 11:09 am #27883
In reply to: Forex Forum
Ethereum Adoption Accelerates As Daily Transactions Set 2025 Record
Ethereum is currently consolidating between $3,600 and $3,850 after an explosive rally that saw the second-largest cryptocurrency surge more than 80% since late June. Despite the brief pause in upward momentum, ETH remains in a strong technical position, holding above key support and showing signs of sustained bullish control. This period of sideways action could be a healthy reset, allowing the market to absorb recent gains before initiating the next leg up.
What’s fueling the optimism is not just price action, but a supportive macro and regulatory environment. Ethereum fundamentals continue to strengthen, with rising on-chain activity, institutional interest, and long-term holders accumulating. Adding to the bullish case is the growing legal clarity in the US, which is creating a more stable environment for crypto innovation and investment. As regulatory fog lifts, many investors now believe that Ethereum could lead the charge into what some analysts are calling the beginning of an altseason.
Ethereum Transactions Surge As Adoption And Momentum Accelerate
Ethereum is showing strong signs of renewed momentum as key network activity hits levels not seen in years. According to data from The Block, Ethereum daily transactions just reached a multi-year high of 1,510,000—the highest since 2021. This surge points to rising adoption across the network, with increased activity from both retail and institutional participants. Analysts suggest that this spike in transaction volume is more than a temporary trend; it may signal the beginning of a much larger phase in Ethereum’s growth cycle.
The renewed activity aligns with broader market movements and increasing confidence in Ethereum’s long-term value. Institutional players are beginning to accumulate ETH, while smart money continues to position for upside. These inflows come at a time when Ethereum is consolidating just below major resistance levels, offering what many see as a key entry zone ahead of further price appreciation.
Notably, Ethereum is now outperforming Bitcoin and much of the broader crypto market. This relative strength is significant, as ETH often leads the altcoin market during bullish phases. As the cycle progresses, Ethereum’s combination of strong fundamentals, rising utility, and institutional adoption is making a compelling case for continued growth.
Ethereum Holds Above Support After Rally, Eyes Next Breakout
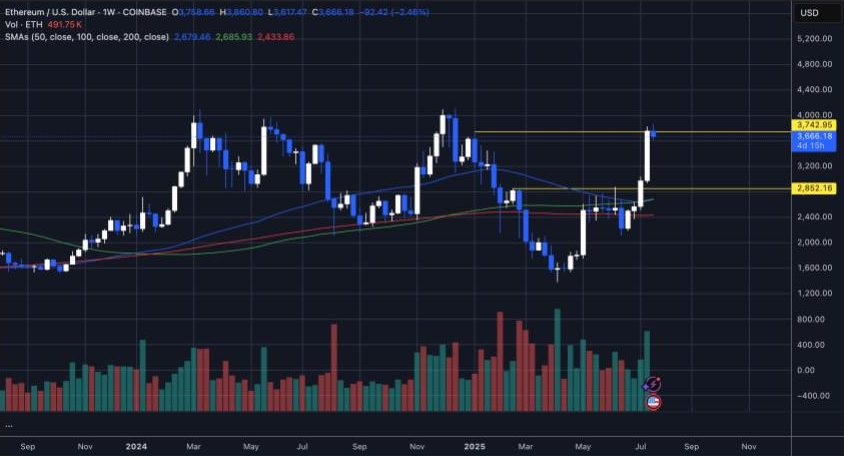
Ethereum (ETH) continues to trade within a key range following a strong rally that pushed the price from below $2,500 to over $3,750 in just a few weeks. As of today, ETH is consolidating around $3,660 after being rejected near $3,742—a major resistance level seen since early 2024. The current weekly candle shows a long upper wick, indicating profit-taking at the top of the range, but price remains supported above the critical $2,852 level, now acting as a flipped support.
The rising volume seen during the recent breakout suggests strong participation from buyers, and price action remains bullish as long as ETH holds above its key moving averages. The 50, 100, and 200-week SMAs are all aligned below current price levels, providing structural support and reinforcing the bullish trend.
Traders are now closely watching for a decisive breakout above the $3,742 zone. If ETH clears that resistance, the next logical targets lie in the $4,000–$4,200 range. On the downside, a breakdown below $2,850 would invalidate the recent breakout structure.
 July 20, 2025 at 7:41 pm #27771
In reply to: Forex Forum
July 20, 2025 at 1:47 pm #27767In reply to: Forex Forum
Ethereum Set To Hit $10,000, Elliott Wave Analysis Predicts
Over the past week, the Ethereum (ETH) market recorded a solid positive price performance, reaching as high as $3,600. Notably, the second-largest cryptocurrency, among many altcoins, is experiencing a strong bullish momentum as evidenced by price gains of 45.48% over the last month. Amid the present market euphoria, Dutch market analyst Gert Van Lagen has backed Ethereum’s chances for sustained price gain based on an Elliott wave analysis.
Ethereum To Complete Bull Market Cycle On High Note – Analyst
The Elliot wave theory is a technical framework used to predict price targets by identifying repetitive patterns in price movements driven by investor psychology. In an X post on July 18, Van Lagen explains that this price forecast framework indicates that Ethereum may be entering the final phase of its bull market cycle, with a potential price target of $10,000.
According to the analyst, the ETH bi-weekly trading chart suggests the cryptocurrency is completing a textbook five-wave cycle that began in 2022, with the fifth and final wave now unfolding in the form of an expanding diagonal.
For context, the Elliot wave theory identifies a single price cycle in five waves, each composed of subwaves abc. As seen in the chart above, this includes the wave I marked by an initial impulse rally, followed by a sharp corrective Wave II as seen between 2022 and 2023. Wave III is defined by explosive momentum, pushing Ethereum to new highs, before entering a lengthy Wave IV consolidation characterized by a flat correction.
Finally, there is wave V, i.e., the current status of the market, which is usually a final price surge. After breaking out of the upper boundary of the Wave 3–4, Gert Lagen explains that Ethereum is about completing subwave a of wave V following its most recent price gains.
Therefore, investors should expect a brief pullback to retest the breakout zone, which would complete subwave ‘b’. After that, a blow-off rally forming subwave ‘c’ is on the cards, i.e., a price move that could push Ethereum to the $10,000 mark based on a broader Elliott wave analysis on the Ethereum bull market stretching from 2019 to date.
Ethereum Price Overview
At press time, Ethereum is trading at $3,657, posting gains of 1.79% over the past 24 hours and 21.8% over the last seven days. However, daily trading volume has dropped by 46.03%, signaling a potential weakening in the bullish momentum behind the current price surge. Following its most recent gain, the altcoin continues to retain its position as the second-largest cryptocurrency with a market cap of $441.14 billion and 11.1% market share.
 July 19, 2025 at 11:27 am #27743
In reply to: Forex Forum
Crypto Markets Shed $100 Billion as Bitcoin Was Rejected at $120K: Weekend Watch
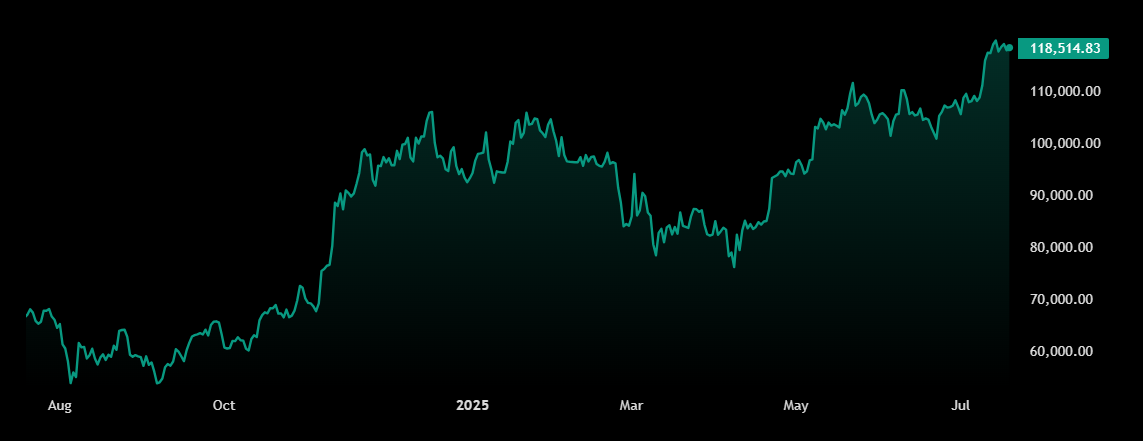
Bitcoin’s price ascent to $120,000 came to a halt yesterday as the asset was rejected once again at that resistance and pushed south by a couple of grand.
The altcoins, which were flying high yesterday, have seen even bigger price declines over the past 24 hours, with SUI leading the adverse trend.BTC Stopped at $120K
Bitcoin had a spectacular start to the business week as its ascent that began last week culminated on Monday with a price surge tojust over $123,000. Thus, the cryptocurrency set a new all-time high after adding over $15,000 in the span of about five days.
This ‘up only’ mode finally came to an end, and the asset went on an expected correction. It lost over seven grand in the following day or so, driven mainly byprofit-takingand some uncertainty in the US after the worrying CPI data for June.
Nevertheless, the bulls didn’t allow a further breakdown, and BTC started to recover the lost ground. By the end of the week, it challenged $120,000 and even went for $121,000 on a few occasions, but to no avail. The subsequent rejections pushed it south hard, and BTC slipped to $117,000 yesterday.
It has recovered some ground and now trades around $118,000, but it’s still in the red on a daily scale. Its market cap has declined to $2.350 trillion, while its dominance over the alts is below 60%.Alts Retrace
Many altcoins posted impressive gains on Friday, but the situation has flipped since then. XRP, which skyrocketed to a new all-time high of over $3.6, has lost almost all gains and is down to just over the previous peak of $3.4. Ethereum was stopped at $3,700 and is now below $3,600.
SUI has dumped the most from the larger-cap alts, followed by HYPE, XLM, ADA, SOL, and LINK. Dogecoin and ETC are the two exceptions from this cohort of altcoins.
The total crypto market cap, which soared past $4 trillion yesterday, is down by $100 billion since the peak to $3.940 trillion now.
 July 19, 2025 at 11:23 am #27742
In reply to: Forex Forum
Ether preps record short squeeze as analysis sees $4K ETH price ‘soon’
Key points:
· Ether is currently forging a short squeeze that stands out in crypto history, says analysis.
· A 10% price increase would see another $1 billion in liquidated shorts.
· Shorts should now fuel a $4,000 ETH price rebound.
Ether ETHUSD is “making history” as ETH price gains spark a short squeeze for the record books.
Fresh analysis from trading resource The Kobeissi Letter issued Friday now sees ETHUSD hitting $4,000 “soon.”
Ether shorts risk punishment as ETH eyes 2025 highs
Ether price strength has become one of July’s crypto market standouts as altcoins slowly begin following Bitcoin BTCUSD higher.
As the largest altcoin by market cap, Ether is punishing short positions at a rate rarely seen before, Kobeissi reports.
“Ethereum is making HISTORY: We are currently witnessing one of the LARGEST short squeezes in crypto history,” it summarized in a dedicated thread on X.
“Ethereum has added +$150 BILLION in market cap since July 1st, days after net SHORT exposure hit record highs.”
Data from Cointelegraph Markets Pro and TradingView confirms that ETHUSD gained 20% over the past week alone.
Local highs of $3,610 on Bitstamp almost match the year-to-date record seen in early January. Compared to its 2025 low, the pair is up over 150%.
If Ethereum rises another 10%, another $1 billion of shorts will be liquidated
Furthermore, the fact that many of these shorts are leveraged is adding even more pressure. Ethereum could see $4,000 soon.
Bitcoin dominance drops to March lows
Bitcoin meanwhile continues to consolidate below the psychologically significant $120,000 mark.
At the same time, capital has been reported as flowing into altcoins as traders eye the potential for quicker returns.
Bitcoin’s dominance of the overall crypto market cap has halted a multi-year uptrend, falling to 61.4% this week — its lowest value since March.
 July 17, 2025 at 1:44 pm #27671
In reply to: Forex Forum
Why Meme Coins Are Surging Today: FLOKI, BONK, and Pudgy Penguins in Focus
In just the last 24 hours, meme coins have surged by 7.2%, led by standout performances from FLOKI, Bonk, and the unexpectedly booming Fartcoin. FLOKI alone has shot up by a massive 32.8%, while Bonk jumped 16.2%, and Fartcoin rallied 23.5%.
Other notable gains include Dogecoin up 7.4%, Shiba Inu by 5.5%, and Pepe by 6%. This rally comes as the crypto market rides a wave of bullish sentiment, fueled by signs of an incoming altseason and renewed momentum behind the pro-crypto GENIUS Act in the U.S.
The current total market cap of meme coins stands at an impressive $79.87 billion, with a 24-hour trading volume of over $33 billion, according to CoinGecko. Apart from Pudgy Penguins and Pump.fun, all other top meme coins have seen notable green candles.
FLOKI, Bonk, and Fartcoin Dominate the Charts
FLOKI has taken center stage. With a 24-hour trading volume explosion of over 402%, the coin has managed a 42% rise over the past seven days, and its market cap now sits at $1.28 billion. This kind of sustained momentum, combined with community hype, is creating serious FOMO across social platforms.
Bonk, the Solana-based meme coin, is riding high too. It’s gained nearly 69% over the week, with 16.2% of that coming just in the last day. With its market cap nearing $3 billion and trading volume surpassing it, Bonk’s surge is closely tied to Solana’s increasing DeFi activity and broader bullish pressure.
Then comes Fartcoin—a name few took seriously until now. Posting an eye-popping 23.5% daily gain, it’s suddenly all over crypto Reddit and Telegram trading chats. While the fundamentals may be light, the market doesn’t care. The meme economy is running on vibes and volatility.
Bullish Macro Sentiment and the Altcoin Revival
The crypto market as a whole is heating up fast. Bitcoin recently touched $123K, gaining 6.8% over the past week. Ethereum surged by nearly 25%, while XRP exploded by 32.9%. Cardano, Solana, and Dogecoin also saw significant gains, with Cardano leading that pack with a 29.5% rise.
Is this the start of altcoin season?
It certainly looks like it. Bitcoin dominance is slipping, and altcoins—including meme coins—are outperforming. The Fear and Greed Index is deep in “Greed” territory, and institutional interest is shifting toward alternatives like Ethereum and Solana.
Floki Chart
 July 17, 2025 at 1:25 pm #27666
In reply to: Forex Forum
ETHUSD – Ethereum
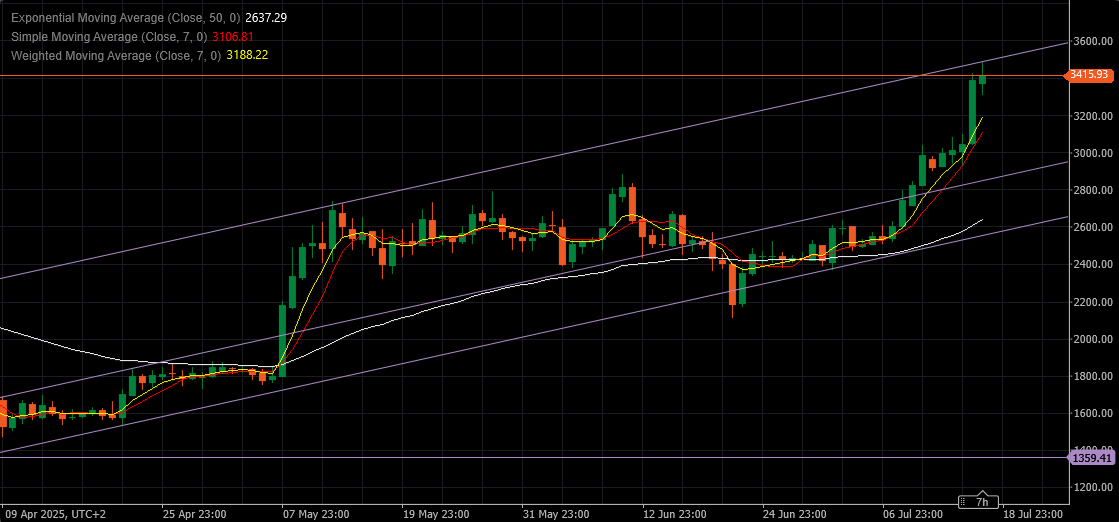
Ether’s target at 3465.00 was reached today – high so far 3481.62
Now if Ethereum continues Up straight forward and breaks above 3500.00 , we would be looking at a crazy rally that can reach as high as 4000.00 and above
But we have to take into account reality and a probable possibility that we should be seeing at least a consolidation, if not a full blown correction
Supports down there are : 3210.00, 3085.00 & 2875.00
Resistances: 3525.00, 3750.00 & 4100.00
 July 16, 2025 at 2:16 pm #27614
In reply to: Forex Forum
July 15, 2025 at 4:54 pm #27572In reply to: Forex Forum
July 14, 2025 at 6:29 pm #27506In reply to: Forex Forum
July 12, 2025 at 9:07 am #27421In reply to: Forex Forum
XLM Explodes by 22% Followed by XRP, BTC Price Calms at $118K
Bitcoin’s spectacular end to the business week, in which the asset gained over ten grand and skyrocketed to a new all-time high, has finally reached an exhaustion point as the asset has calmed at $118,000.
Several altcoins have followed suit, while XRP, CRO, and especially XLM have charted mind-blowing gains.
BTC’s Rally
It’s been a while since we have said this, but a lot can change in the cryptocurrency markets in the span of a few days. Recall that Bitcoin’s price stood within a tight range between $105,000 and $110,000 for a few weeks, and each breakout attempt in both directions was stopped in its tracks.
However, that all came to an end on Wednesday evening when the asset finally broke out of the upper boundary and shot up to a new all-time high of $112,000. After a brief retracement, the cryptocurrency began an even more impressive rally that resulted in tapping$116,000on Thursday evening, but BTC went all the way up to almost$119,000on Friday morning.
Although it has lost some traction since then and now trades just under $118,000, Bitcoin has gained over 9% on a weekly scale. Its market capitalization has grown to $2.345 trillion on CG, while its dominance over the alts has declined slightly to 62.5%.
XLM Steals the Show
Most altcoins posted mind-blowing gains over the past few days as well, but have calmed since yesterday. Ethereum, for instance, went from $2,500 to over $3,000 to market a five-month peak before it corrected slightly to just under the latter.
In contrast, XRP was a little sluggish at first but took the spotlight yesterday by surging to almost $3. Although it has dropped below $2.8 now, it’s still 7% up on the day, and it overtook USDT in terms of market cap.
CRO has charted a similar price surge over the past day, taking it to well over $0.1. However, the day belongs to XLM, which has exploded by more than 22% and now trades above $0.37.
Pi Network’s native token, on the other hand, has plunged by over 6% and struggles to remain above $0.47.
The cumulative market cap of all crypto assets gained over $300 billion since Wednesday and stands at $3.750 trillion on CG now.
XLMUSD Chart
 July 11, 2025 at 3:07 pm #27408
In reply to: Forex Forum
Bitcoin Surges to Record High Above $118,000. Where the Crypto Goes Next
Bitcoin rallied to a record above $118,000 overnight, the latest high in a stellar week for the cryptocurrency.
The world’s largest token by total market capitalization was trading at $118,111 early Friday, up 6.3% over the past 24 hours, according to data from CoinDesk. It rose as high as $118,740 earlier in the session.
Bets on a September Federal Reserve interest-rate cut, inflows into spot crypto exchange-traded funds, and regulatory tailwinds have all helped to spur this week’s rally, powering Bitcoin to its first record highs since May.
It’s only a matter of time before the token tops $120,000, particularly given that U.S. lawmakers are due to consider several digital-asset proposals next week, Pepperstone strategist Dilin Wu said Friday in a research note.
The House is set to review three pieces of legislation: The CLARITY Act, which aims to establish a regulatory framework for cryptos; the Genius stablecoin bill, which sets out to regulate tokens that are pegged to the dollar and other fiat currencies; and the Anti-CBDC Surveillance State Act, which bans Federal Reserve banks from issuing central bank digital currencies to individuals.
“If legislative momentum remains strong, ETF inflows persist, and the Fed signals dovish intent, Bitcoin retesting the $120,000 mark before August would not be far-fetched,” Wu wrote.
Bitget Research analyst Ryan Lee said in a research note that he believes the crypto can hit $120,000 by the end of July.
Other tokens were also racking up gains early Friday. Ethereum jumped 7.4%, Solana rose 4.7%, and XRP gained 10% over the past 24 hours, according to data from the crypto exchange Kraken.

-
AuthorSearch Results




Search
© 2024 Global View