
- This topic has 27,906 replies, 54 voices, and was last updated 12 hours, 48 minutes ago by GVI Forex 2.
-
AuthorPosts
-
June 30, 2025 at 1:56 pm #26937
4 PM London fixing
The 4pm month-end London fixing is important because it serves as a critical benchmark for pricing and executing foreign exchange (FX) transactions, particularly during periods of large institutional rebalancing, like the end of the month. Here’s why it’s so significant:
⸻
🔹 1. Global FX Benchmark
• The 4pm London fix (officially the WM/Refinitiv 4pm Fix) is the most widely used FX benchmark rate in the world.
• It provides a standardized rate that asset managers, custodians, corporates, and index funds use to value portfolios, execute trades, or calculate performance.⸻
🔹 2. Month-End Portfolio Rebalancing
• At month-end, global asset managers rebalance portfolios to align with benchmark indices (like MSCI or FTSE).
• This often requires converting currencies (e.g., if U.S. equities outperform, managers may sell USD to buy EUR or JPY to match benchmark weights).
• These FX flows are usually timed around the 4pm fix to ensure price consistency and transparency.⸻
🔹 3. High Volume = Market Impact
• Month-end 4pm fix sees a spike in trading volumes, making it one of the most liquid times in the FX market.
• But because everyone trades at once, it can also cause sharp moves or volatility in currency pairs — often referred to as “month-end fixing flows.”⸻
🔹 4. Benchmarking and Performance
• Many funds are evaluated against benchmarks priced at the 4pm fix.
• To minimize tracking error, fund managers prefer to trade at or near this rate, especially at month-end.⸻
🔹 5. Predictable Flow Patterns
• Market participants try to predict the direction of these flows ahead of time (e.g., “USD selling expected into the fix”), making it a tradable event.
• Banks often release month-end FX flow forecasts, which are closely watched by traders.June 30, 2025 at 1:48 pm #26936June 30, 2025 at 1:24 pm #26931Next up is Chicago PMI (released early to subscribers)… often an erratic report but in this market,there is usually a reaction to data.
See our Economic Data Calendar
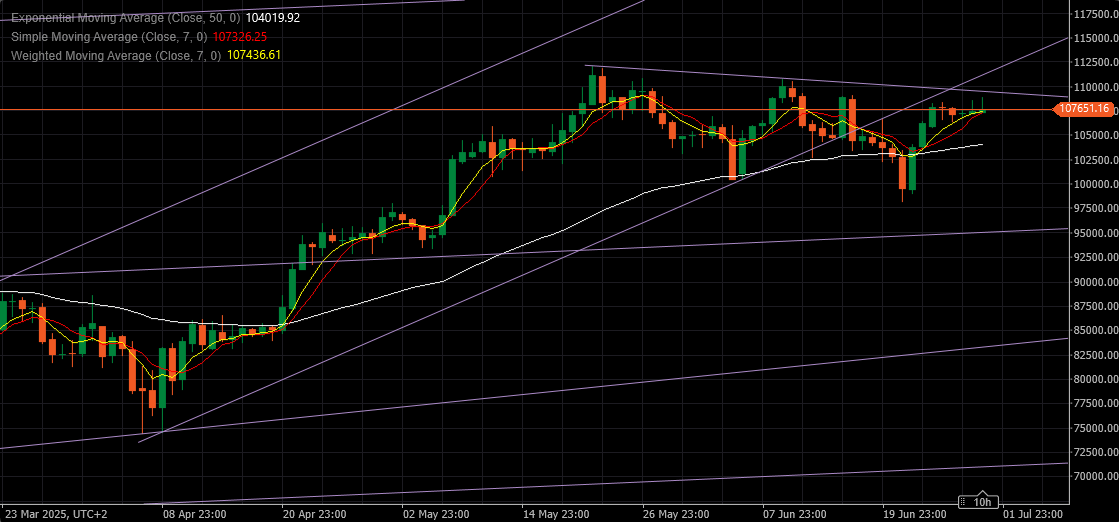
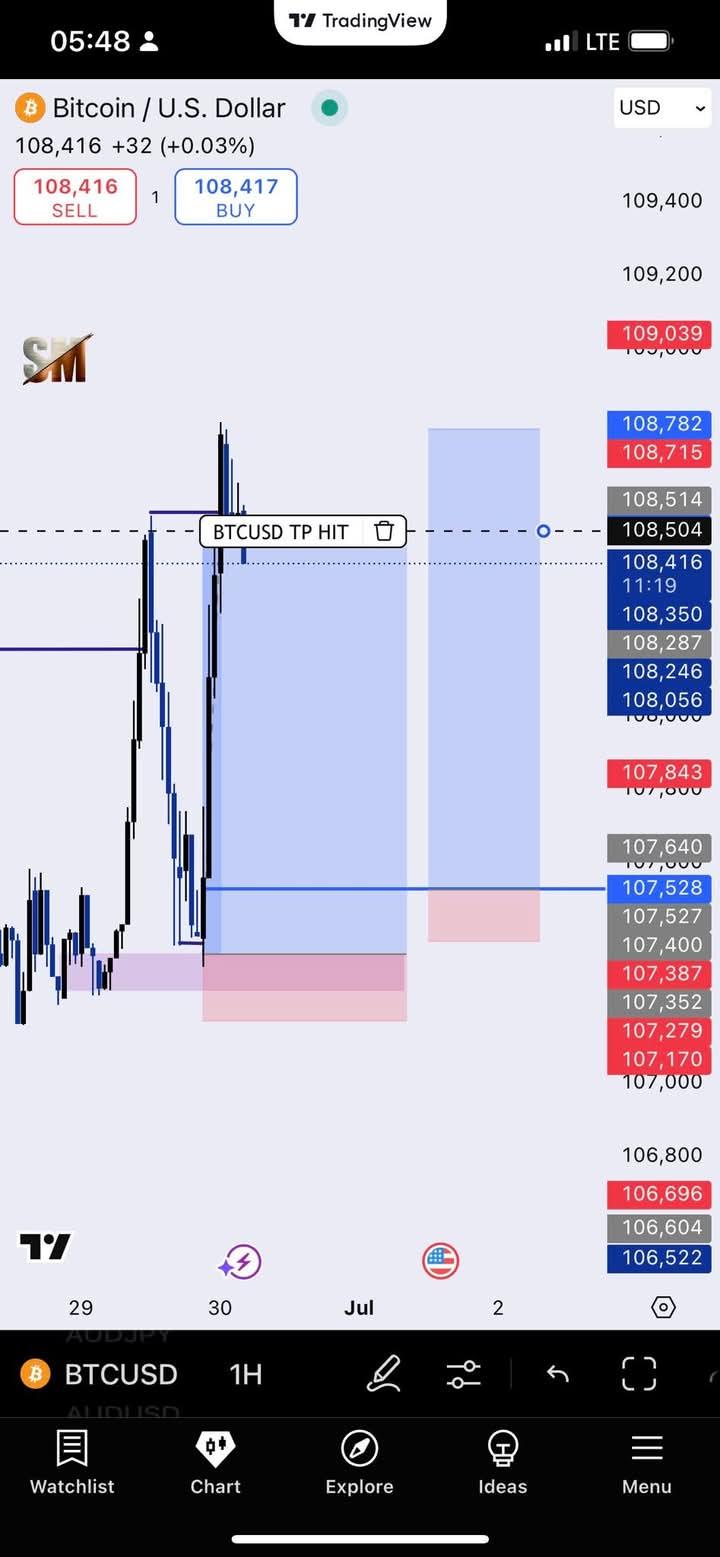
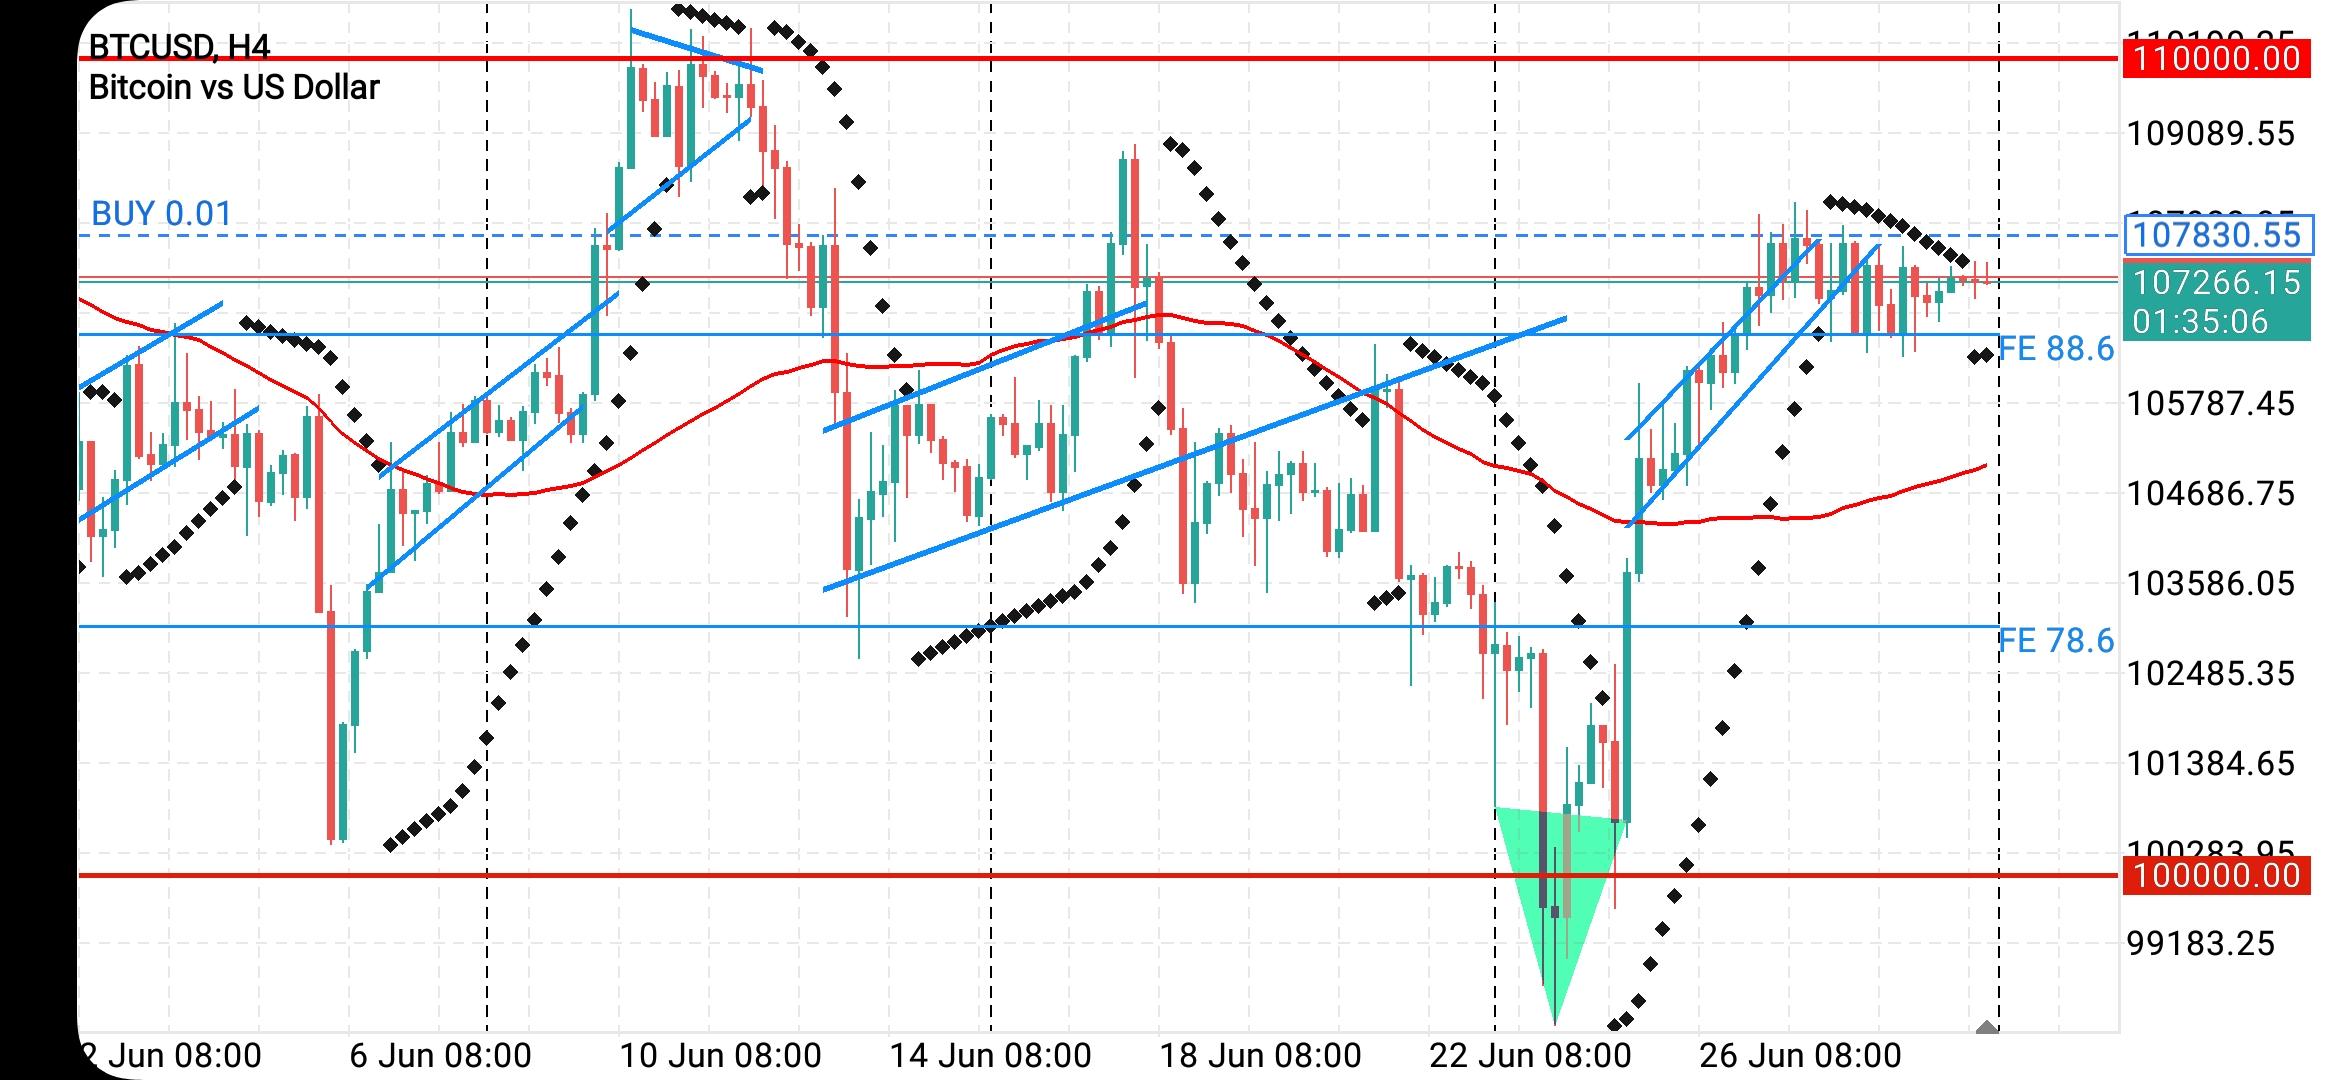
June 30, 2025 at 12:30 pm #26920June 30, 2025 at 12:03 pm #26912June 30, 2025 at 10:55 am #26911BTCUSD – Bitcoin
And another leg Up we had…
But it stopped short of the resistance at 109.600
Now is the question is that “It” – will it turn down again
107.345 is the turning point – if below targets 104.150
Day is still young, so we wait and see.
Currently the pressure is Down – Resistance at 107.975 – targets 106.650
 June 30, 2025 at 10:52 am #26910
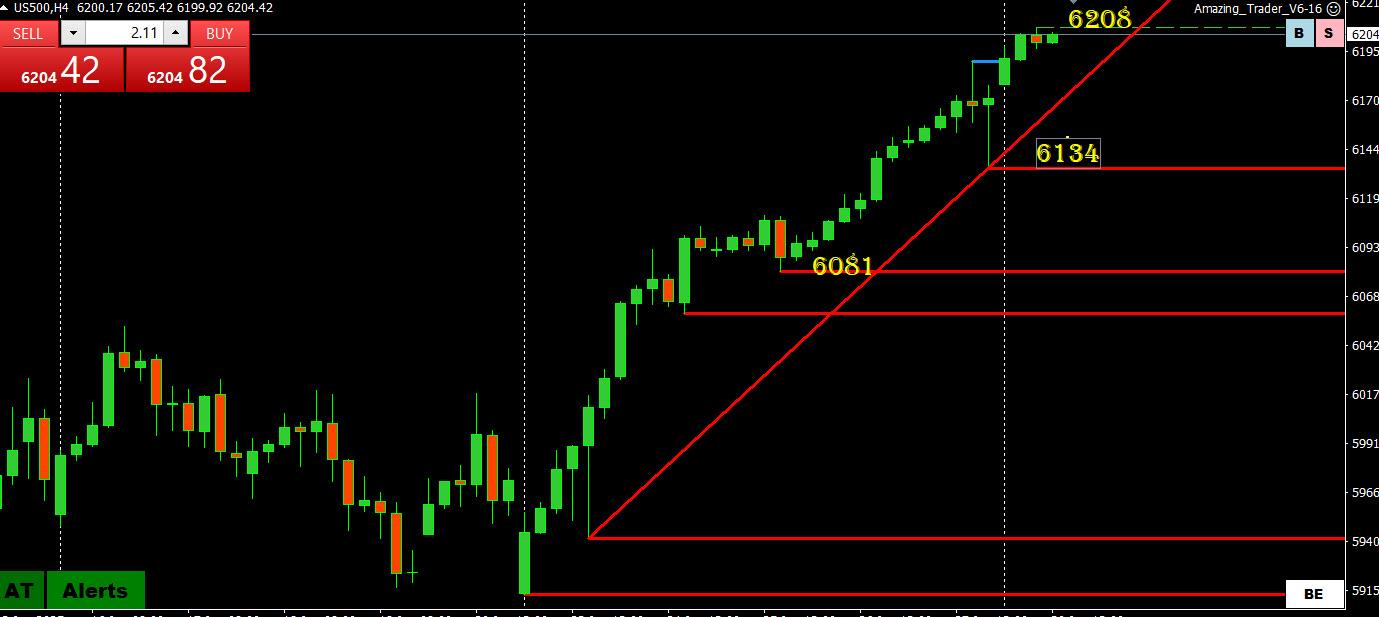
US500 (SP500)
When in unchartered (record high) territory an absence of key levels leaves the most recent high as key resistance.
This leaves 6200 as the pivotal and bias setting level going forward.
A test for stocks will come after month/quarter end passes as fund/money managers will want to show investors that they are invested in the rally to record highs ahead of month end.
US500 4 HOUR CHART
 June 30, 2025 at 10:44 am #26909
THIS WEEK’S MARKET-MOVING EVENTS (all days local)
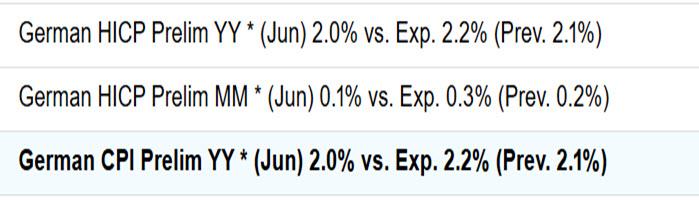
The upcoming week’s global economic data provides crucial insights into consumer behavior, inflation trends, and industrial activity across key regions. In Europe, focus turns to retail sales from Germany, Switzerland, and Italy, along with inflation updates from several countries. While France saw a June CPI uptick of 0.4% due to rising service and energy costs, Germany and Italy may follow suit, potentially pushing Eurozone inflation above the 2% threshold. On the industrial side, recent data indicate ongoing contraction, yet future optimism is fueled by NATO-aligned increases in military spending, with Germany pledging a notable 5% of GDP—though implementation remains uncertain.
In the United States, the economic calendar is compressed due to the July 4th holiday, with the June employment report releasing Thursday. Expectations are modest, with consensus around 110,000 new jobs and unemployment potentially rising to 4.3%. Sectoral weakness, particularly in retail, tech, and housing-related construction, is likely to weigh on job growth. Meanwhile, key manufacturing and services indices remain below the growth threshold, highlighting continued business caution. In Asia-Pacific, PMI figures from China, Japan, and South Korea will offer early insight into regional economic health amid ongoing geopolitical risks. Australia’s falling inflation may bolster the case for another interest rate cut in the near term. (Econoday)
 June 30, 2025 at 10:21 am #26908June 30, 2025 at 10:17 am #26907June 30, 2025 at 9:43 am #26906June 30, 2025 at 9:43 am #26905June 30, 2025 at 9:39 am #26904June 30, 2025 at 9:31 am #26903June 30, 2025 at 9:19 am #26902June 30, 2025 at 9:12 am #26901
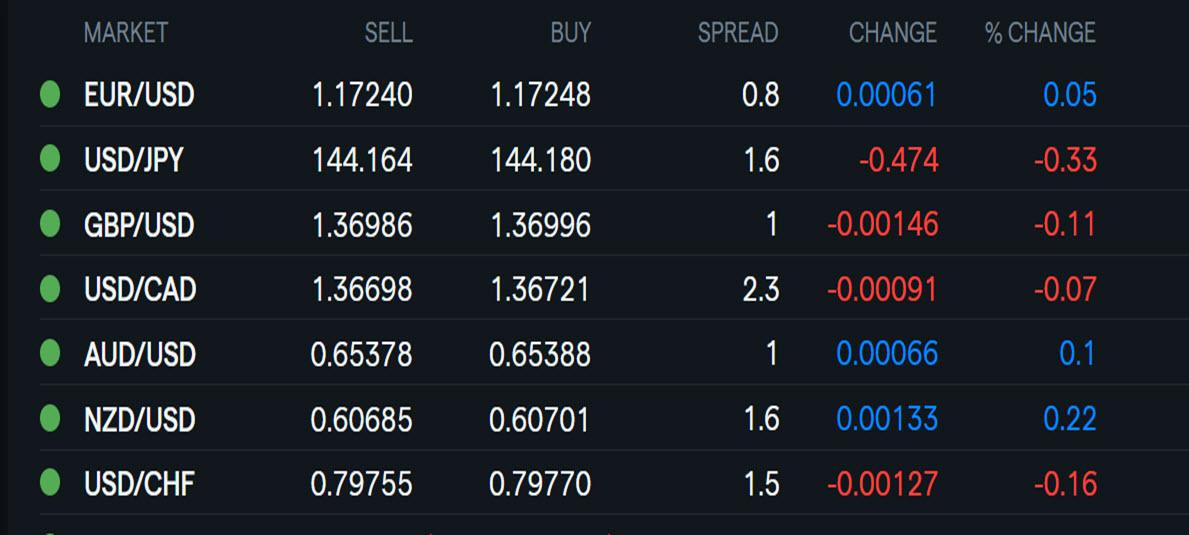
Using my platform as a HEATMAP shows
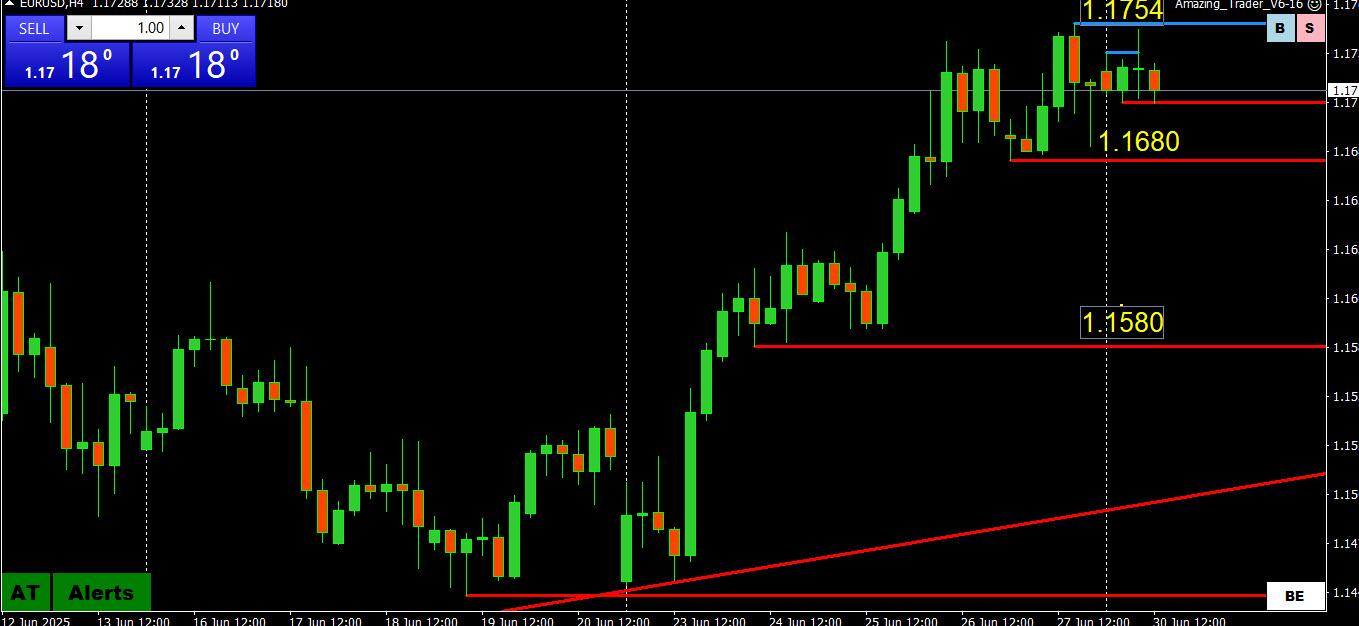
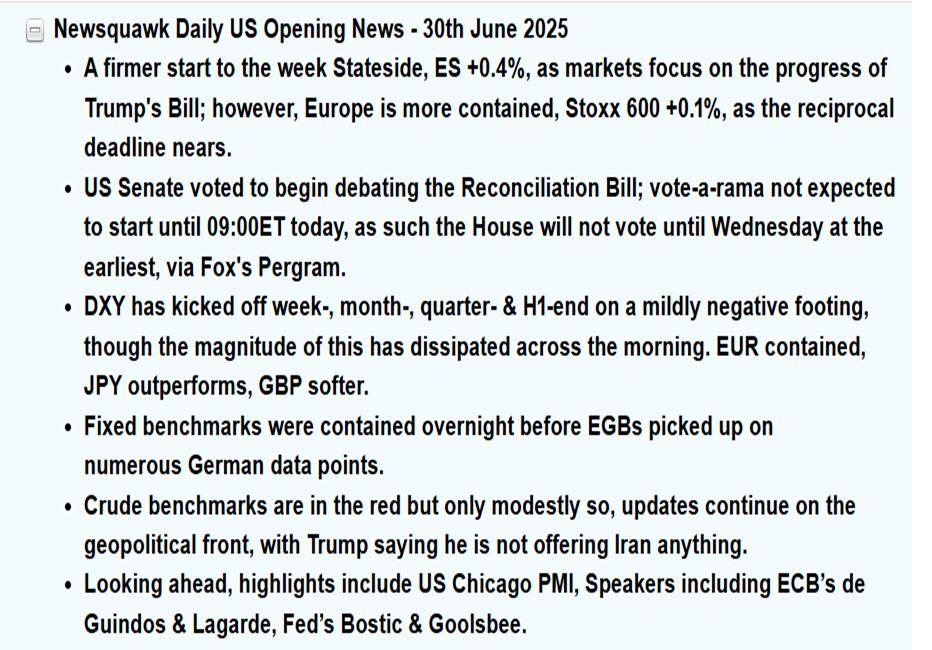
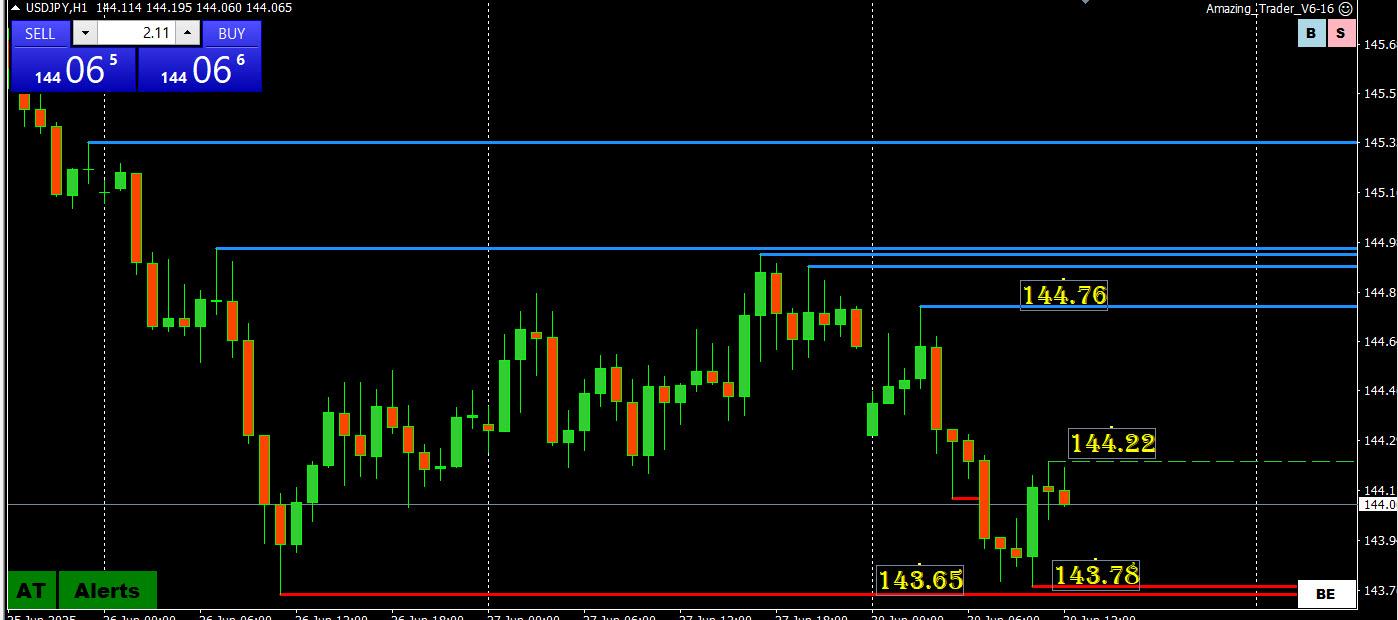
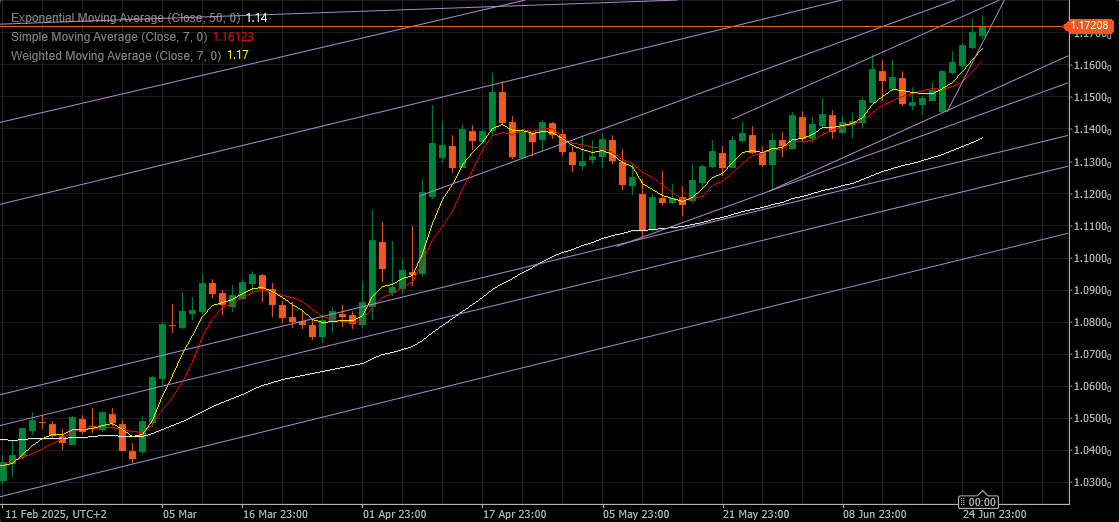
… the dollar trading mixed after falling earlier… EURUSD tested 1.1750 before backing off… JPY outperforming but USDJPY off its low
US stocks up… US500 tests 6200+
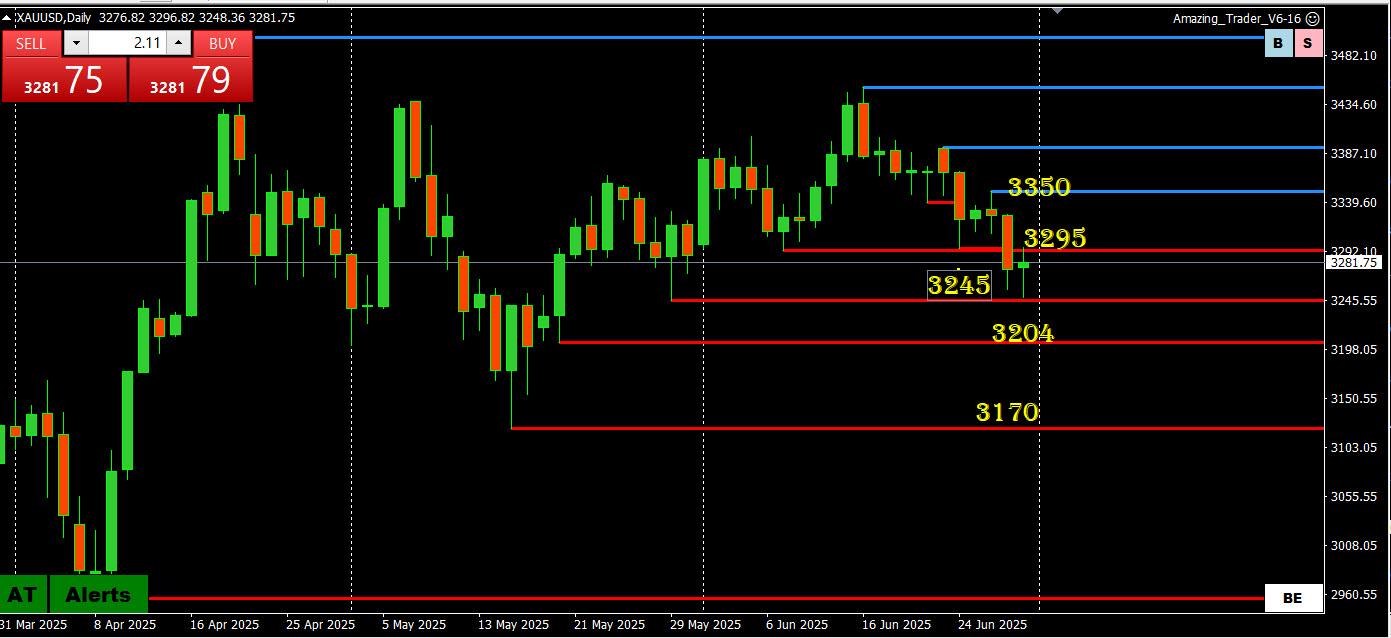
Gold rebounds
US bond yields down
Month.quarter end … look for some erratic flows, especially around the 4 PM London fixing… note EURGBP (currently up) tends to be very active around month end
 June 30, 2025 at 8:25 am #26900June 30, 2025 at 3:16 am #26899June 30, 2025 at 1:12 am #26898June 30, 2025 at 1:09 am #26897
USDX (US Dollar Index)
Downtrend: Consolidating 97.03-97.54 BUT
Is the triple bottom at 97.03 the low?
Key resistance 98.23 would need to be broken to confirm.
To make a run at 97,03, EURUSD would need to set a new high.
EURO is 57.6% of USDX and the index is often used as a proxy for EURUSD
USDX 4 HOUR CHART
 June 29, 2025 at 11:40 pm #26896June 29, 2025 at 11:39 pm #26895June 29, 2025 at 10:05 pm #26892June 29, 2025 at 9:53 pm #26891
Too much time on one’s hands ?
BIS Annual Economic Report | 29 June 2025
‘Unmoored’ inflation expectations could be huge shock to global economy, warns BIS
Trade uncertainty and high sovereign debt levels also among risks highlighted in watchdog’s report “Inflation expectations are very sensitive right now, and they could really jump if inflation were to be realized,” Hyun Song Shin, an economic adviser at the institution and author of its 2025 Annual Economic Report released SundayOn average, the households surveyed expect inflation to be about eight per cent over the next 12 months. Shin said leveraged hedge funds and portfolio managers are playing a more central role in what’s happening in the global market and that is changing the risk landscape.
“The types of risks are much more about what could happen when there is sudden selling, what’s going to happen to prices,” he said.
Huyn is not original nor alone in musing about “what could happen when there is sudden selling, what’s going to happen to prices,”
June 29, 2025 at 3:58 pm #26890June 29, 2025 at 3:51 pm #26889BTCUSD – Bitcoin
I said yesterday : Support at 106.875 has to hold ( for BTC to be able to move higher and attack resistance at 109.600)
And it held – actual low 106.876
Now after reaching above 107.400 road is open for test of mentioned resistance.
We need a close tonight just above 107.435 for tomorrow to have another leg Up.
 June 29, 2025 at 2:24 pm #26888
Fund Managers Survey
• Comerica notes extreme underweighting of the dollar among fund managers—the lowest in 20 years, with significant overweight in eurozone assets .
• On June 27, Comerica highlighted the same trend: broad outflows from USD into commodities and G10 currencies—especially CHF, JPY, EUR, GBP—confirming ongoing de-dollarization
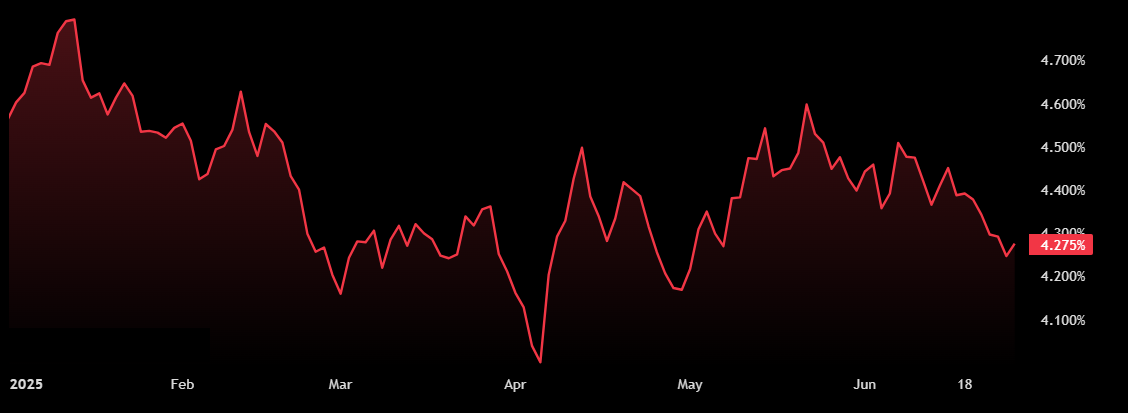
June 28, 2025 at 7:25 pm #26886June 28, 2025 at 3:52 pm #26885Treasury Yields Rise as Trade Tensions Make a Comeback
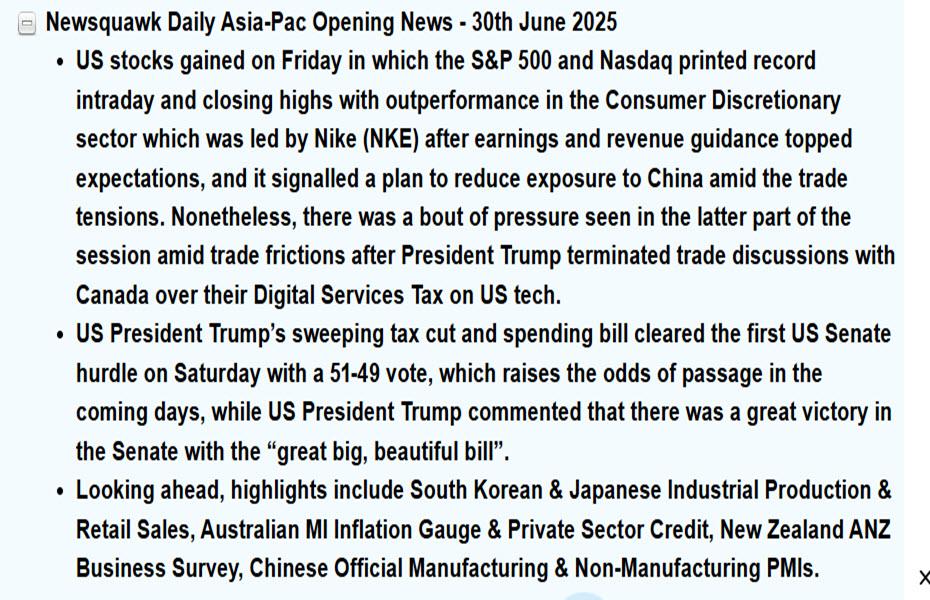
Trade wars regain center stage, fueling a Treasury’s selloff that boosts yields. Trump ends trade talks with Canada because of a Canadian tax on digital services. Earlier, the White House touted progress on rare-earth negotiations with China. Meanwhile, PCE indicators show inflation a tad hotter than expected and consumer spending weaker. The combination puts the Fed in a tough spot. Markets are mostly pricing three or more cuts this year, according to CME data. The 10-year rises 0.030 percentage point to 4.238% and the two-year snaps a seven-day declining streak to gain 0.027 p.p., to 3.741%. Both are down for three consecutive weeks. June jobs report is due Thursday.
 June 28, 2025 at 3:46 pm #26884
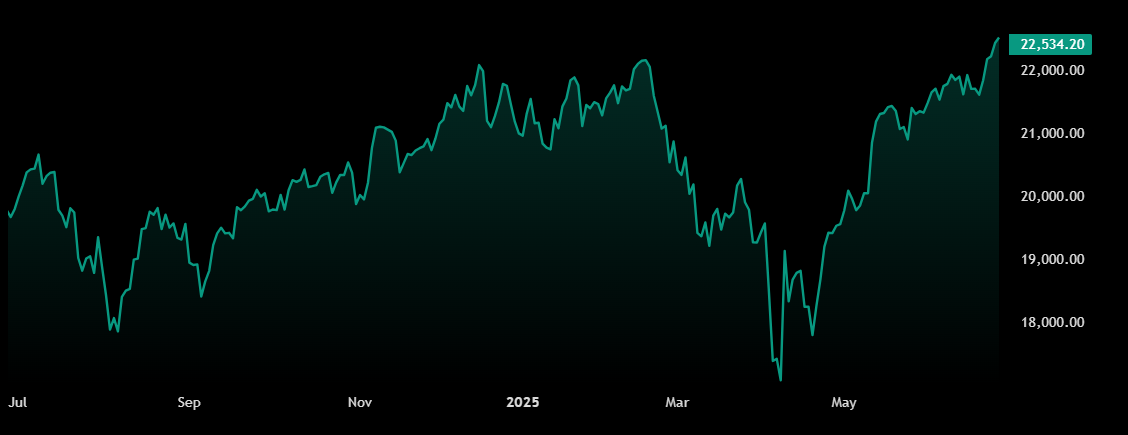
IXIC: Nasdaq Composite Hits Record Close as Tech-Dense Index Adds 32% Since April Lows
Key points:
· Nasdaq charts record highs
· What a magnificent comeback
· Nvidia leading the broader group
Yep — you read that right. Just over 32%, or one-third, of the index’s valuation was added in the span of just three months.
Celebrate Bull Times — Come On
· The Nasdaq Composite index IXIC rewrote history on Friday, notching its brand-new all-time closing high. Techy guys, this one goes out to you — the tech-heavy index added 0.5% to log out at 20,273.46 points.
· That’s the first record since the index’s December peak and comes amid all kinds of mixed-bag data, diverging outlook for the global economy, and — of course — Trump’s confusing rhetoric.
· But, and perhaps more interesting to the math kids, the Nasdaq Composite is up 5% on the year, but 32% since its April crash when Trump introduced the tariffs.
Drumroll: And the Winners Are…
· In other words, one-third of the Nasdaq’s valuation — a total of $23 trillion — was added in the span of just three months. That’s $7 trillion in net new money pouring into the index, an average of about $2.3 trillion each month.
· The gargantuan amount is highly concentrated in a handful of stocks. Collectively called the Magnificent Seven, they are the heavy-hitters, the hyperscalers of the corporate world and are present in just about every serious fund manager’s portfolio.
· Nvidia NVDA, Microsoft MSFT, Apple AAPL, Amazon AMZN, Alphabet GOOGL, Meta META, and Tesla TSLA. That’s the reason those charts are flashing green arrows in uncharted territory.
Breakdown: Performance
· But not all are equal. The full club of seven is collectively down on the year — a negative 0.6% performance.
· Take Nvidia – Jensen Huang’s AI juggernaut. The shares are up just 15% this year, but more than 65% since the April lows. Presently, they’re chasing the formidable $4 trillion valuation, with just about $200 billion left to pull in.
· Meta is up 21% and Microsoft is up by 17%. The other four are on the other side of the ledger for the year. But all are up between 15% and 50% from the April selloff.
-
AuthorPosts




- You must be logged in to reply to this topic.
Search
© 2024 Global View