
- This topic has 28,290 replies, 54 voices, and was last updated 33 minutes ago by Belgrade Bobby.
-
AuthorPosts
-
May 22, 2025 at 10:18 am #25233
EURUSD 15 MINUTE – What AT is showing
1.1291 => 1.1303 => 1,1290 =>
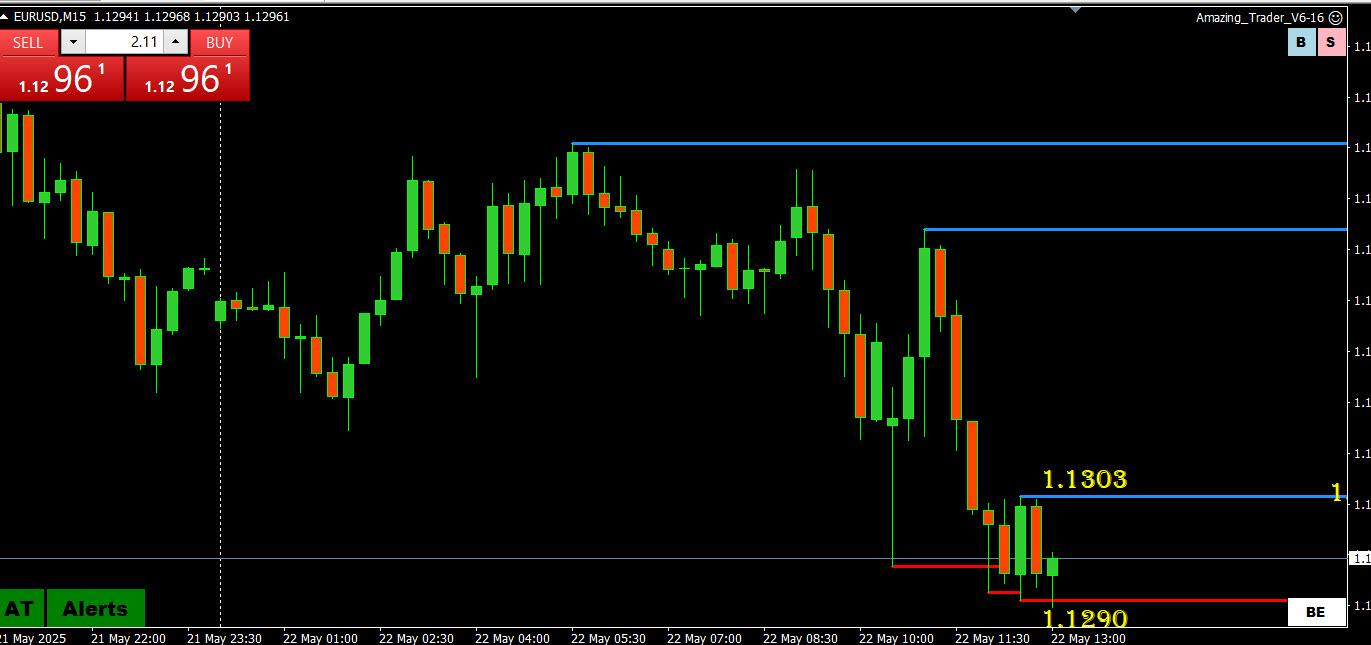
Market is probing for sell stops but so far running into bids.
You can see my earler post why AT is more than just a charting algp… not on;y are its levels consistently “amazing” but the logic of how to use then along with the patterns they form make AT invalubale for any type of trader.
AT = The Amazing Trader
Get your 30 day trial by clicking on this Amazing Trader link
May 22, 2025 at 10:03 am #25231May 22, 2025 at 9:40 am #25230May 22, 2025 at 9:38 am #25229May 22, 2025 at 9:33 am #25228EURUSD 1 HOUR – What AT is saying
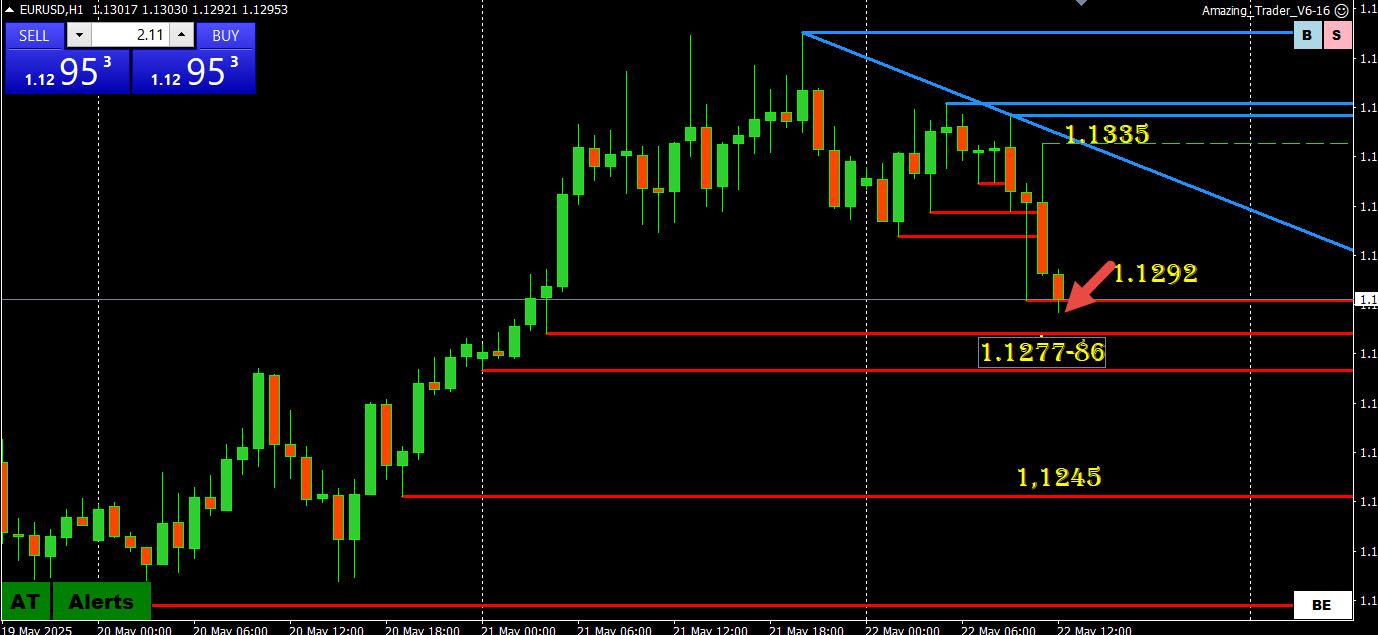
Once again, reaction to news is what matters (i.e. EURUSD weaker on dip in flash PMIs)
Low so far 1.1292, which if you look in search I have been citing it as AT’s
“Key level: 1.1292… firm break would confirm end of the current downtrend”
Chart shows 1.1286, 1.1277, 1.1245 should 1.1292 give way
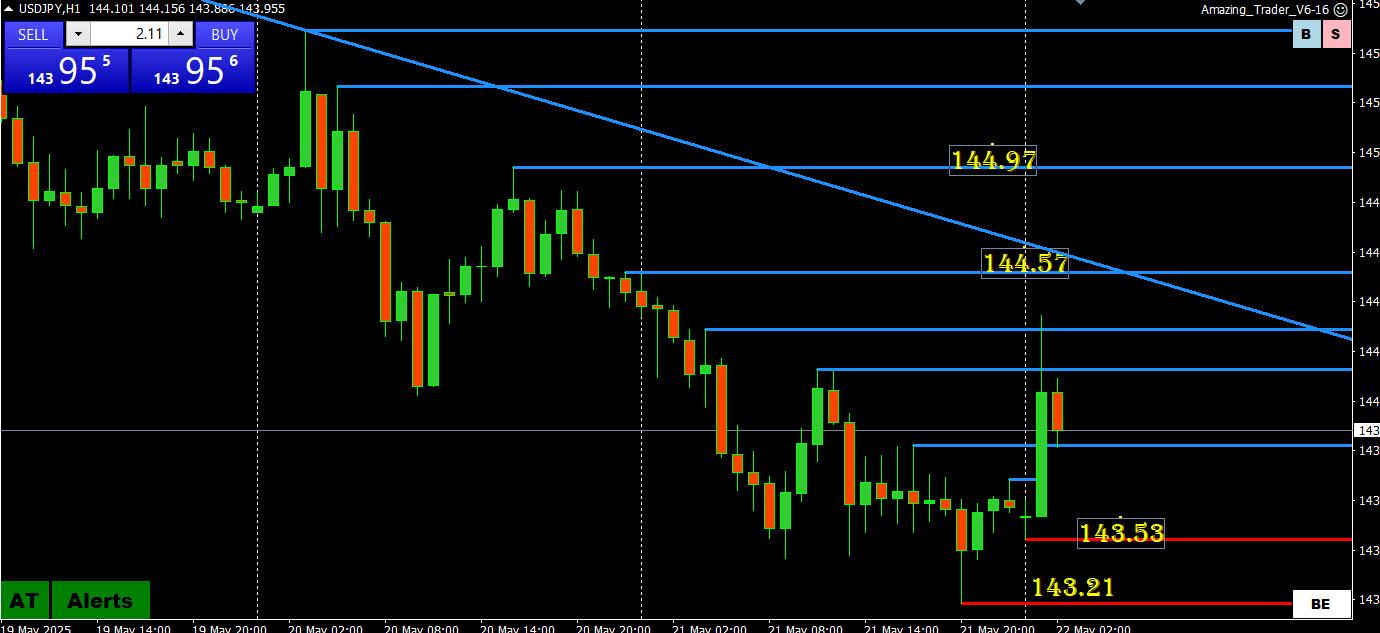
May 22, 2025 at 9:20 am #25227May 22, 2025 at 9:12 am #25226USDJPY 4 HOUR – What AT is showing
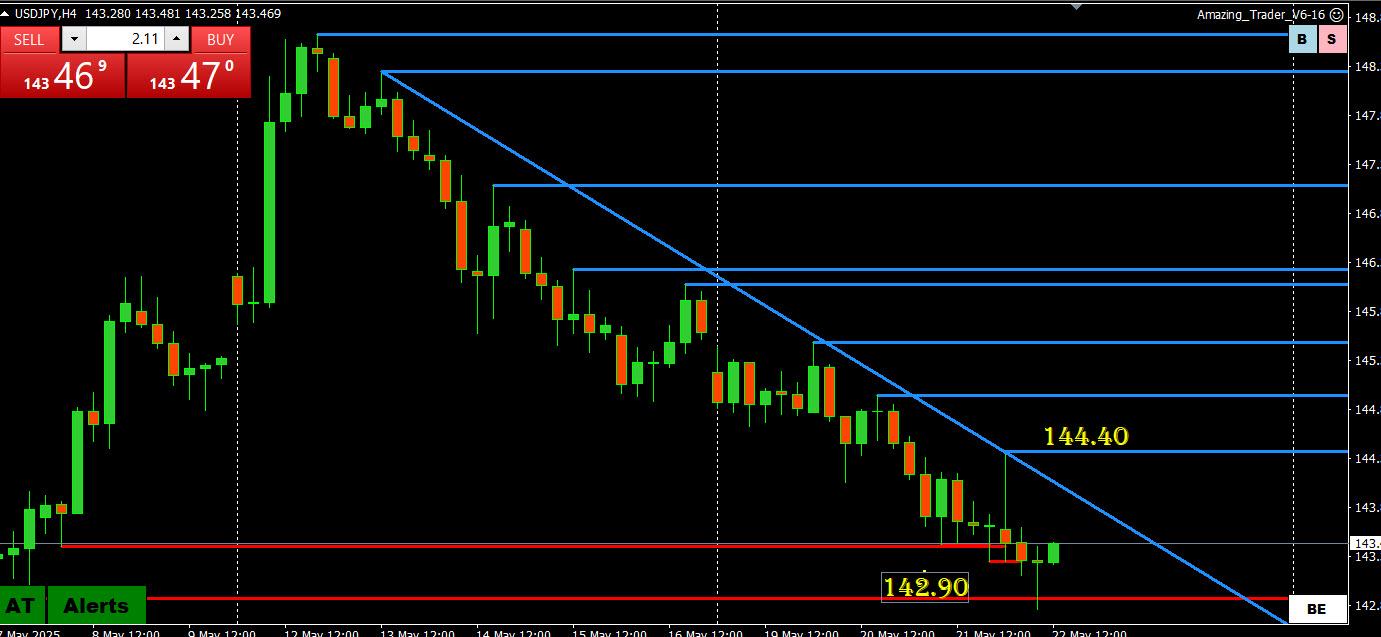
Classic case of a phantom spike as Tokyo opened (high 144.40) made a mess of charts by stopping out weak shorts, which in turn made it harder to absorb fresh selling that saw 142.90 briefly broken (low 142.80). before a bounce.
Going strictly by the chart,
Range is 142.80-144.40
Risk is on the downside while below 144.40
143-144 is a no man’s land (no stops to go after within it_
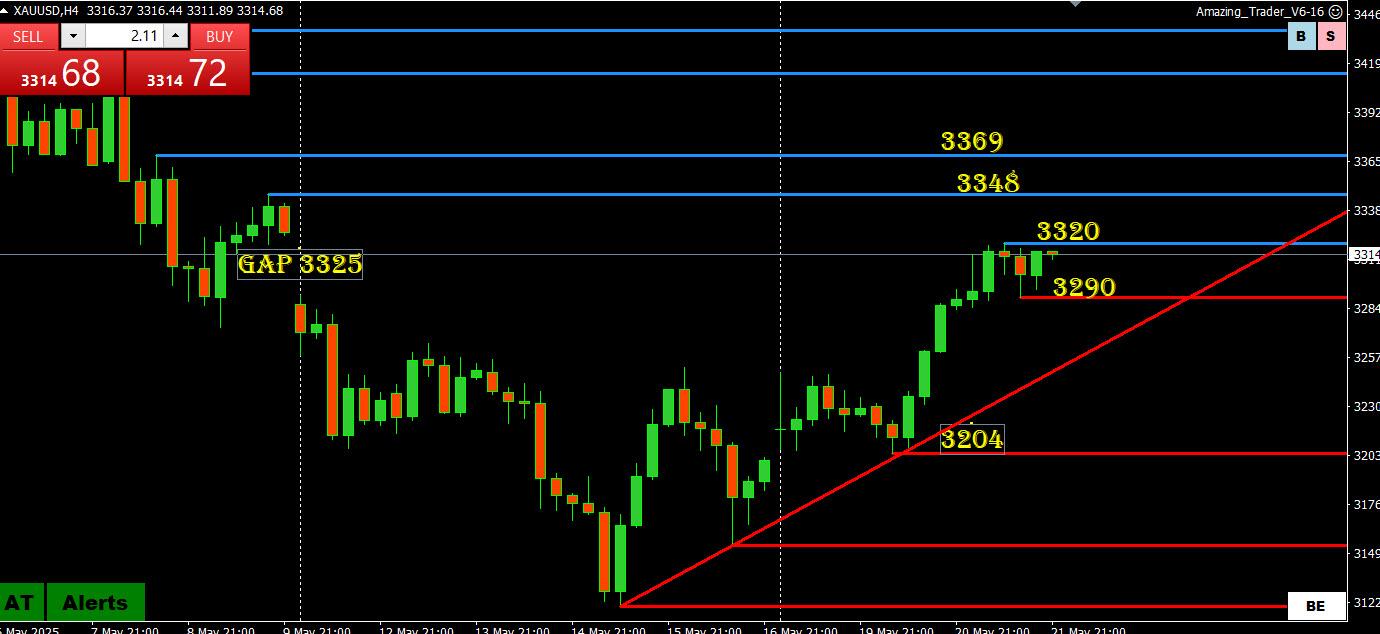
May 22, 2025 at 8:56 am #25225XAUUSD (GOLD) 4 HOUR CHART – What AT is showing?
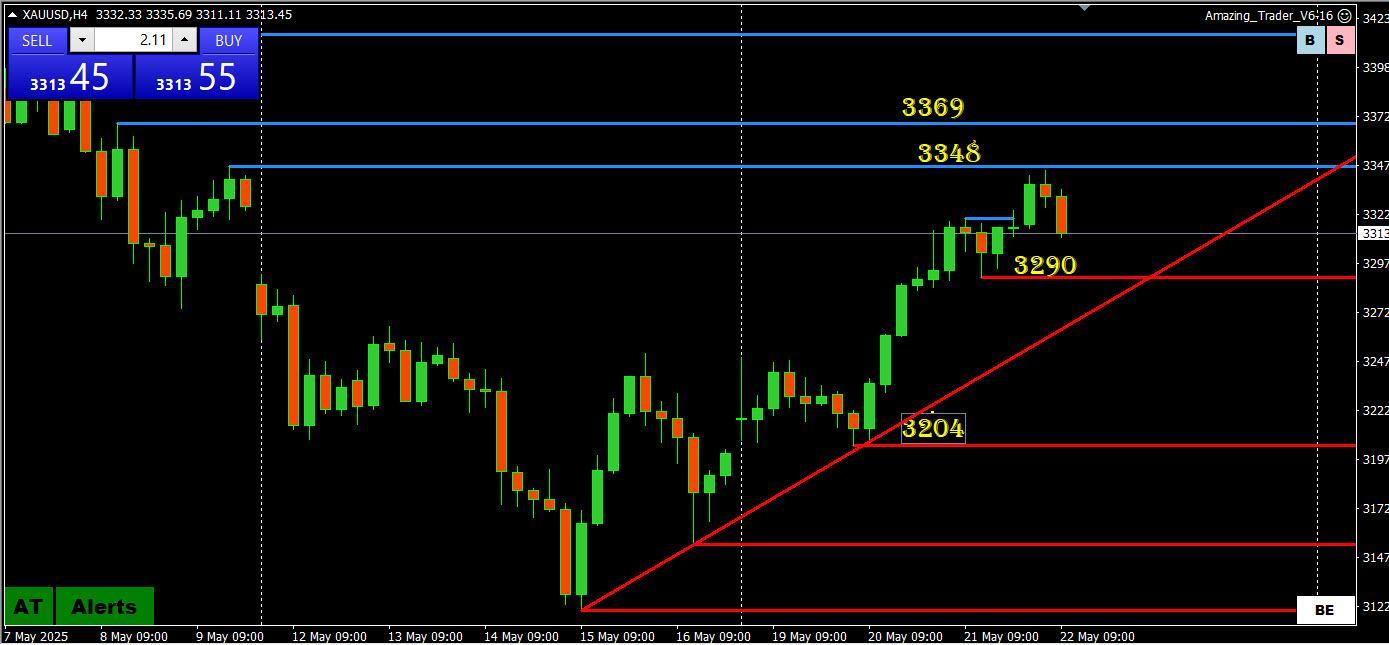
This AT chart looks like a textbook pocture…
Breakout to the upside filled the old gap and came within a hair of testing its 3348 target (high 3345).
On the downside, 3290 needs to hold yo keep a bid although only a break of the trendlkine would change the picture.
AT = The Amazing Trader
Get your 30 day trial by clicking on the Amazing Trader link un the menu bar at the top of this page)
May 22, 2025 at 8:49 am #25224Using my platform as a HEATMAP shows…
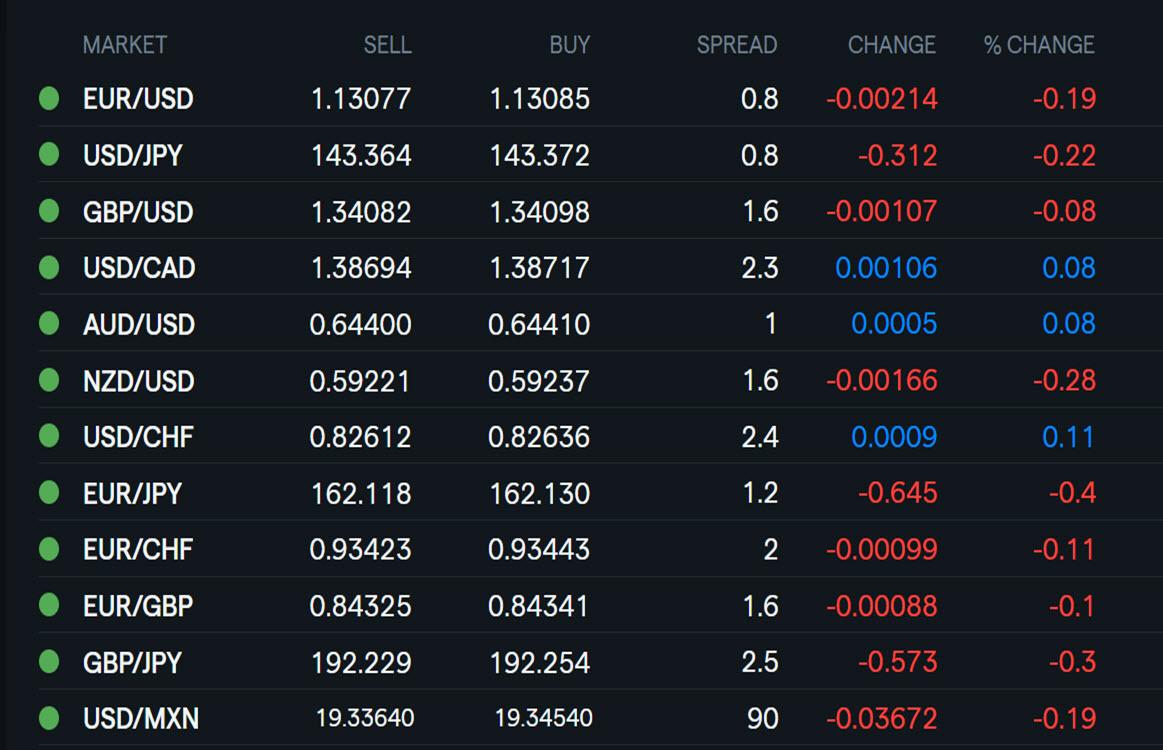
Markets taking a breather
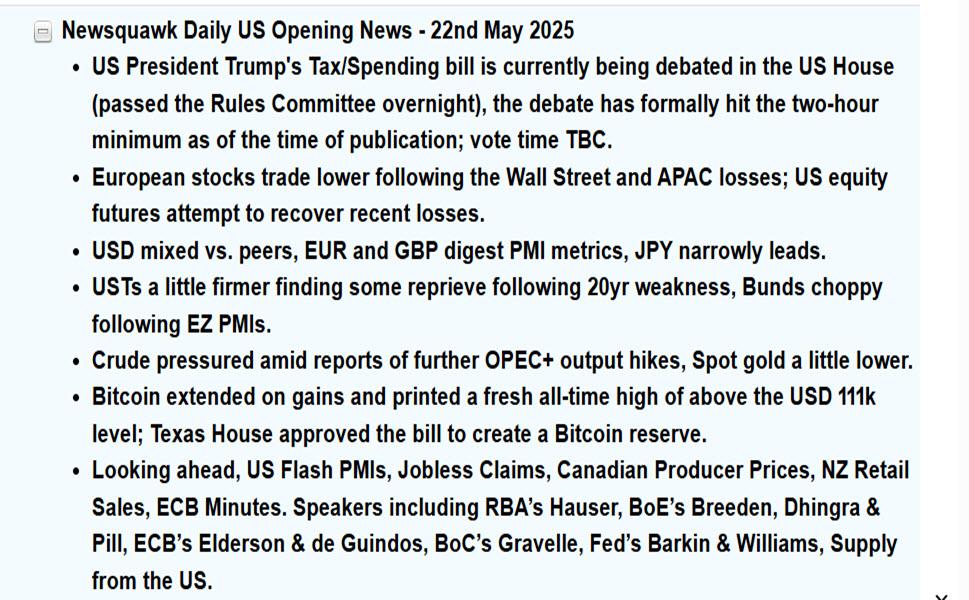
… the dollar trading mixed USDJPY weaker but off its lowlow, EURUSD softer after flash PMIs
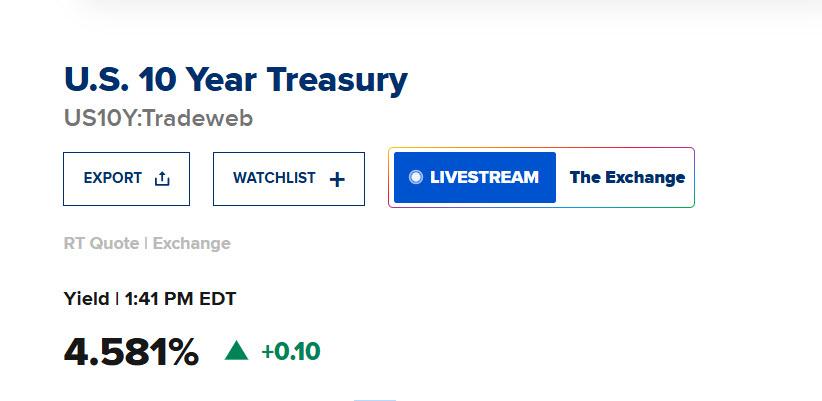
US bond yields remain elevated but 10-year so far resisting 4.60%
US stocks consolidating after yesterday’s sell-off
Gold a touch lower but above 3300
US data: Weekly jobless claims S&P global flash PMI, Expected House vote on tax bill
May 21, 2025 at 11:22 pm #25222May 21, 2025 at 11:03 pm #25220May 21, 2025 at 9:19 pm #25219Very timely article in our blog
Why Falling Stocks and Rising Bond Yields Are a Red Flag for Markets
 May 21, 2025 at 8:58 pm #25218May 21, 2025 at 8:01 pm #25217May 21, 2025 at 7:57 pm #25216
US500 (SP500) 4 HOUR – What AT is showing

The AT ladder strategy says when there are 3 lines (in this case blue) it often indicates the risk of an acceleration in the direction of the lines (in this case down).
This has seen 5875 broken, which confirms the end of the latest leg up.
While below 5875, then 5847 (briefly broken so far) and 5796-5816 are targeted. Note there is still a lingering opening week gap below 5786.
AT = The Amazing Trader
Get your 30 day trial by clicking on the Amazing Trader link un the menu bar at the top of this page)
May 21, 2025 at 6:48 pm #25212May 21, 2025 at 6:43 pm #25210EURUSD Daily
Supports: 1.13200, 1.12850 & 1.12650
Resistances: 1.13650, 1.13850 & 1.14600
For more serious advances EUR needs to break into that channel above the head , but not stay long in it – obnoxious banana slide – either you leave it behind you or you slip back where you came from…
Pattern is bullish for tomorrow and should result in next leg Up
 May 21, 2025 at 6:31 pm #25208May 21, 2025 at 6:30 pm #25207May 21, 2025 at 5:59 pm #25206May 21, 2025 at 5:47 pm #25205May 21, 2025 at 4:15 pm #25204May 21, 2025 at 4:10 pm #25203
BTCUSD 1h
If you have just listened what I was saying about 2h ago, you could have pocketed about 2.000 pips on this one 😀
Still the target is at around 110 K, and might be reached even today.
But I am going to settle for waiting the close and asses it for tomorrow – don’t like rushing in late in the day.
 May 21, 2025 at 4:01 pm #25202
Any currency but the dollar
–
yeah, that ll be a thicket to ride
as japan. taiwan and s. korea yapping about discussing x-chage rates and “adjustements”
Iii-Eeee HA!re walmart and trump call
Walmarts is no publicly mussing about absorbing the tariffs by spreading it (or dilluting it) accross its global enterprice so that everyone everywhere pays a litte bit more but US buyers pay there little bit less than they otherwise would.It is making ECB suits wake up and scream n yell about blablabla inflation blablabla
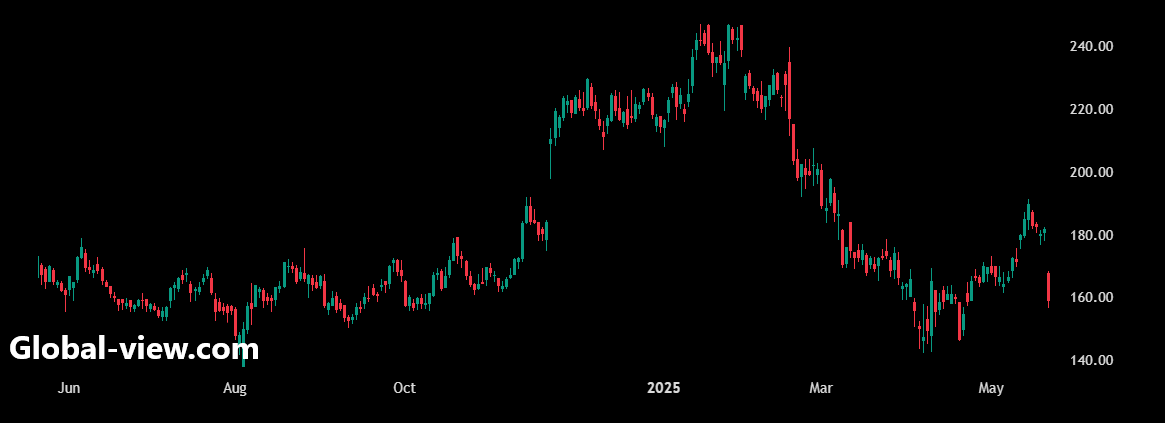
May 21, 2025 at 3:56 pm #25201Wix Down Over 12%, on Pace for Largest Percent Decrease Since February 2022
Wix Ltd. (WIX) is currently at $158.76, down $22.99 or 12.65%
· Would be lowest close since April 22, 2025, when it closed at $154.61
· On pace for largest percent decrease since Feb. 16, 2022, when it fell 23.06%
· Currently down four of the past five days
· Down 6.39% month-to-date
· Down 26.01% year-to-date
· Down 55.04% from its all-time closing high of $353.09 on Feb. 19, 2021
· Down 5.05% from 52 weeks ago (May 22, 2024), when it closed at $167.19
· Down 35.66% from its 52-week closing high of $246.76 on Jan. 28, 2025
· Up 8.37% from its 52-week closing low of $146.50 on April 21, 2025
· Traded as low as $156.98; lowest intraday level since April 22, 2025, when it hit $147.76
· Down 13.62% at today’s intraday low; largest intraday percent decrease since Feb. 16, 2022, when it fell as much as 29.51%
 May 21, 2025 at 3:53 pm #25200May 21, 2025 at 3:18 pm #25199May 21, 2025 at 2:35 pm #25198May 21, 2025 at 2:03 pm #25196May 21, 2025 at 1:43 pm #25195
-
AuthorPosts








- You must be logged in to reply to this topic.
Search
© 2024 Global View