
- This topic has 28,268 replies, 54 voices, and was last updated 1 hour, 2 minutes ago by GVI Forex 2.
-
AuthorPosts
-
May 8, 2025 at 8:03 pm #24408May 8, 2025 at 7:39 pm #24407
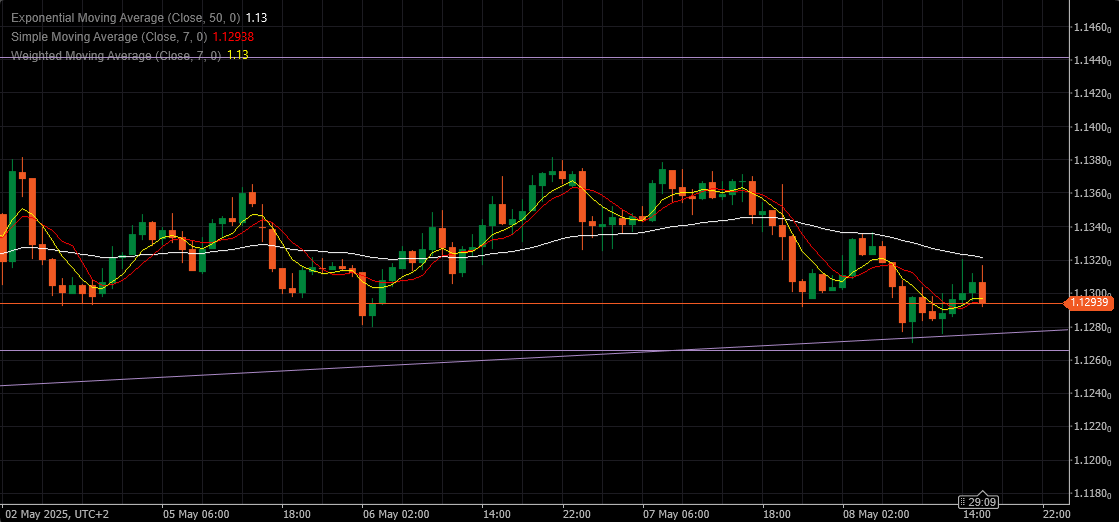
EURUSD 4 HOUR CHART – What is AT saying
AT says the forex market lives to run stops
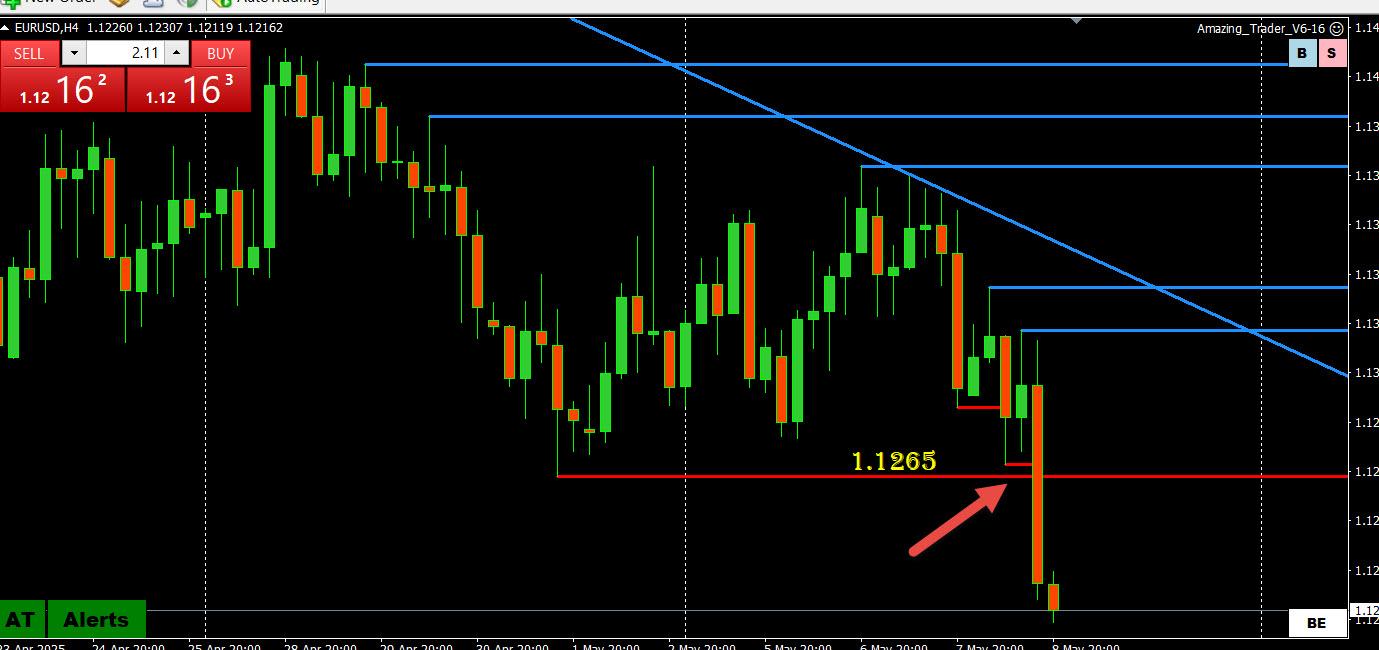
AT says when you identify where stops are most vulnerable it gives a clue what side to trade from
Proof of concept: See what happened when 1.1265 was broken… prior to that intra-day support was at 1.1270 so a double whammy run through stops
AT = The Amazing Trader (see link in the top menu bar for a 30 day trial)
May 8, 2025 at 7:25 pm #24406A carrot for CHina but 50% is still a lot… USDJPY moves through146 on this headline
 May 8, 2025 at 6:29 pm #24405
CNN
–
One trade ‘deal’ done, 199 to go
President Donald Trump has finally gotten his first trade deal done. – By David GoldmanQtn is: who wants to be 199th ?
May 8, 2025 at 6:23 pm #24404May 8, 2025 at 6:17 pm #24403May 8, 2025 at 6:13 pm #24402May 8, 2025 at 6:06 pm #24401May 8, 2025 at 5:45 pm #24400that is the attitude !
EU to launch dispute against U.S. tariffs as it sets out 95 billion euros in countermeasures
May 8, 2025 at 4:41 pm #24398May 8, 2025 at 4:35 pm #24396May 8, 2025 at 4:34 pm #24395I posted this yersterday and USDCAD 1.38 pattern will be broken today (bullish)
Pattern: Pivotal (“magic”) 1.38 level has printed 6 days in a row
The longer this pattern goes on the greater the risk of a directional move in the direction of the break.
If the breakout above 1.3905 holds, nrext chart level is 1.3977
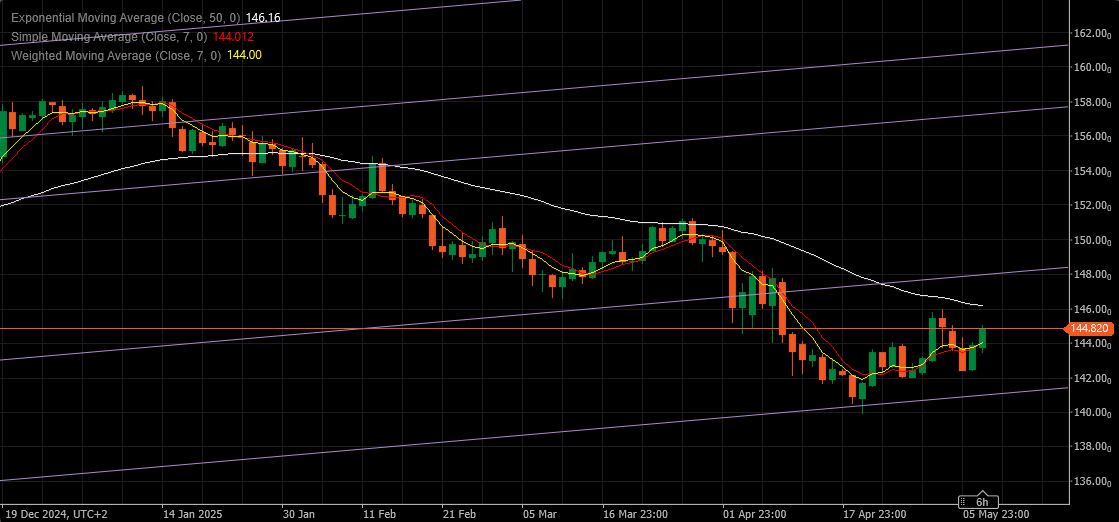
May 8, 2025 at 4:25 pm #24394USDJPY DAILY CHART – What is AT showing
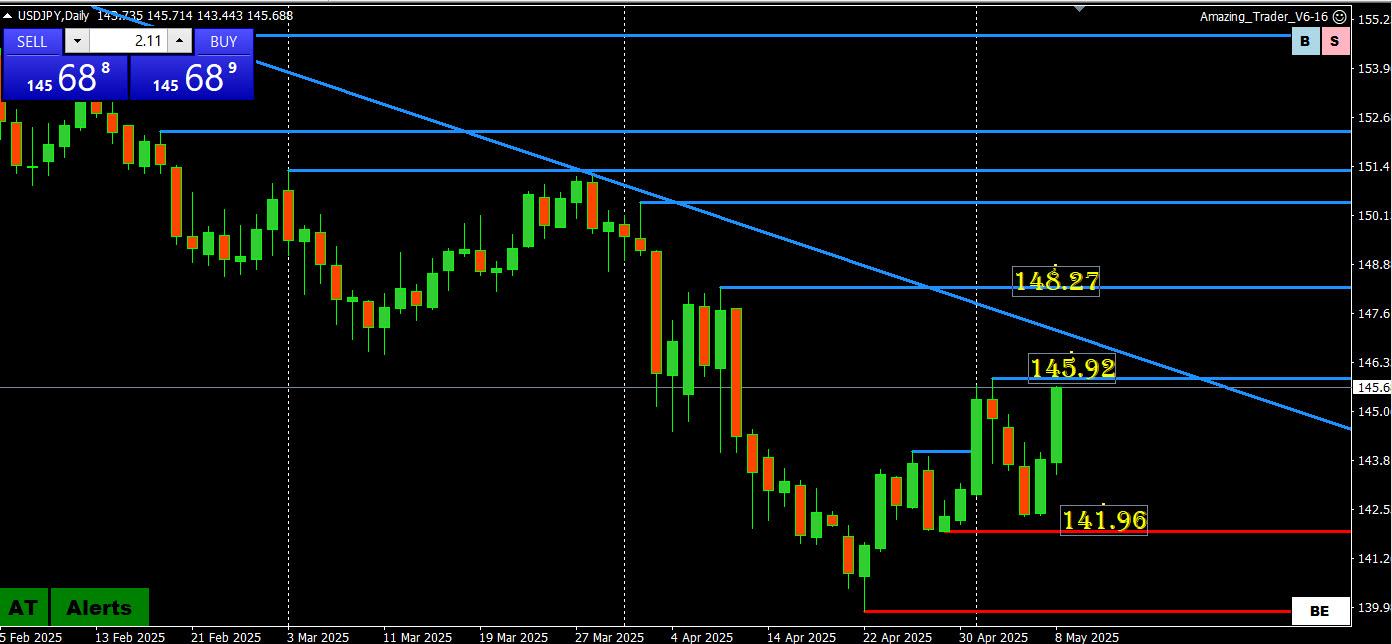
Damage not yet fatal: Watch 145.92
Break of 145.08 exposes the key 145.92 … a break here would put the DAILY trendline and 148.27 on the radar, a level that if broken would put the nail in the coffin of the downtrend.
Keeps a bid while above 145.00-08.
AT = The Amazing Trader (see link is in the top menu bar for a 30 day trial)
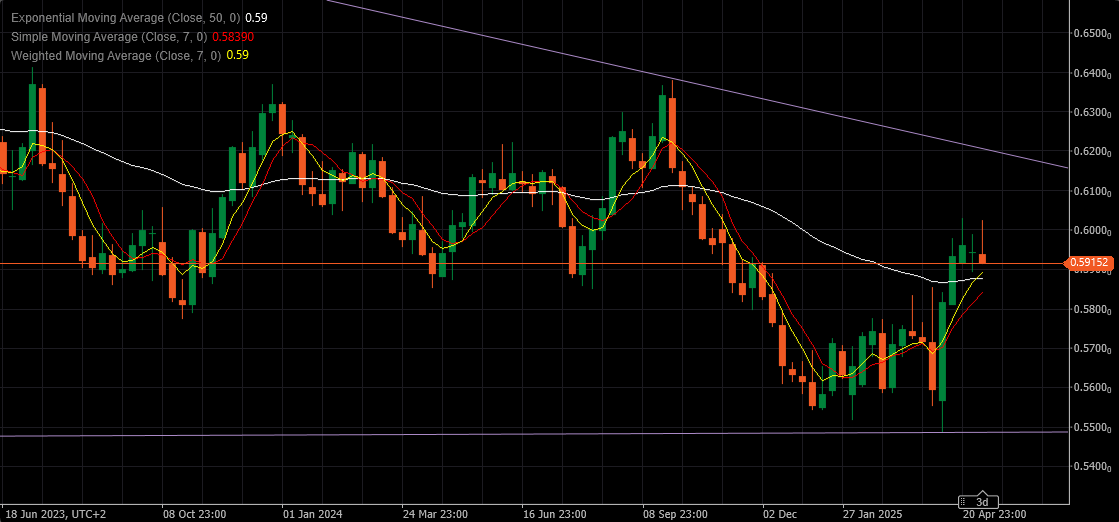
May 8, 2025 at 4:19 pm #24393Weekly Perspective on NZDUSD
Kiwi couldn’t reach even close to Downtrend Resistance line dating back from 2021. waiting at 0.62050
This is not going to be a jolly close of the week for it, and if below 0.58850 and possibly 0.58450, would turn Bearish.
Only close above 0.59400 would give it another weekly chance.
 May 8, 2025 at 4:16 pm #24392May 8, 2025 at 4:09 pm #24391
XAUUSD – GOLD -1 HOUR CHART – What is AT showing?
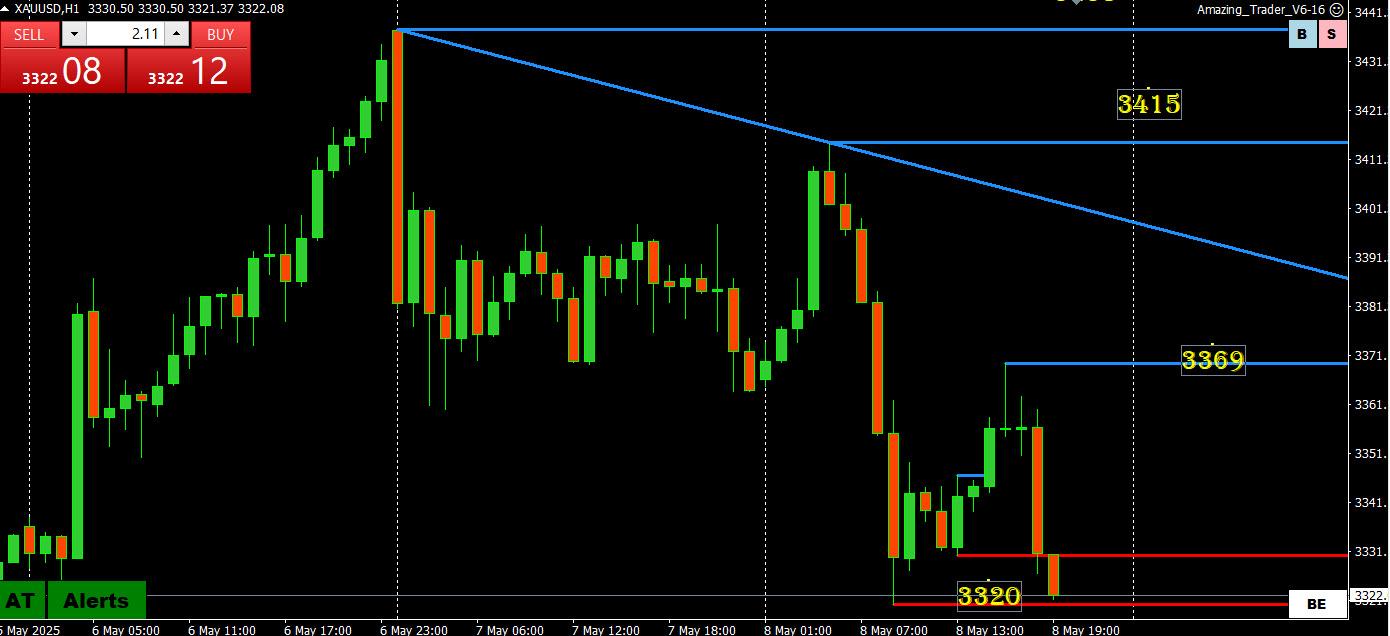
Failure to get back and stay above 3360 (high 3369) keeps XAUUSD on the defensive.
Supports: 3320 (intra-day double bottom) and 3305 (more important) , below that a void to 3222.
AT = The Amazing Trader (see link is in the top menu bar for a 30 day trial)
May 8, 2025 at 3:48 pm #24390May 8, 2025 at 3:03 pm #24389May 8, 2025 at 2:55 pm #24383May 8, 2025 at 2:53 pm #24381May 8, 2025 at 2:52 pm #24379May 8, 2025 at 2:49 pm #24375May 8, 2025 at 2:48 pm #24374Wall Street opens with gains as US-UK finalize trade deal, tech stocks rally
Wall Street saw optimism in early trade on Thursday, May 8, after U.S. President Donald Trump announced that the U.S. and U.K. have agreed on a trade deal.
At 7.20 pm IST or 9.50 am ET, the Dow Jones index was higher by 185 points or 0.45 percent, the tech-heavy Nasdaq index gained 100 points or 0.55 percent, while the broader S&P 500 index ticked up 25 points or 0.45 percent.
“The agreement with the United Kingdom is a full and comprehensive one that will cement the relationship between the United States and the United Kingdom for many years to come,” said President Trump, in a post on Truth Social.
The U.S. President will reveal further details at 10 am ET. Trump also added that there are more deals, which are in serious stages of negotiation.
Tech stocks gained on Wednesday following reports that the Trump administration plans to roll back upcoming AI chip restrictions introduced under the Biden administration. The controls were set to take effect later this month.
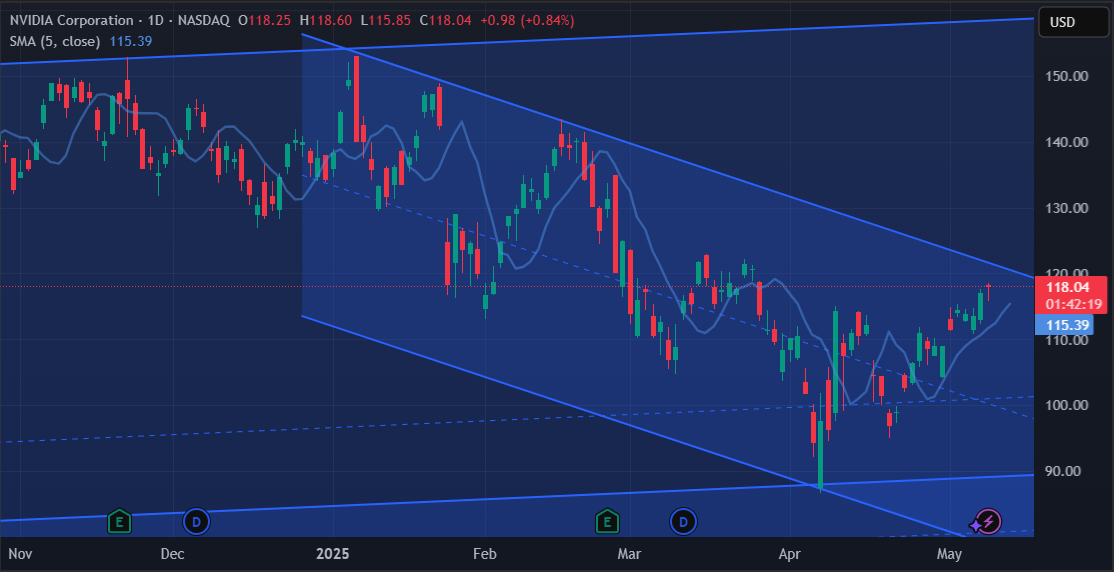
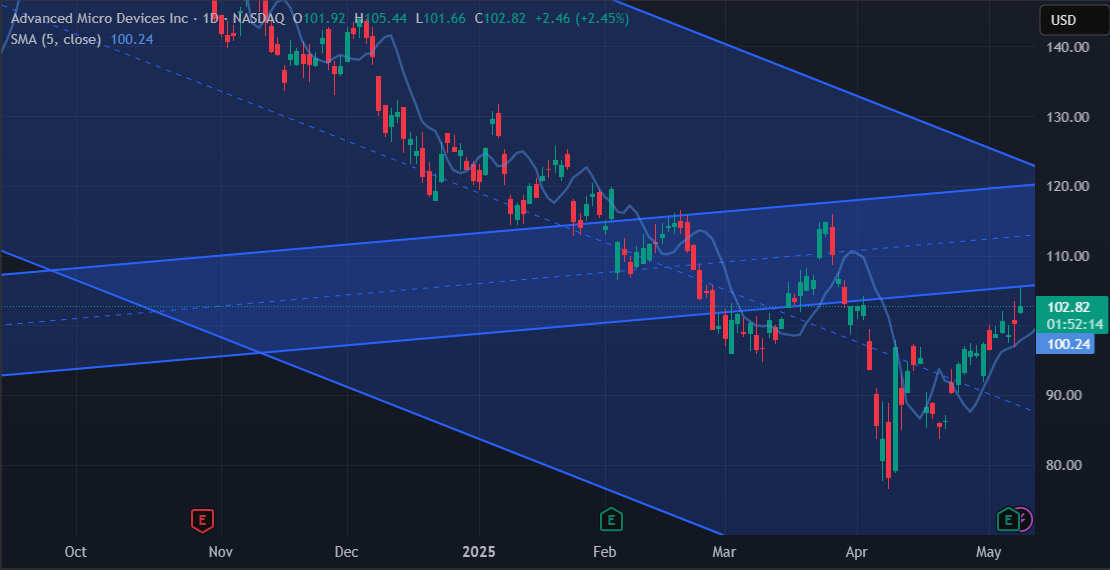
Chipmakers led the rally, with Intel jumping 3.3 percent, AMD rising over 3 percent, and Nvidia edging up 0.5 percent. Among megacaps, Meta and Amazon gained more than 1 percent, while Tesla surged more than 3 percent.
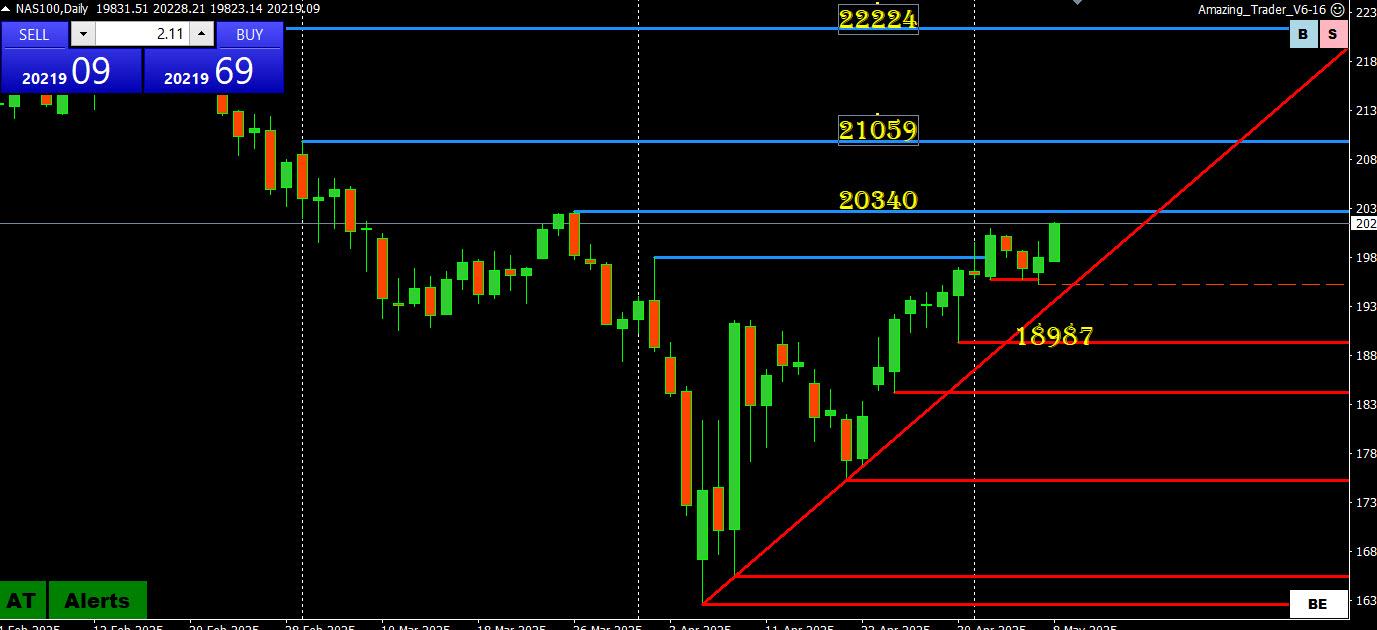
Nasdaq Chart
 May 8, 2025 at 2:40 pm #24368May 8, 2025 at 2:35 pm #24361May 8, 2025 at 2:19 pm #24347May 8, 2025 at 2:00 pm #24330May 8, 2025 at 1:26 pm #24301May 8, 2025 at 1:11 pm #24287
Quick update:
EURUSD PAUSED ABOVE 1.1265 BOTTOM OF RANGE SUPPORT
GBPUSD PAUSED ABOVE 1.3233 BOTTOM OF RANGE SUPPORT
USDJPY PAUSED BELOW 145
GOLD (XAUUSD) IS BACK TO 3360 AFTER RUNNING STOPS BELOW IT
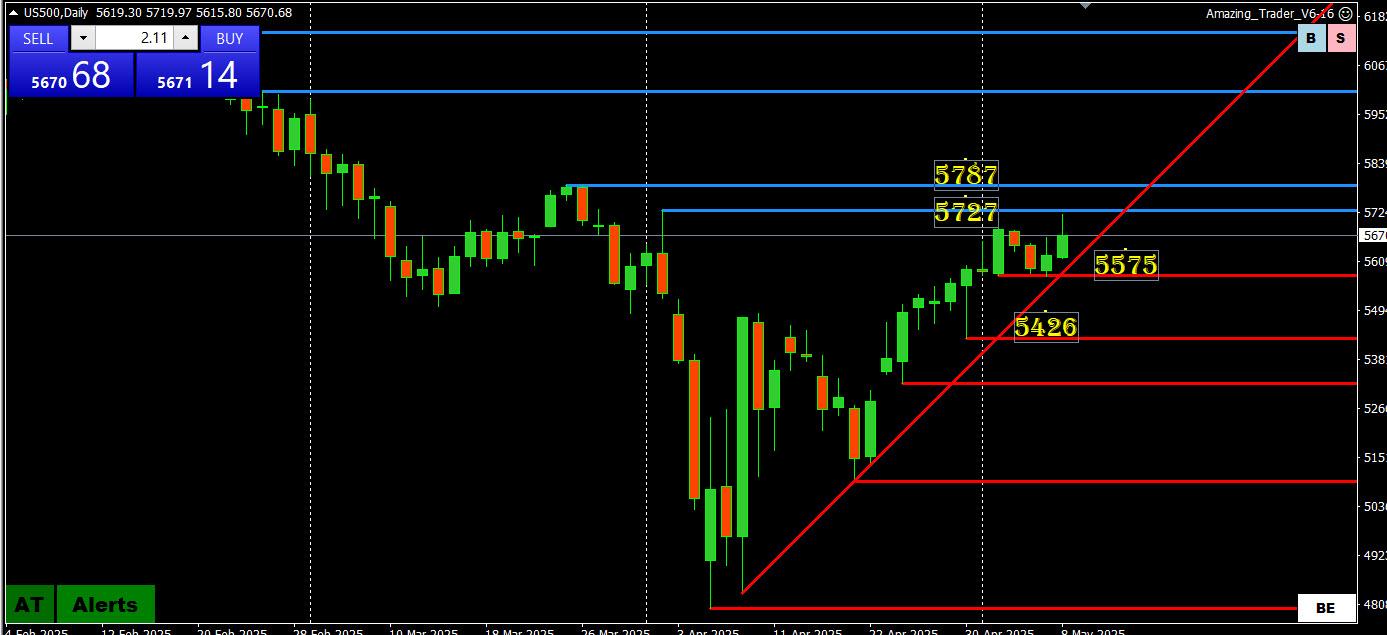
SP500 PAUSED BELOW 5700
NEXT FOCUS; TRUMP WILL TOUT UK TRADE DEAL… MARKET REACTION WILL BE MORE IMPORTANT THAN THE WORDS
May 8, 2025 at 12:42 pm #24267 -
AuthorPosts




- You must be logged in to reply to this topic.
Search
© 2024 Global View