
- This topic has 27,907 replies, 54 voices, and was last updated 15 hours, 28 minutes ago by Mtl JP.
-
AuthorPosts
-
March 25, 2025 at 1:14 pm #21366March 25, 2025 at 1:01 pm #21365March 25, 2025 at 1:00 pm #21364March 25, 2025 at 12:55 pm #21363March 25, 2025 at 12:51 pm #21362March 25, 2025 at 12:51 pm #21361March 25, 2025 at 12:37 pm #21358March 25, 2025 at 12:33 pm #21357March 25, 2025 at 12:28 pm #21356March 25, 2025 at 12:27 pm #21355
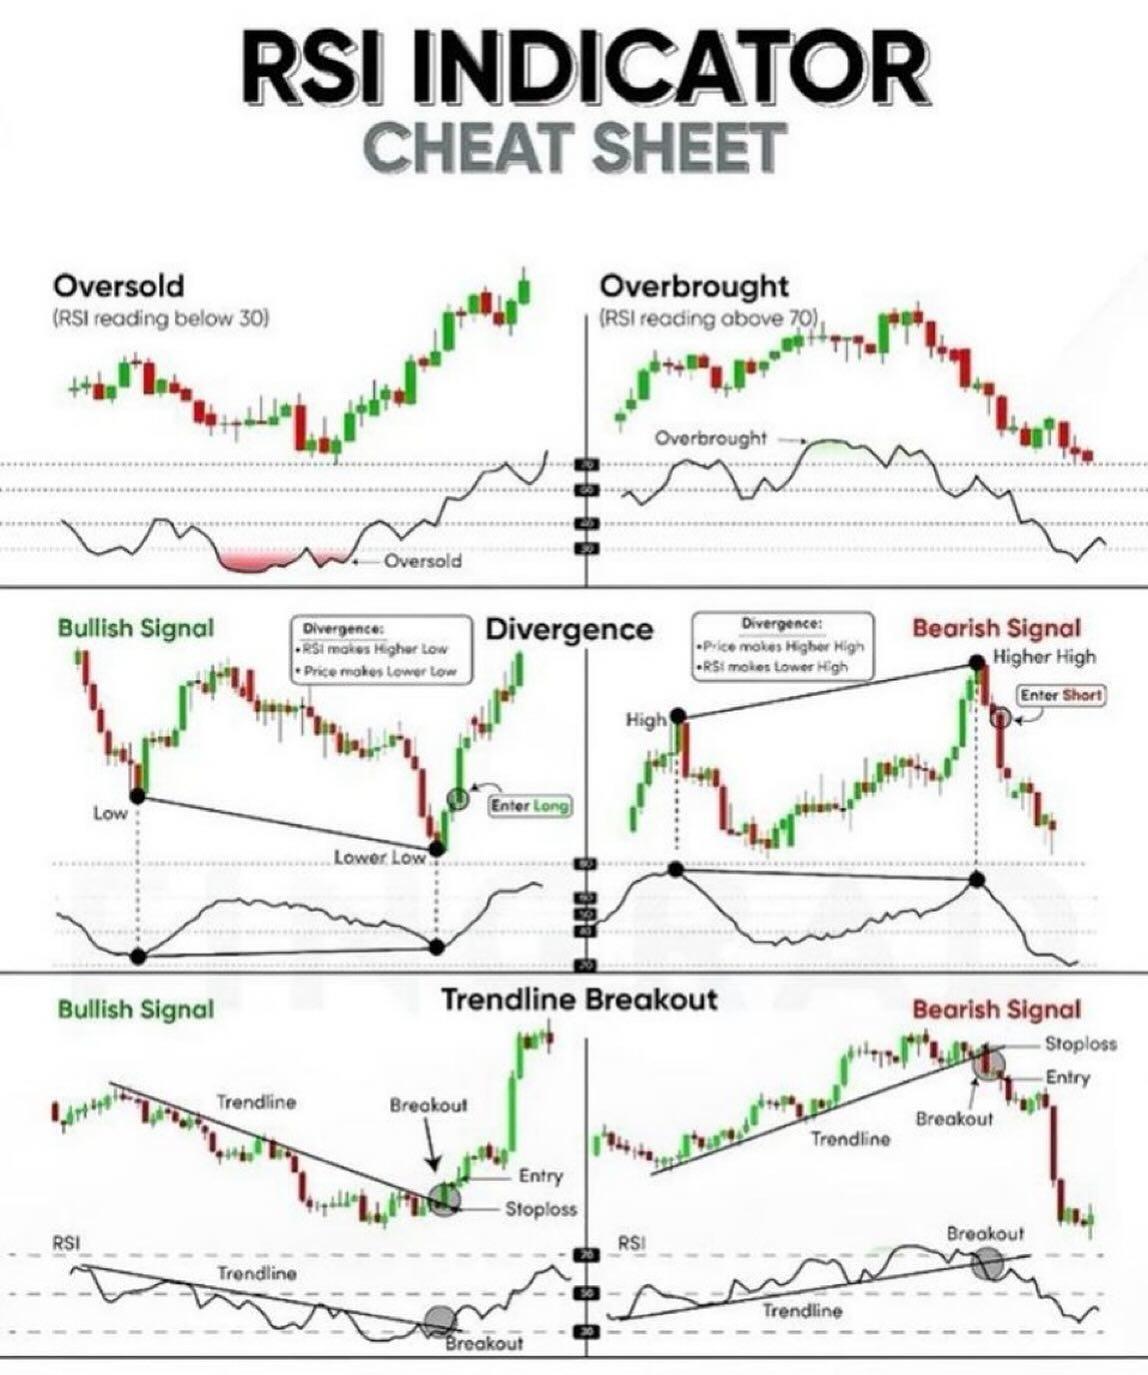
Robert – Re: RSI
I have been using it long ago, but never as exclusive Indicator.
RSI 9 was my favourite.
What I can see from your Cheat Sheet, idea to draw trend lines on it never crossed my mind to be honest 😀 And just by looking at it right now, I can see logic.
Let me give you some unorthodox view on RSI – my approach was the same as everyone else’s and it gave me hard time many times, until I had a chit chat with a friend of mine. At the time ( late 90’s) he was a chief dealer at one of the Central Banks.
He told me how they use it – and I was shocked :
When RSI gets above 100 or below 20 – so overbought or oversold, and hesitates to change the direction, it is a prime sign that market will continue strongly in the direction it was already in – so while we water rabbits were going contra, expecting it to change the trend, market ( and all those CB’s) were just using our stops and orders to continue their Rally.
Of course, after some time market changes the direction, but it is not the same when it does like 3-500 pips higher/lower: D
I am not saying that it always works, but just one interesting Tip for you…
March 25, 2025 at 12:21 pm #21354good morning
DLRx a bit on the backfoot this morning after failing to hold 104
Tariff morpho-dynamics still an issue for players.
Some squeakings from ECB gumflappers about possible “easing” pause in april
Other squeakings from US gumflappers suggested that relatively high dollar is contributing to trade imbalabce and that FX is a potential tool but not right away.
Trump repeated his wish for a lower dollar.The dollar has a nega-feel while under 104
FED yakkers kugler and williams on deck this morning
data-wise consumer conf and US housing numbersMarch 25, 2025 at 12:15 pm #21353European shares rise after German business morale improves in March
Baloise gains after results, lifts insurer sectorEnergy stocks track oil prices higher after Venezuela tariffs
German business sentiment rises in March, Ifo survey shows
STOXX 600 up 0.4%
European shares rose on Tuesday after a German survey indicated business sentiment improved in the region’s largest economy, days after a historic debt deal aimed at boosting stagnating growth.
The pan-European STOXX 600 index SXXP was up 0.4% at 0910 GMT. Most regional stocks markets rose, led by a 0.9% gain in Spanish stocks IBC, followed by an 0.8% advance in French shares PX1.
Energy stocks (.SXEP) jumped 1.1% as oil prices firmed for the fifth day on supply concerns after the U.S. announced tariffs on countries that buy Venezuelan crude.
Swiss insurer Baloise BALN advanced 6% to the top of the STOXX 600 after reporting a 60.6% surge in its 2024 profit. The broader insurers index (.SXIP) firmed about 1%.
A survey from Munich-based Ifo Institute showed the business climate index rose to 86.7 in March, in line with economists’ forecast, up from 85.2 the previous month.
Germany’s plans to invest hundreds of billions of euros in defence and infrastructure have led to upgrades for the euro zone economy, contributing to European equities outperforming their U.S. counterparts so far this year.
Investors are also keeping an eye on U.S. trade policy that has roiled global markets.
March 25, 2025 at 12:14 pm #21352March 25, 2025 at 12:07 pm #21351Data and tariff talk lift dollar to three-week high
The dollar ticked up to an almost three-week high on Tuesday after some strong U.S. services data and cautious optimism on the tariff front.
President Donald Trump said not all of his threatened levies would be imposed on April 2 and some countries may get breaks, which helped the mood on Wall Street overnight by soothing some fears about a possible slowdown in U.S growth.
The U.S. dollar index DXY notched a fifth straight session of gains, rising 0.15% to 104.46, its highest since March 5.
Meanwhile the euro EURUSD slipped to $1.0777, around its lowest in three weeks, and was last down 0.1%.
A strong services component in S&P Global’s flash U.S. PMI figures on Monday alongside a rotation back into Wall Street stocks helped push up U.S. bond yields, which supported the dollar.
The dollar has rebounded somewhat after falling to a five-month low in mid-March as Trump’s stop-start tariff campaigns dented company and investor confidence and darkened the outlook for U.S. growth.
The view that tariffs are unambiguously bullish U.S dollar has been challenged by the price action in 2025, and so even when we get the information on what tariffs look like next week, it will be hard to know what we are supposed to do.
March 25, 2025 at 12:02 pm #21350March 25, 2025 at 11:58 am #21349<p style=”text-align: center;”>
 </p>
</p>
US OPENEuropean bourses positive despite lower US futures, DXY veers lower and Crude climbs on Venezuelan tariffs
Good morning USA traders, hope your day is off to a great start!
Here are the top 5 things you need to know for today’s market.
5 Things You Need to Know
US President Trump sanctioned Venezuelan oil. Elsewhere, India has proposed the removal/reduction of tariffs
European bourses defied the lead from futures and opened in the green, US futures in the red but only modestly so and hold onto the bulk of Monday’s gains
DXY steady throughout the morning but most recently at a session low to the benefit of peers across the board, EUR also aided by Ifo
Fixed benchmarks in the red, weighed on by Ifo and supply; USTs await Fed speak
Crude bid in an extension of Monday’s action, TTF softer on Ukraine updates while Gold has inched to fresh highs
<p style=”text-align: center;”>Try Newsquawk for 7 Days Free</p>March 25, 2025 at 11:57 am #21348March 25, 2025 at 11:48 am #21347EURUSD 4h
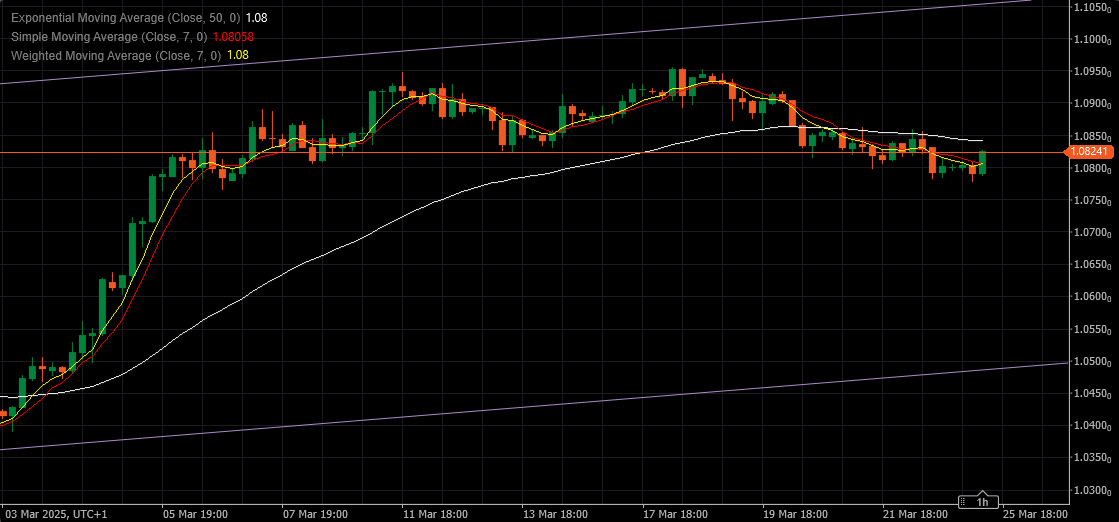
Supports: 1.08100, 1.07950 & 1.07750
Resistances: 1.08300, 1.08550 & 1.08900
Current momentum Up
As long as below 1.08550 daily direction is Down
Looking at 2-3 days period, EUR can spike up to around 1.09200 and then turn down again.
If above 1.09200 targets 1.10850
Personally, I would like to see this correction going all the way to 1.06850 before Up again.
 March 25, 2025 at 11:07 am #21346March 25, 2025 at 10:26 am #21345
In our weekly email, I called this a tricky week with attention looking ahead to next week when there will be month/quarter end (Monday) and reciprocal tariff day (Wednesday). .
Barring any definitive tariff news, this is a week that should be dominated by position adjustmwents (including pre quarter end) rather than aggressive positioning.
Markets seem to be grabbing on to any headline that gives a glimmer of hope on the tariff front.
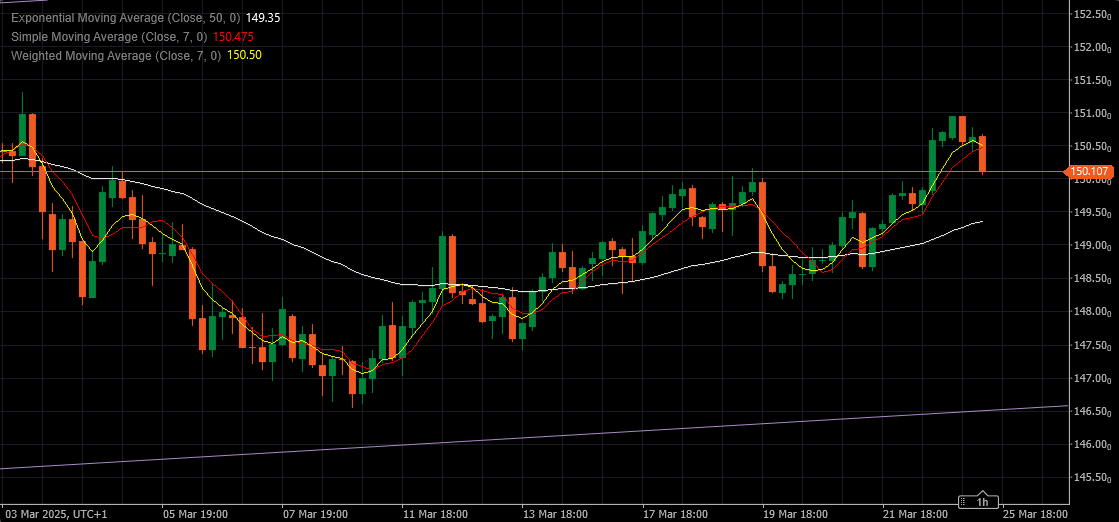
March 25, 2025 at 10:22 am #21343USDJPY 4 HOUR – Chart tells the story
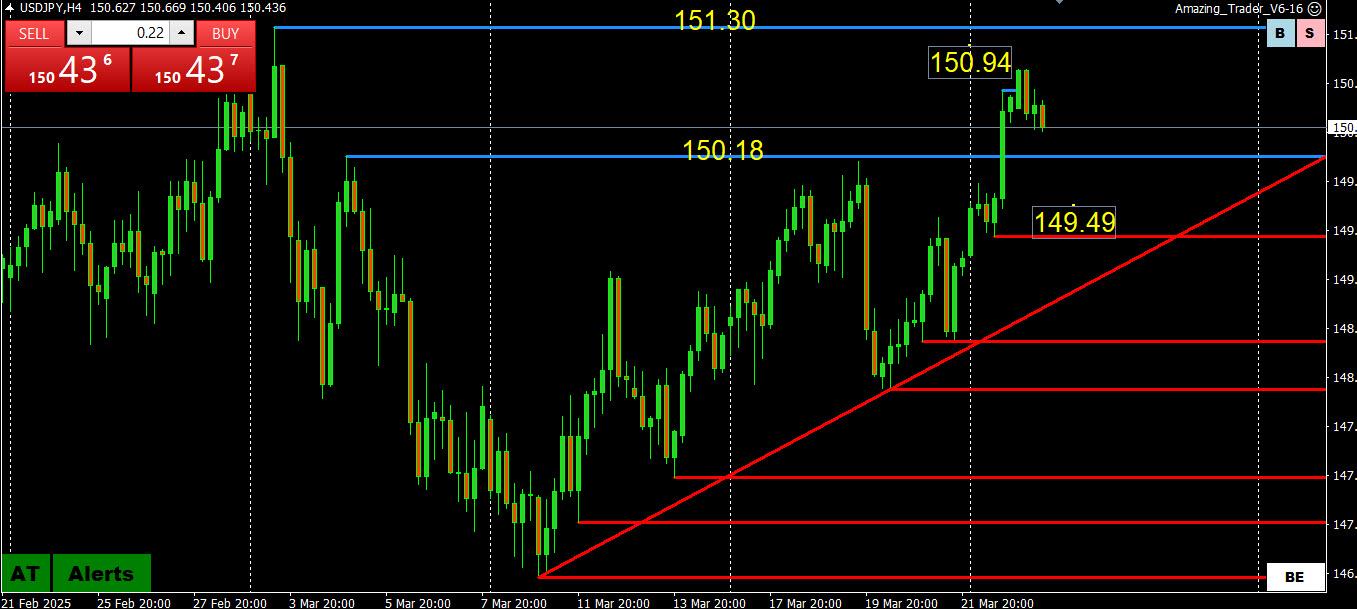
This is one of those days where this chart tells the whole story
Bid while above 150.18 but upside contained unless 151.30 is taken out.
Back below 150.18 would negate yesterday’s mini breakout and shift the range to 149.50-150.00
150 the clear bias setting level going forward.
March 25, 2025 at 9:59 am #21341XAUUSD 4 HOUR CHART – Consolidating
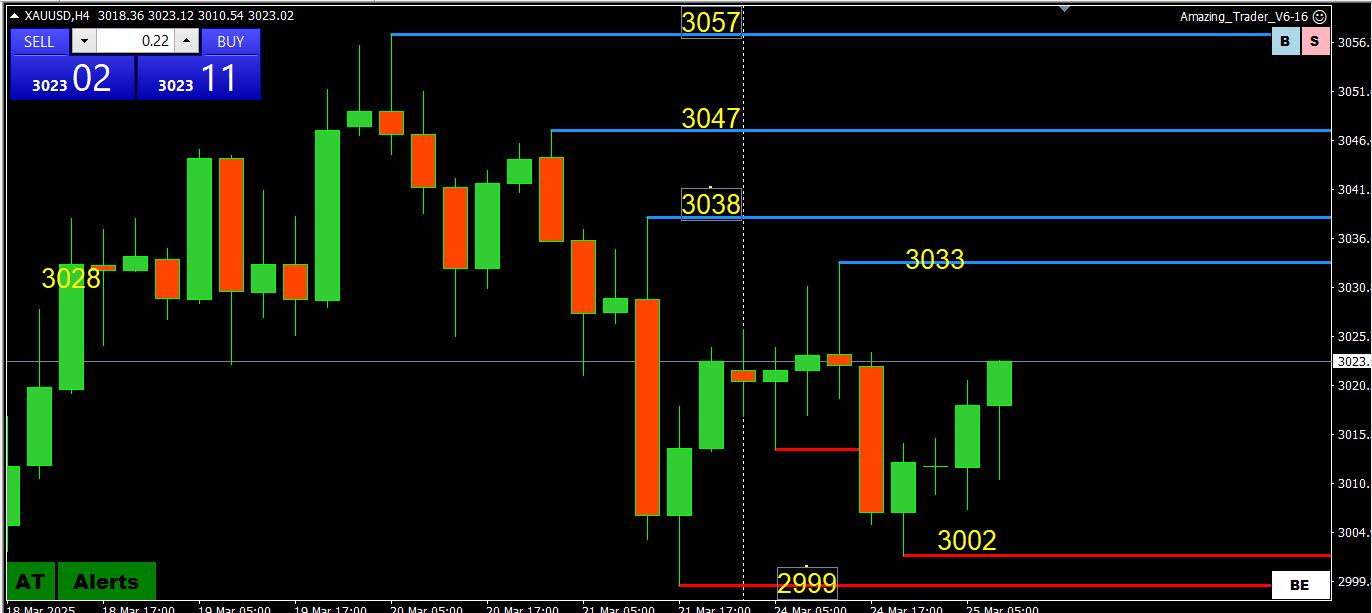
I hate the word consolidating but with that said…
XAUUSD still consolidating between 2999 – 3038, seemingly biding its time for another run up unless 3000 is firmly broken.
Otherwise, break of 3038 would cool lingering retracement risk
Break of 2999 would expose 2978, which is the key level to maintain the daily uptrend. .
March 25, 2025 at 9:37 am #21340Using my platform as a HEARMAP shows
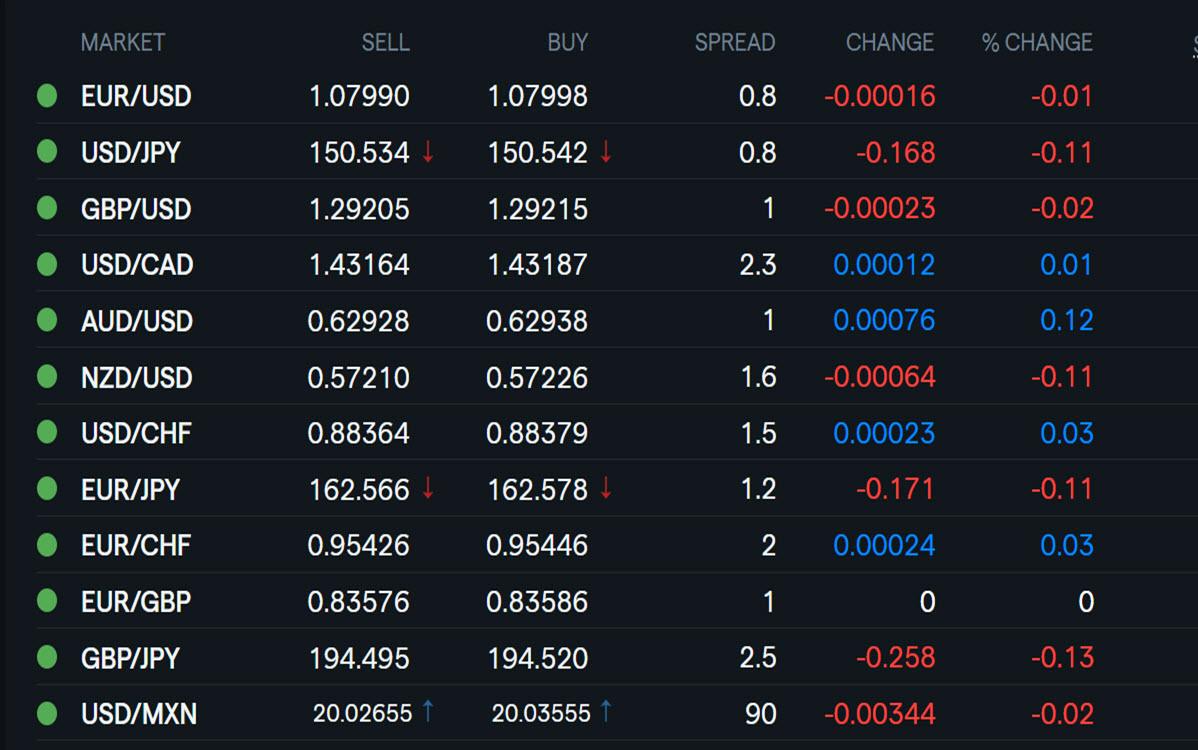
…the dollar trading close to unchanged after briefly extending its rebound overnight.
EURUSD 1.08 is the bias setting level…. what caight my eye is the low (1.0777) poauxed above the 1.0765 ley support/target. .
XAUUSD a touch firmer after holding iff another run at 3000
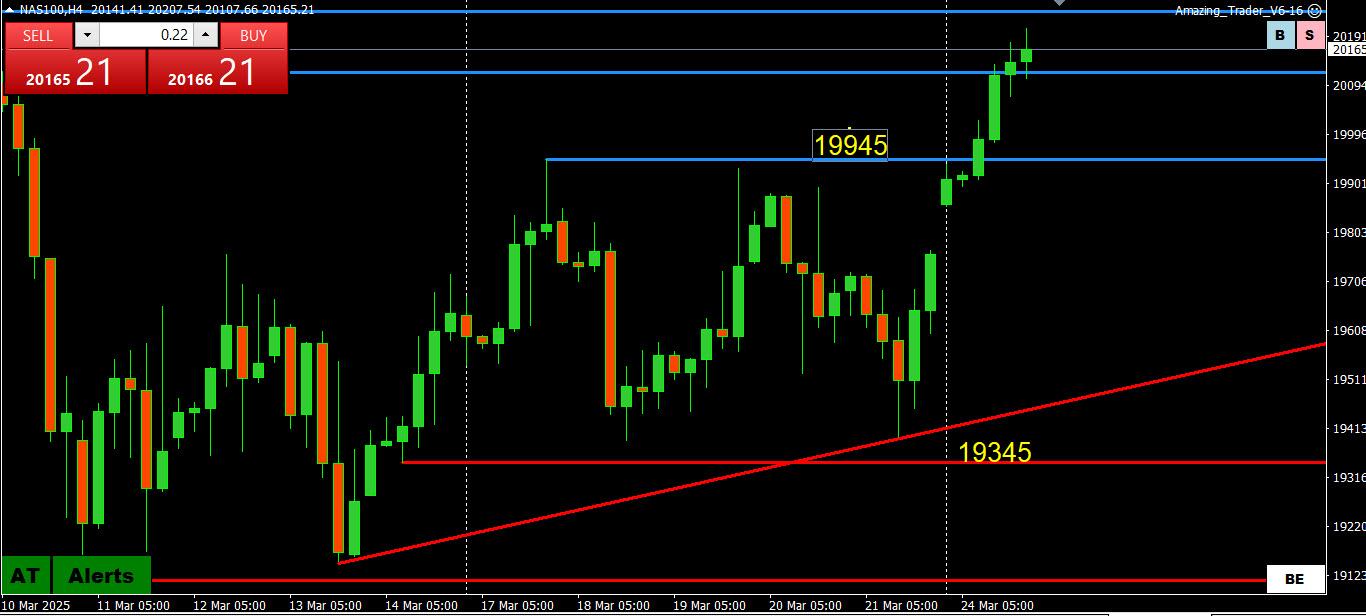
US equities consolidating and so far not following through on yesterday’s rally.
Light news day… headline watch remains on the next Trump tariff comment
March 25, 2025 at 9:02 am #21339Here it is 10am in Nigeria and gold (xau/usd) is looking up. it started from the price 3010.13 which was the lowest point as at yesterday and has slowly climbed up since then. Price is currently at 3021.74 and it is looking up for a further buy to the area at price 3025.91
Gold is a buy metal itself and has since being going long since 1996. I don’t think it is ready to stop buying as i see a further buying pressure. Let us use tight TP/SL and exit at the price 3025.91 as predicted. A 1-5% risk/reward ration of 1:2 should be used. A word is enough for the wise.
Thanks,
TOPNINE.March 25, 2025 at 8:32 am #21338March 25, 2025 at 8:16 am #21337March 25, 2025 at 8:08 am #21336March 25, 2025 at 7:56 am #21335March 25, 2025 at 7:45 am #21334March 24, 2025 at 8:48 pm #21331 -
AuthorPosts



- You must be logged in to reply to this topic.
Search
© 2024 Global View