
-
AuthorSearch Results
-
April 23, 2024 at 5:19 pm #5090
In reply to: Forex Forum
April 23, 2024 at 3:49 pm #5082In reply to: Forex Forum
Thank JP. Side note on pairs, UsdJpy and UsdChf overall upward bias has not been significantly compromised with today’s selling in my view although it got my attention. Expecting further selling on bids above the figures. Us treasury purchases were strong on the data enough to possibly change the picture to risk on, you could see it pre-data. A lot of people are watching the 2yr note auction in a little over an hour from now. Expected to be strong.
April 23, 2024 at 12:02 pm #5057In reply to: Forex Forum
EURJPY 4 HOUR CHART – PATH OF LEAST RESISTANCE
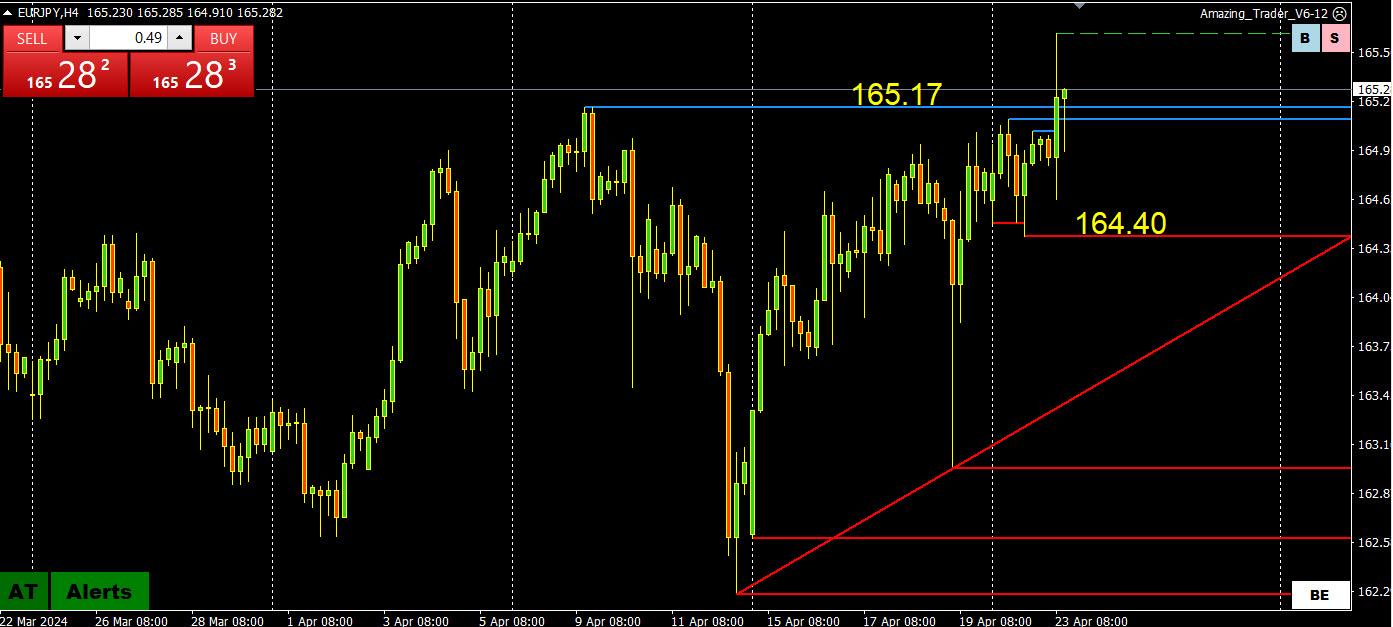
If you want to be short JPY but are worried about intervention (i.e. USDJPY 155), one way to do so is via the crosses, such as buying EURJPY.
Why?
The answer is simple. There is less likely to see intervention in a cross than in USDJPY and why I call it the path of least resistance. .
April 22, 2024 at 5:52 pm #5017In reply to: Forex Forum
AUDJPY 4 HOUR CHART —
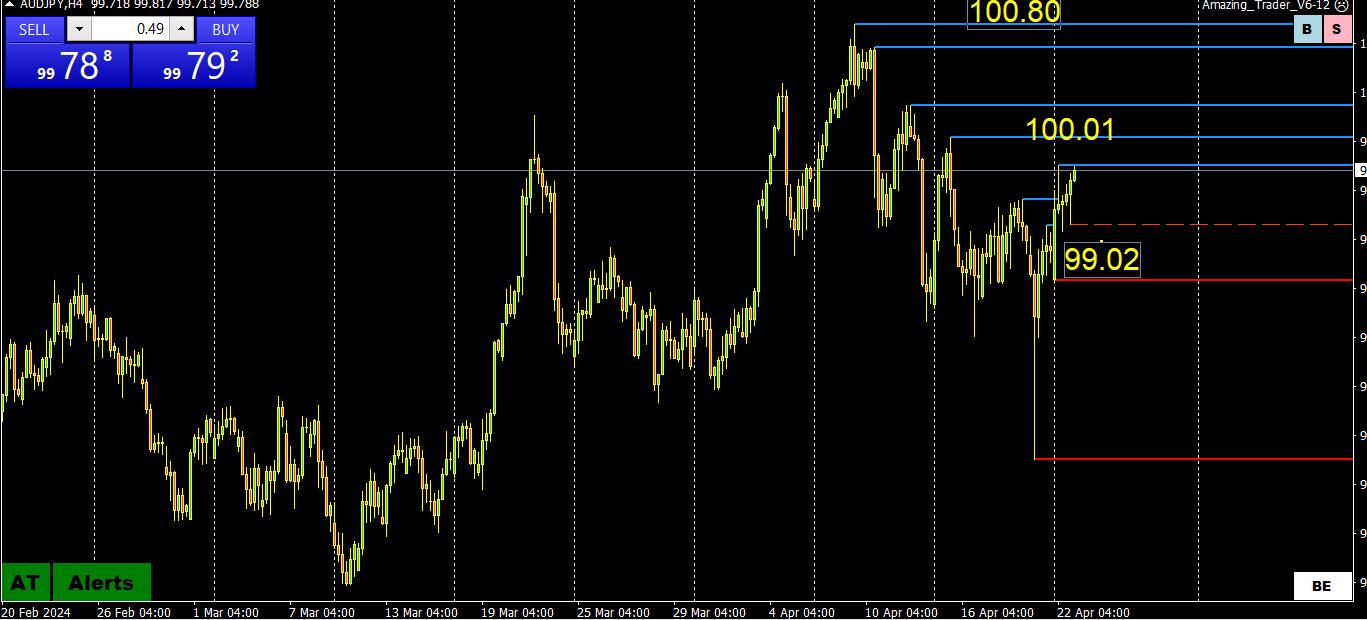
AUDJOY is back in familiar territory after last week’s phantom spike to the downside.
On this chart, expect support as long as it trades above .99.00 but would need to clear 100.01 to put the key 100.80 resistance in play.
Note AUDJPY has moved up mainly on the bounce in AUDUSD while USDJPY has barely moved.
This is an e3xmaple pof using crosses to trade spot and following the path of least resistance with USDJOY still reluctant to challenge 155.
April 22, 2024 at 8:39 am #4982In reply to: Forex Forum
April 21, 2024 at 11:50 pm #4967In reply to: Forex Forum
USDJPY 4 HOUR CHART – Stalemate

This caught my attention
The latest positioning data from U.S. futures markets showed hedge funds and speculators increased their aggregate net short yen position in the latest week to a new 17-year high. (Reuters)
… despite the threat of intervention
As the chart shows, the bottom of the range was extended after a (false) intervention scare while the top end represents a 34-year high.
For Monday, there seems no catalyst for an attack of 155 but will stay on the radar as long as 154+ trades.
April 19, 2024 at 5:51 pm #4913In reply to: Forex Forum
April 19, 2024 at 5:15 pm #4912In reply to: Forex Forum
April 19, 2024 at 3:38 pm #4908In reply to: Forex Forum
For novices in this, here is what it is like to actively get into the volatility I was involved in when UsdChf and UsdJpy so aggressively sold off while globally the same volatility occurred on a massive scale across markets. I sold at the top in both pairs in Asia before it hit. I did very handsomely and got out. I thought it was a consortium of entities intervening and found out quickly after it was the military strike. I hit a retracement and did ok. I hit again but it was near the lows and paid for it on a very significant pull back that is very not normal in scope or speed and coughed up a portion of the gains unnecessarily before going “flat.” Balanced intent matters in such conditions.
April 19, 2024 at 10:58 am #4877In reply to: Forex Forum
Just an observation and not to be cute == because I sold both UsdJpy and UsdChf an hour before the sessions started and was in the thick of battle all the way down to the lows in both – the rebounds in price were aggressive and seemed like plunge protection team and CTA momentum algo’s both at work. I’ve been around it before.
April 18, 2024 at 1:03 pm #4825In reply to: Forex Forum
USDJPY 4 HOUR CHART – TRAPPED FOR NOW

With Japan (and S Korea) discussing the strong dollar with the US, the intervention threat stays on the table. This suggests tacit approval should Japan choose to intervene on its own.
However, given the fundamentals (i.e. interest rates) and a generally strong USD, intervention would likely be a questionable strategy and seen as a stopgap.
With that said, it pays to be on alert after the IMF/World Bank meetings end.
Lookjing at the chart, the current range is 153.87-154.77 but 155 is clearly the market line in the sand,
April 17, 2024 at 4:39 pm #4778In reply to: Forex Forum
April 17, 2024 at 2:24 pm #4755In reply to: Forex Forum
GV – was watching exactly what you point out. I’m looking to sell Sterling if it gets close to 125 but so far yes you could see the yield holding and the reaction. I’m mainly active in AudCad and EurJpy and with the right areas seen UsdJpy. I know you really don’t like UsdChf but I like the thought of trailing it waiting for a middle east shock, I don’t believe they strike until tomorrow NY time.
April 17, 2024 at 7:56 am #4721In reply to: Forex Forum
April 16, 2024 at 5:20 pm #4703In reply to: Forex Forum
April 16, 2024 at 3:03 pm #4692In reply to: Forex Forum
April 16, 2024 at 3:00 pm #4691In reply to: Forex Forum
April 16, 2024 at 2:43 pm #4688In reply to: Forex Forum
April 16, 2024 at 10:33 am #4657In reply to: Forex Forum
USDJPY 1 HOUR CHART =Another 34-year high

As noted here yesterday, 154.-155 is a sticky zone with the top end as a pivotal level and potential BoJ line in the sand.
So far the market is showing no fear of the BoJ and is again taking the path of least resistance by selling JPY on its crosses (e.g. EURJPY, GBPJPY) where the BpK is less likely to intervene,
For intra-day traders, look for the “50” level (154.50) to be pivotal in the days ahead in determining whther the market goes after 155.
April 15, 2024 at 2:11 pm #4615In reply to: Forex Forum
April 15, 2024 at 10:23 am #4598In reply to: Forex Forum
USDJPY 30 MINUTE CHART- UNCHARTERED WATERS

USDJPY TRADING TO ANOTHER 34-YEAR HIGH JUST BELOW 154… AS I NOTED ON THE BREAK OF 152, THE NEXT POTENTIAL BOJLINE IN THE SAND WAS 155. THIS SUGGESTS 154-155, SHOULD IT TRADE, WOULD BE A NERVOUS ZONE
NOTE JPY WEAKNESS ON ITS CROSSES GIVING A BOD TO USDJPY.
USDJPY LIKELY KEEPS ITS BID IF IT CAN STAY ABOVE 153.50 (NOT SHOWN ON THIS CHART)
April 12, 2024 at 2:14 pm #4479In reply to: Forex Forum
April 10, 2024 at 6:18 pm #4358In reply to: Forex Forum
USDJPY DAILY CHART – Who’s afraid of the BoJ?

With the 151.97 line in the sand shattered, USDJPY is trading, not close to record but in unchartered waters. This leaves Japanese monetary authorities with nothing but verbal warnings for if they choose to intervene, there would be more than ample buyers lying in wait at lower levels.
This leaves the market wondering where the next line in the sand is. The obvious level is 155 but ahead of that is 153.50, midpoint of 152-155. On the downside, only back below 151.97-00 would slow the risk.
April 9, 2024 at 1:04 am #4232In reply to: Forex Forum
WITH USDJPY HOVERING JUST BELOW 151.97 IT IS WORTH READING THIS BLOG ARTICLE AS IT IS STILL VALID

Trader Alert: Would I Intervene in USDJPY If I Was in I was in the BoJ’s Shoes?
April 8, 2024 at 1:27 pm #4201In reply to: Forex Forum
April 8, 2024 at 11:21 am #4192In reply to: Forex Forum
USDJPY 1 HOUR – BID BUT WARY OF INTERVENTION

All that matters in USDJPY is the 151.97 (suggests 152) and what night trigger intervention. It certainly isn’t a disorderly market in current conditions that would trigger intervention so it would have to be a level that is considered the point of pain.
Rising US bond yields (4.45% 10-year yield so far capping it) would normally see USDJPY if it wasn’t for the intervention threat.
Looking at this chart, there are layers of support all the way to 150.80 under normal conditions.
April 8, 2024 at 8:24 am #4187In reply to: Forex Forum
April 5, 2024 at 3:17 pm #4108In reply to: Forex Forum
April 5, 2024 at 2:45 pm #4102In reply to: Forex Forum
April 4, 2024 at 9:27 pm #4046In reply to: Forex Forum
-
AuthorSearch Results


Search
© 2024 Global View