
-
AuthorSearch Results
-
February 29, 2024 at 3:15 pm #2261
In reply to: Forex Forum
February 29, 2024 at 10:50 am #2237In reply to: Forex Forum
USDJPY 30 Min Chart – Invisible hand 1, Market 0

Having failed to take out the invisible hand protecting 150.89 (double top at 159.84) left the market vulnerable to the BoJ yak on interest rate risk
So, far the move down paused above the 149.53 bottom of the range, leaving the focus on 150 to set the trading tone.
Expect more chop if it stays within 149.53 and 150.84/89)
February 29, 2024 at 8:57 am #2227In reply to: Forex Forum
February 28, 2024 at 3:53 pm #2184In reply to: Forex Forum
IEURJPY 30-minute chart – risk turns up

Simple algebra: EURUSD X USDJPY = EURJPY (Hint: One reason for the EURUSD bounce from 1.08)
Chart:
Two red lines drawn off the bottom showed a shift in directional risk to up
So far, pause just below 163.39
Recent and key resistance is at 163.72
Go to shorter time frames for intra-day supports
February 28, 2024 at 1:51 pm #2169In reply to: Forex Forum
February 28, 2024 at 2:20 am #2139In reply to: Forex Forum
USDJPY Analysis: Consolidation Continues, Key Levels to Watch
The USDJPY pair has failed in its attempt to break above the 150.88 resistance level and remains within a trading range between 149.52 and 150.88.

Nevertheless, as long as the 149.52 support level holds, the sideways movement could be viewed as consolidation for the uptrend from 145.89. A breakout above the 150.88 resistance level could potentially trigger another rise towards the 151.90 resistance level.
The critical support level to monitor is at 149.52. A breakdown below this level would suggest that the upside move has concluded at 150.88. In such a scenario, the pair could find support around the 148.80 area.
February 27, 2024 at 3:36 pm #2126In reply to: Forex Forum
February 27, 2024 at 2:54 pm #2118In reply to: Forex Forum
February 27, 2024 at 10:07 am #2090In reply to: Forex Forum
USDJPY 1-Hour Chart

Blue lines dominating, indicating some shift in risk to the downside or more of a two-sided market after another failure to take out 150.89
However, price action remains contained while within 149.53 and 150.89 where 150 should continue to set the bias
Supports on either side of 150: 149.93-150.01-150.12
150.54 needs to hold on top to keep the focus on 150 and away from 150.84-89
Why did USDJPY fall today?
Technicians will cite another failed run at 150.89 and market positioning that is heavily short JPY, both vs. the USD and on its crosses
Those who say news matters will cite the release of a smaller-than-expected fall in annual Japanese inflation in a market that is hypersensitive to any data that might prompt the BoJ to raise interest rates.,
February 26, 2024 at 2:40 am #2033In reply to: Forex Forum
USDJPY: Stuck in Limbo – Uptrend Consolidation or Downturn Signal?
USDJPY has been stuck in neutral territory, oscillating within a trading range between 149.52 and 150.88. This sideways movement leaves the near-term direction unclear, prompting questions about whether it’s a pause within the uptrend or a sign of a potential reversal. Let’s delve into the key support and resistance levels to understand the possible scenarios.

Uptrend on Hold? Sideways Consolidation as a Signal
149.52 Support: The Bullish Anchor: As long as the price remains above this crucial support level, the uptrend initiated at 145.89 remains valid. This suggests the current sideways movement could be a healthy consolidation phase within the ongoing uptrend.
Breakout Potential: If the bulls manage to accumulate enough strength and push the price above the 150.88 resistance level, it could signal a breakout from the range and trigger a further rise towards the 151.90 resistance, potentially solidifying the uptrend.Downturn Signals: Watching the Support Crack
149.52 Breach: A Reversal Indicator: A breakdown below the 149.52 support level would be a significant development, potentially indicating a completion of the uptrend from 145.89. This could lead to a decline towards the next support zone around 148.80, marking a potential trend reversal.
Overall Sentiment:
The current technical picture for USDJPY presents conflicting signals. The sideways movement creates uncertainty, leaving the near-term direction unclear. While holding above 149.52 and breaking above 150.88 suggest potential bullish continuation, a breakdown below support could signal a trend reversal and further decline. Monitoring the price action around the mentioned support and resistance levels will be crucial in determining the pair’s next move.
Disclaimer: This analysis is for informational purposes only and should not be considered as investment advice. Please conduct your own research before making any trading decisions.
February 24, 2024 at 12:37 pm #2008In reply to: Forex Forum
USDJPY Weekly Outlook
Supports at 149.800 and 148.650
Resistance 152.000
There is not much to say about this pair, except that Pattern wise it is destined to try 152.000 area.
Problem comes from the fact that we have already double top in place, and if rejected for the third time, it will be not only technically visible, but would mean that BOJ decided to put Money where their Mouth is.
We can always see sharp drops in JPY , followed by even sharper ascent . But any possible drop below 145.000 and consequently 143.300 would put the whole Up trend in question.
 February 23, 2024 at 6:30 pm #2000
In reply to: Forex Forum

USDJPY 15 minute chart
Similar to others, USDJOY is ending the week with a whimper but getting a reprieve from the dip in US bond yields
Wise rRngw `149.53-150.89
I wouldn’t be surprised to learn the BoJ has been covertly intervening as it has been rumored for years to do so via surrogates.
Whatever the case, 150 remains the ultimate bias-setting level
February 23, 2024 at 11:16 am #1978In reply to: Forex Forum
February 22, 2024 at 7:20 pm #1966In reply to: Forex Forum

USDJPY 4-Hour Chart: Key resistance looms
Looking at this chart USDJPY has been in a 149.53-150.89 range for nearly 2 weeks
With rising red lines, momentum is swinging upwards but faces the key resistance level (recent high) at 150.89
A move through 150.89 would leave little until the major 151.90 level
Expect support on dips as long as 150+ trades
Beware as always of verbal intervention with the major level looming above..
February 22, 2024 at 5:14 pm #1959In reply to: Forex Forum
USDJPY
With bond yields edging up and BoJ dragging its feet there are probably a lot of carry trades being put on
With Nikkei soaring to record highs, there seems no rush for the BoJ unless it wants to replace verbal intervention with a rate hike hint risk comment.
Markets will soon start looking ahead to a hot PCE inflation release next week, which is also on month end.
February 22, 2024 at 3:29 am #1900In reply to: Forex Forum
USDJPY Analysis: Sideways Movement Continues, Resistance and Support Levels
The USDJPY pair has attempted to break below the 149.52 support level but failed and has since moved sideways within a trading range between 149.52 and 150.88.

As long as the 149.52 support level holds, the sideways movement could be seen as consolidation for the uptrend from 145.89. A breakthrough of the 150.88 resistance level could trigger another rise towards the 151.90 resistance level.
On the other hand, a breakdown below the 149.52 support level would indicate that the upside move from 145.89 has already completed at 150.88. In this case, the pair would find support around the 147.50 area.
February 21, 2024 at 9:07 am #1836In reply to: Forex Forum
February 19, 2024 at 1:57 pm #1760In reply to: Forex Forum

USDJPY 4 Hour Chart – Uptrend consolidating
150.00 is the bias-setting level going forward.
4-hour Levels are very clear
Sup: 148.92/149.52/149.82
Res: 140.65/150.88
Note, USDJPY tends to be most sensitive currency to moves in US bond yields
Scross down the forum to see USDJPY analysis from ForexCycle
February 19, 2024 at 2:52 am #1745In reply to: Forex Forum
USDJPY Analysis: Uptrend Continues, Resistance and Support Levels

The USDJPY pair is currently within a rising price channel on the 4-hour chart, indicating that the pair remains in an uptrend from 145.89.
As long as the channel support holds, the upside move is likely to continue. A breakthrough of the 150.88 resistance level could potentially take the price towards the 151.90 resistance level.
On the downside, a breakdown below the channel support could bring the price to test the 149.52 support level. If the price breaks below this level, it would indicate that the upside move has already completed at 150.88, and the next downside target would be around the 147.50 area.
February 18, 2024 at 10:49 am #1723In reply to: Forex Forum
USDJPY – Week Ahead
Yen is losing it’s ground last 7 weeks, with some sudden waves of strength here and there, mainly coming from Japanese officials blubber (seems to me that they just want to keep it steady and slow – the decline) .
Resistances at: 150.900, 151.950 and target one in 154.000 area.
Supports at : 150.100, 149.900, 148.800 and the last one at 148.450
Major levels of interest right now are Supp 149.900 and Res 150.900
Not much data in coming week, but check it always in Economic Calendar
 February 16, 2024 at 4:57 pm #1685
In reply to: Forex Forum
EURJPY Daily Chart

Testing res at 161.86
Question is can EURJPY make a run at…
Key res 163.71 and 164.30
To do so, either USDJPY would need to move sharply higher, EURUSD would need to move sharply higher, a combination of the two or EURUSD would need to lag a sharp move up in USDJPY. It’s simple algebra.
Whatever the case, given broader USD trends, it would probably take JPY weakness for the key EURJPY resistance to come into play.
February 15, 2024 at 7:09 pm #1653In reply to: Forex Forum
USDJPY

To be able to continue to the new highs , Yen has to close above 150.200 tonight ( any close above 150.000 awakens the attention )
Otherwise, the risk is to the downside, with the first support at 149.550, followed by 148.500
It might all come to the USA Data tomorrow– Economic Calendar
February 15, 2024 at 4:05 pm #1646In reply to: Forex Forum
February 15, 2024 at 10:00 am #1621In reply to: Forex Forum
USDJPY 1-hour chart

JPY is the strongest currency today.
After the sharp spike on US CPI, USDJPY is currently retracing.
With no supports (red lines) until 149.23,
FIBO levels: Check out our Fibonnaci calculator
50% = 150.055 (broken)
61.8% = 149.86
76.4% = 149.58
So, as long as 149,86 holds, the focus stays on 150, which will dictate the tone for this pair.
February 12, 2024 at 10:35 pm #1526In reply to: Forex Forum
USDJPY Day ahead
Yen has to stay above 149.200 overnight, to be able to continue straight up. However, if loses it, support at 149.050 might give up this time and allow for a greater correction to 148.500 area.
Major support is at 147.850
If support at 149.200 holds it’s ground, it will lead the pair straight to 150.200
 February 12, 2024 at 3:22 pm #1498
In reply to: Forex Forum
February 12, 2024 at 12:48 pm #1478In reply to: Forex Forum
February 12, 2024 at 11:05 am #1472In reply to: Forex Forum
February 11, 2024 at 9:52 pm #1462In reply to: Forex Forum
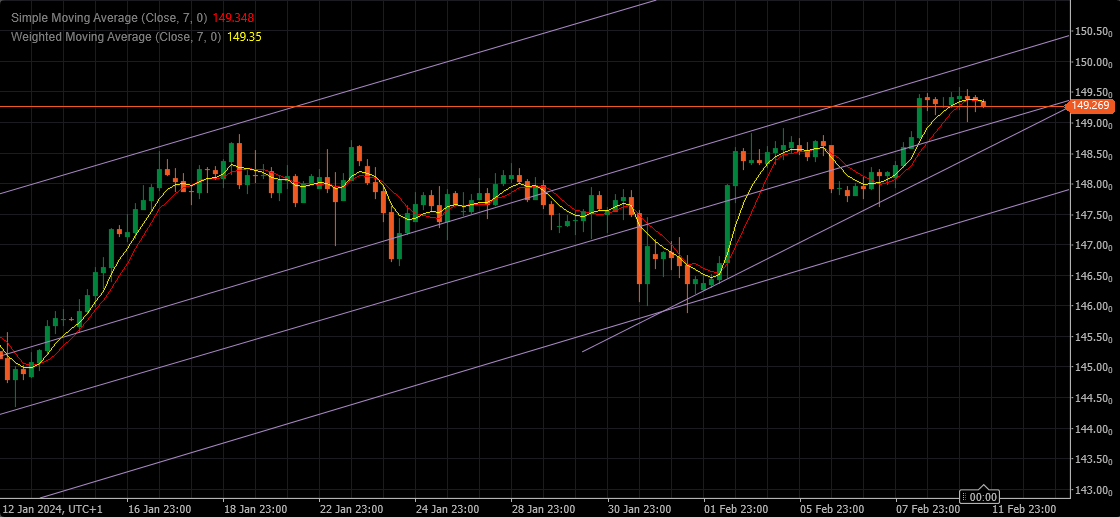
USDJPY Day ahead :
Resistances at : 149.350, 149.600, 150.050 and the target at 152.650
Supports at : 148.950, 148.600 and 147.600
Yen is on the losing streak , as you would expect. It is very bullish on both – Daily and Weekly chart. If you have really traded Yen, you know that it can have some crazy drops , just to come back up with the vengeance.
Buying it at the current rate is a bit problematic, as any reasonable and useful stop would be at a minimum 30 pips away . Best scenario would be to see some retracement over night , and to be able to pick it up around the steep trend line at 148.600. But…it is up to you and your style….I said at least three million times in past the famous sentence : FFS, I should have bought it 😀
 February 9, 2024 at 5:23 pm #1420
In reply to: Forex Forum
-
AuthorSearch Results


Search
© 2024 Global View