
-
AuthorSearch Results
-
March 20, 2024 at 3:42 pm #3351
In reply to: Forex Forum
March 20, 2024 at 3:23 pm #3349In reply to: Forex Forum
March 20, 2024 at 2:50 pm #3343In reply to: Forex Forum
USDJPY WEEKLY CHART – Major RResistance In Sight
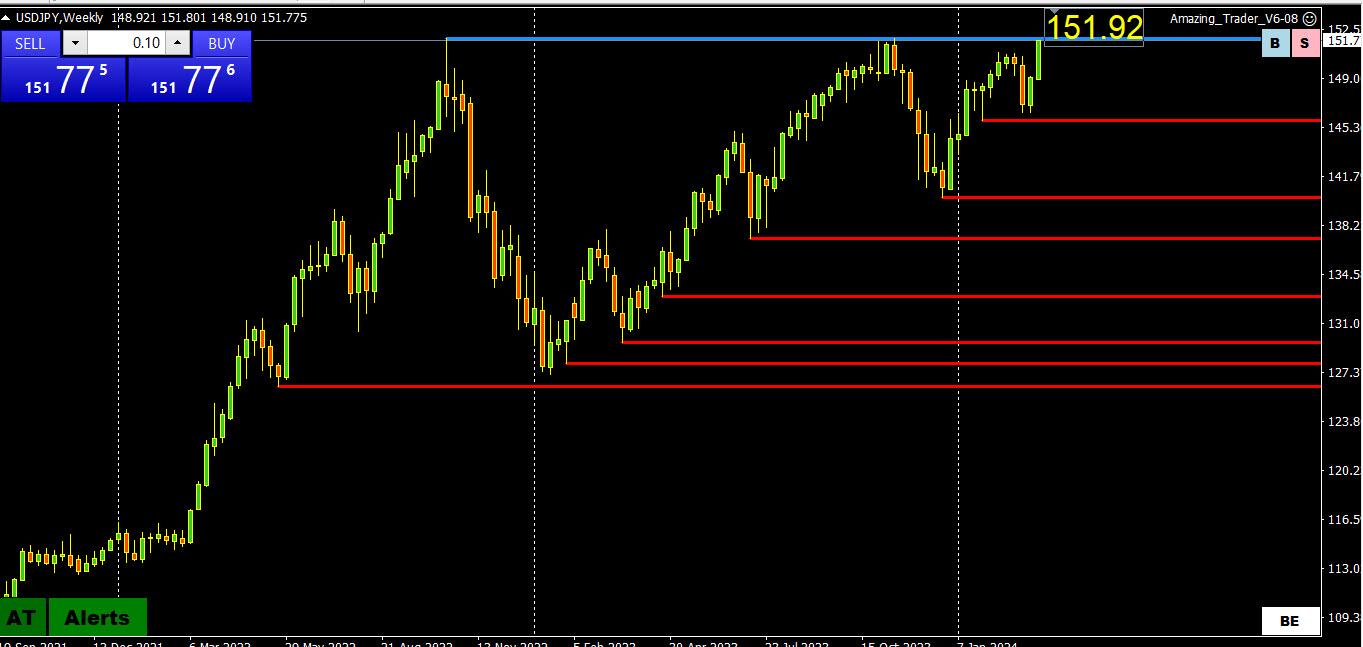
There is only one level worth noting in USDJPY, the major resistance at 151.92
A break above this level would leave a blank on charts so use magic levels (152, 155, etc) as potential targets.
So it is a case of boom or bust at 151.92. If I were in the BoJ’s shoes, I would have 2 choices: defend 151.92 or let it run through 152 and then come in covertly to smack it back down but its shoes are too big for me to fill.
Whatever the case, watch 152 as this will dictate whether there is a run at 153.50 and 155.00 or form a range to 150.00.
March 20, 2024 at 11:23 am #3330In reply to: Forex Forum
March 20, 2024 at 10:35 am #3327In reply to: Forex Forum
EURJPY DAILY CHART
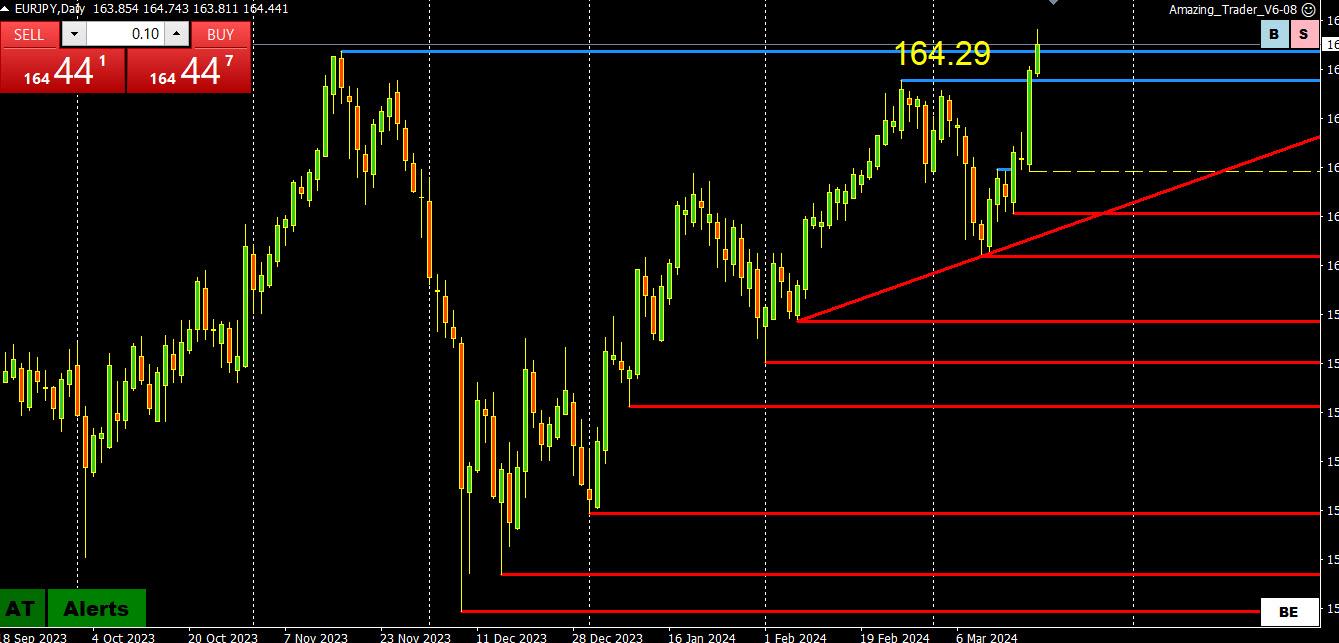
EURJPY is currently an outperformer, following the “path of least resistance:, trading above its major resistance at 164.29. This leaves the next target as guesswork (165 is one of those magic levels). Back below 164.29, at a minimum, would be needed to slow the move up.
Much might depend on whether USDJPY can trade similarly by taking out its major resistance at 151.92.
So far, offsets out of this cross are helping to keep EURUSD above its supports (see prior posts).
March 20, 2024 at 4:48 am #3320In reply to: Forex Forum
USDJPY Analysis: Breakout and Potential for Further Upside Movement
USDJPY has successfully surpassed the 150.88 resistance level, with the upward movement from 146.47 extending to a peak of 151.33.
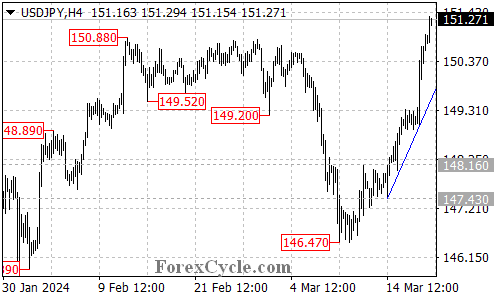
As long as the price remains above the ascending trend line on the 4-hour chart, there is still potential for additional upward movement in the upcoming days, with the next target estimated around 160.00.
The initial support level to monitor is at 150.35. If the price breaks below this level, it could suggest a period of consolidation for the uptrend starting from 146.47, with the pair likely finding support at the rising trend line.
A decisive break below the support provided by the trend line could indicate the potential completion of the current uptrend.
March 19, 2024 at 5:09 pm #3300In reply to: Forex Forum
March 19, 2024 at 3:09 pm #3287In reply to: Forex Forum
March 19, 2024 at 2:56 pm #3281In reply to: Forex Forum
USDJPY 15 Minute Chart – Is the BoJ lurking?
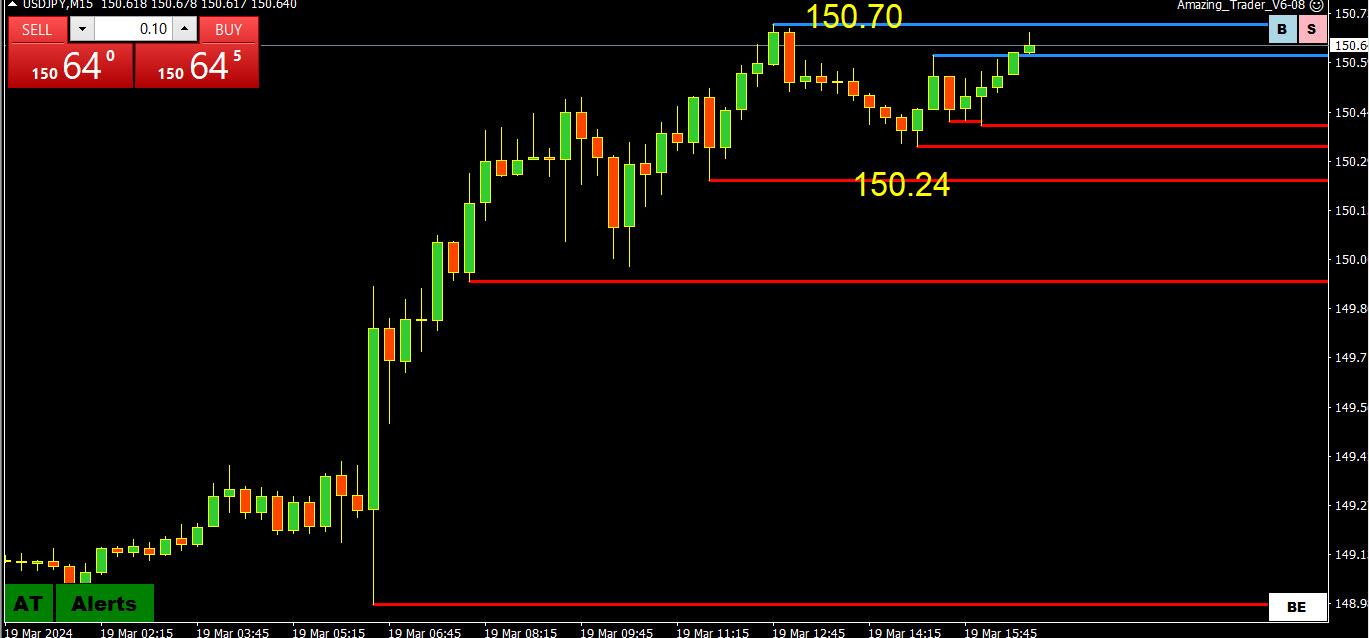
Just to show you there is a method to my madness when I follow the AT lines
As noted in my earlier post, key levels are at 150.24 and 150.85 (seen on a 4-hour chart) and USDJPY is trading within this range but upper end is exposed while above 150.50
Currently, an invisible hand seems to be back protecting 150.85, at least for now
March 19, 2024 at 11:03 am #3259In reply to: Forex Forum
 USDJPY 4 Hour Chart
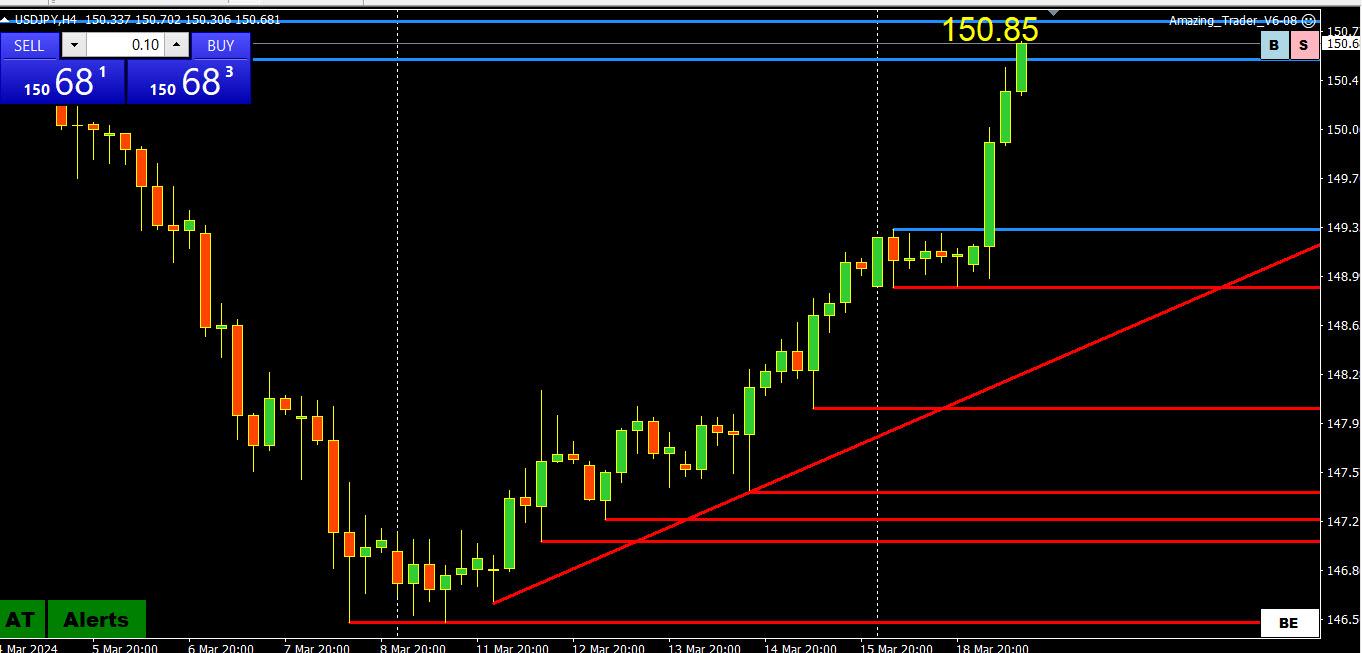
BoJ’s decision to hike rates and end the era of negative interest rates was not a surprise. Indications of a go-slow approach make this a dovish hike and the JPY has responded accordingly.’
USDJPY targeting 150.85 if it can stay above 150.24-50, with a stronger risk if above 150.57.
If I was in the BoJ’s shoes I would be lurking above 150.50 but only to smooth the move and prevent a full rout by defending 150.85(?).
Note prior USDJPY uodate was deleted in error.
March 18, 2024 at 9:42 pm #3234In reply to: Forex Forum
March 18, 2024 at 9:36 pm #3232In reply to: Forex Forum
March 18, 2024 at 11:02 am #3152In reply to: Forex Forum
USDJPY 4 HOUR CHART
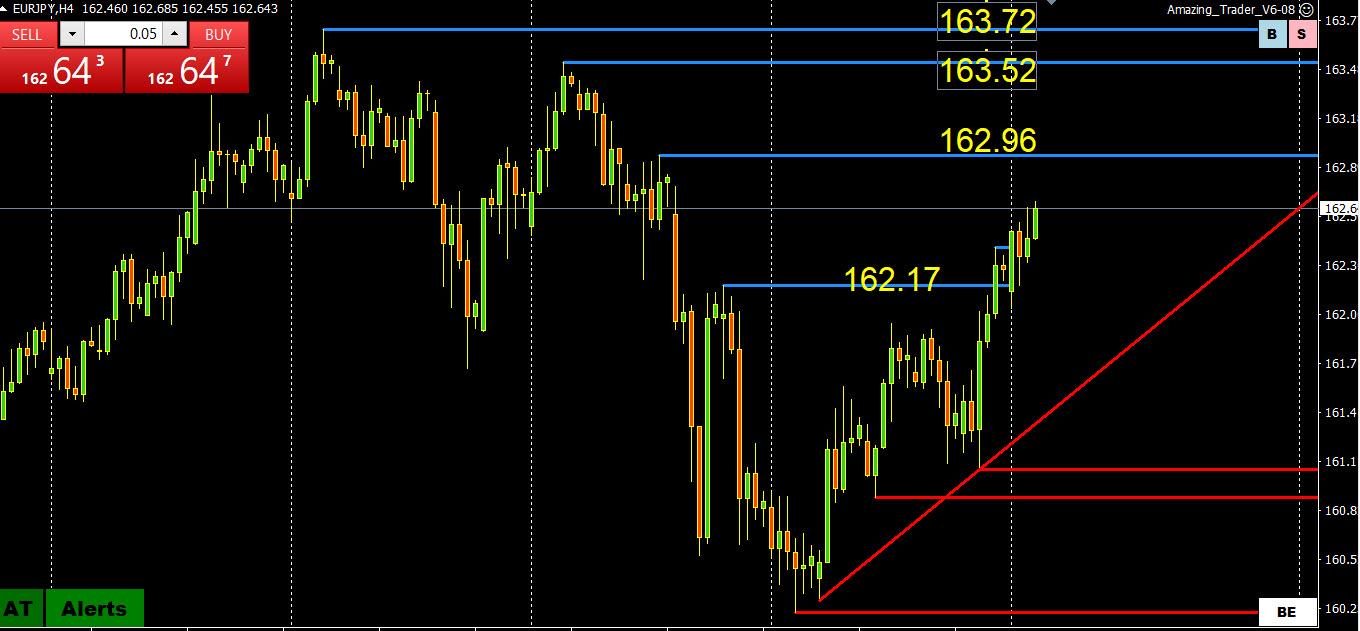
The key flow giving EURUSD support is a firmer EURJPY ahead of the BoJ decision early Tuesday.
If you want to sell JPY and not force the BoJ to intervene, one way is to follow the path of least resistance, which is on its crosses.
The chart shows 3 levels of resistance above the market and on the downside, needing to hold the 162.17 level to keep a bid.
As SF Monege pointed out. the prudent approach is to step back and let the dust settle on the BoJ decision as all that is certain is that there should be volatility following it.
March 17, 2024 at 2:37 pm #3137In reply to: Forex Forum
March 16, 2024 at 3:09 pm #3114In reply to: Forex Forum
USDJPY 4 HOUR CHART
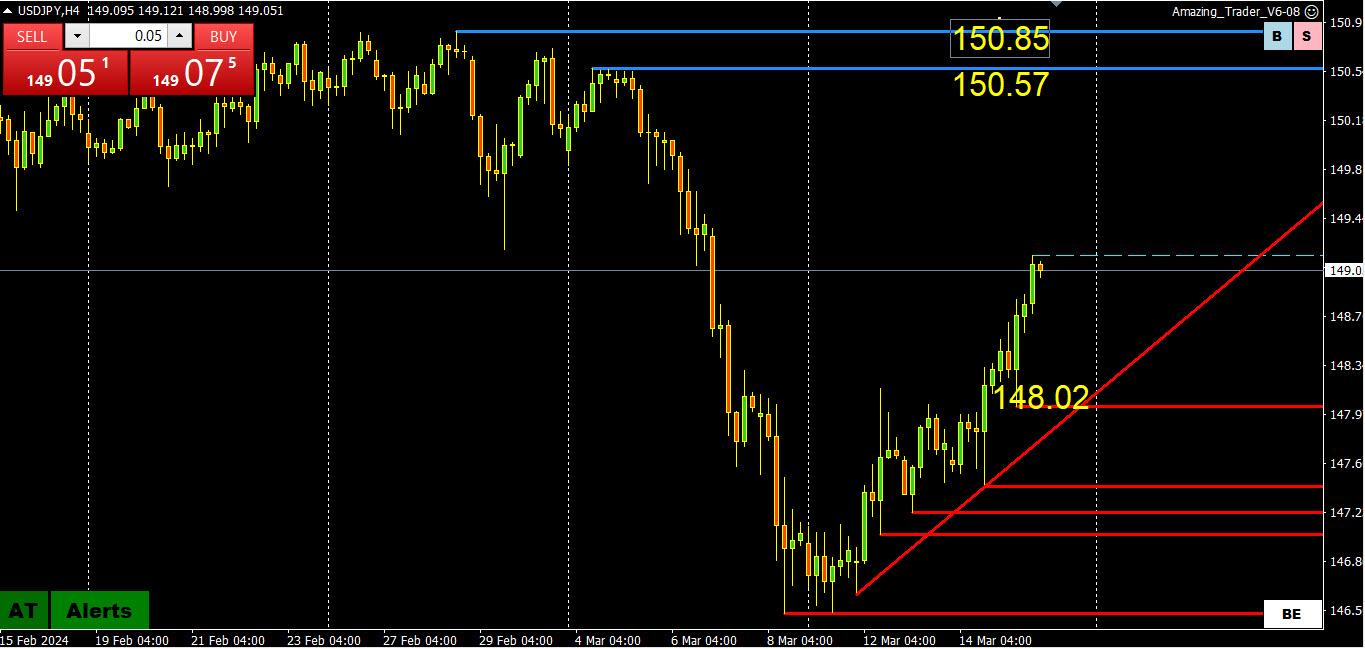
THE FOCUS TO START THE WEEK WILL BE ON USDJPY AND JJPYCROSSES AHEAD OF THE BOJ MARCH 19 DECISION.
The only levels that really matter are 148 and 150 as key levels lie outside of it although 148.03 (and the trendline) are key supports on this chart (suggests 149 as the midpoint)
There are several articles on the BoJ and JPT in our new and outstanding blog
March 15, 2024 at 10:45 am #3050In reply to: Forex Forum
USDJPY 4 HOUR CHART
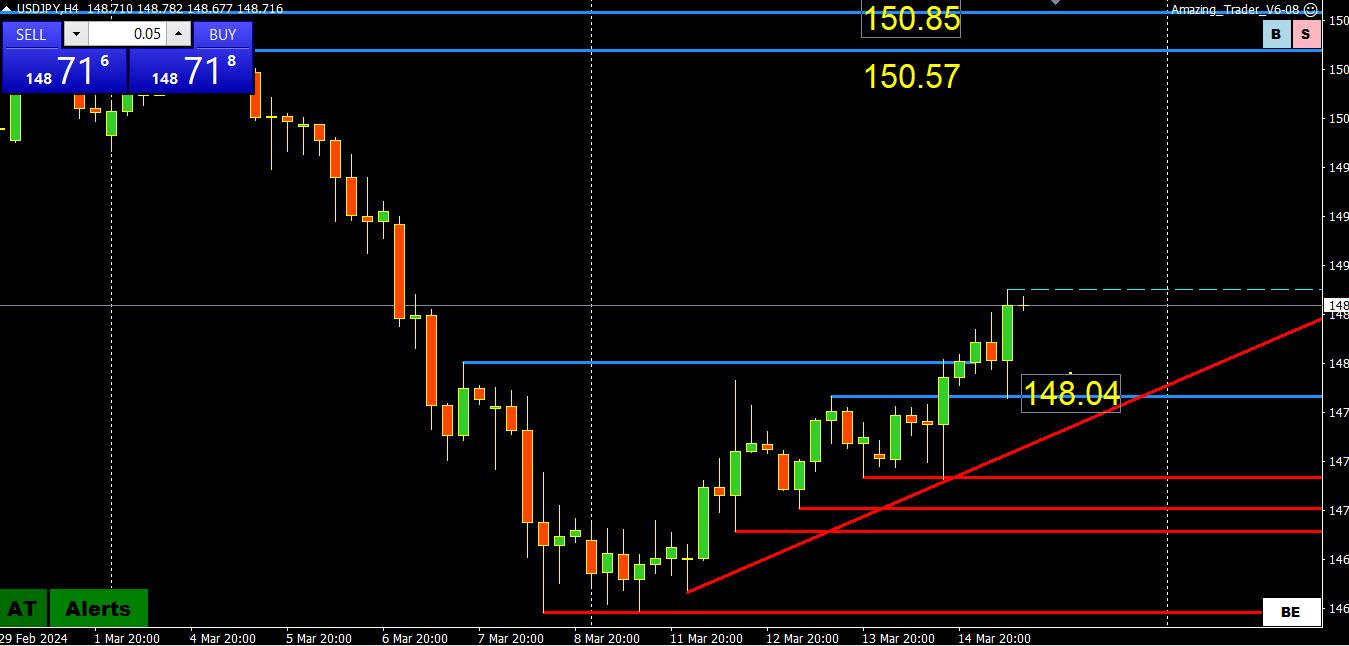
Some pre-BoJ meeting cold feet have JPY trading weaker
Offsets out of EURJPY buying are helping so far to keep EURUSD above 1.0867 (see post below)
Rising red AT lines show risk to the upside as long as it stays above 148.00-04 but…
Major resistance is not until the upper 150+ so not close to key levels.
March 15, 2024 at 12:07 am #3040In reply to: Forex Forum
March 14, 2024 at 6:01 pm #3027In reply to: Forex Forum
USDJPY 4 HOUR CHART
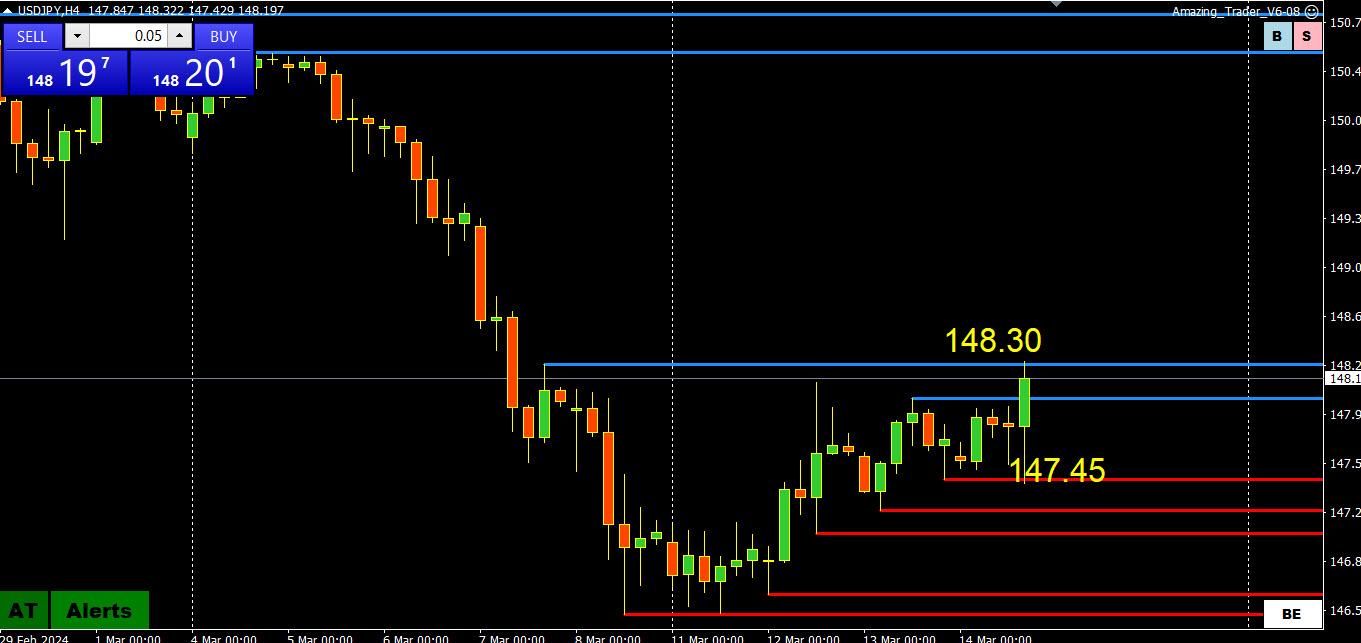
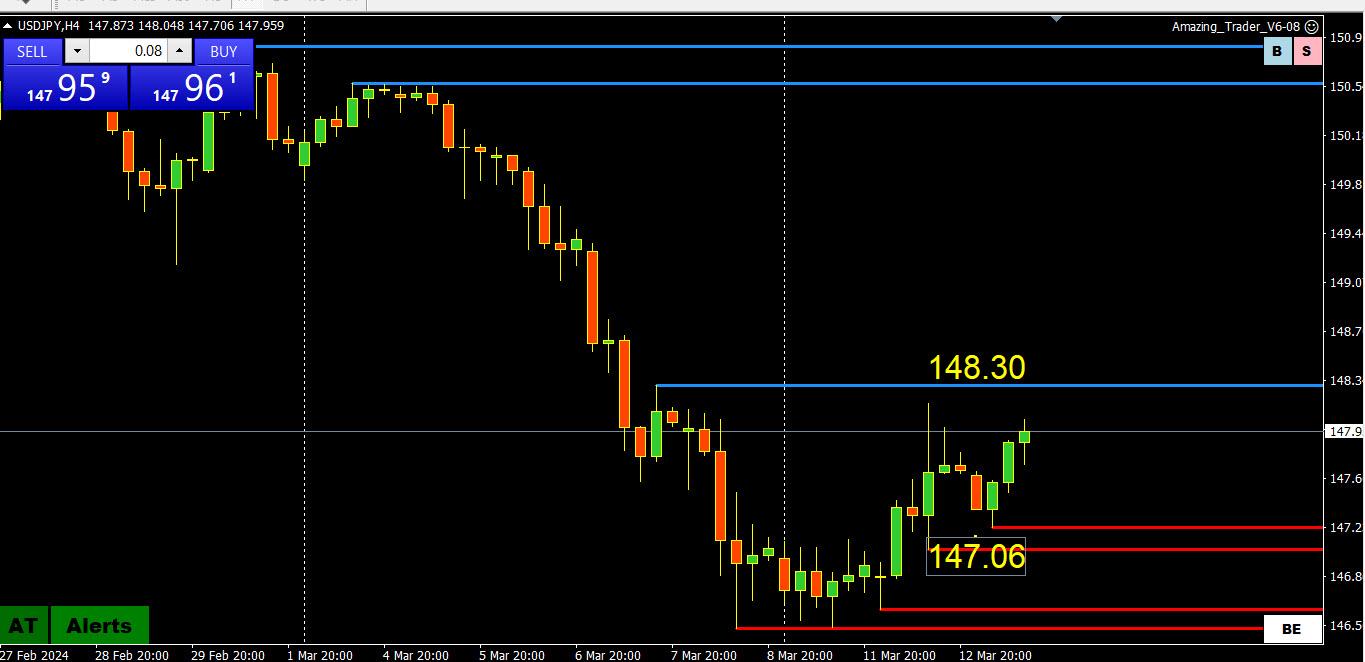
Key levels are obvious
148.30 resistance (void above it)
148 sets the biasUSDJPY finding support despite the risk of the long-awaited rate hike next week, neutralized by higher US bond yields.
March 13, 2024 at 2:52 pm #2943In reply to: Forex Forum
USDJPY 15 MIN CHART
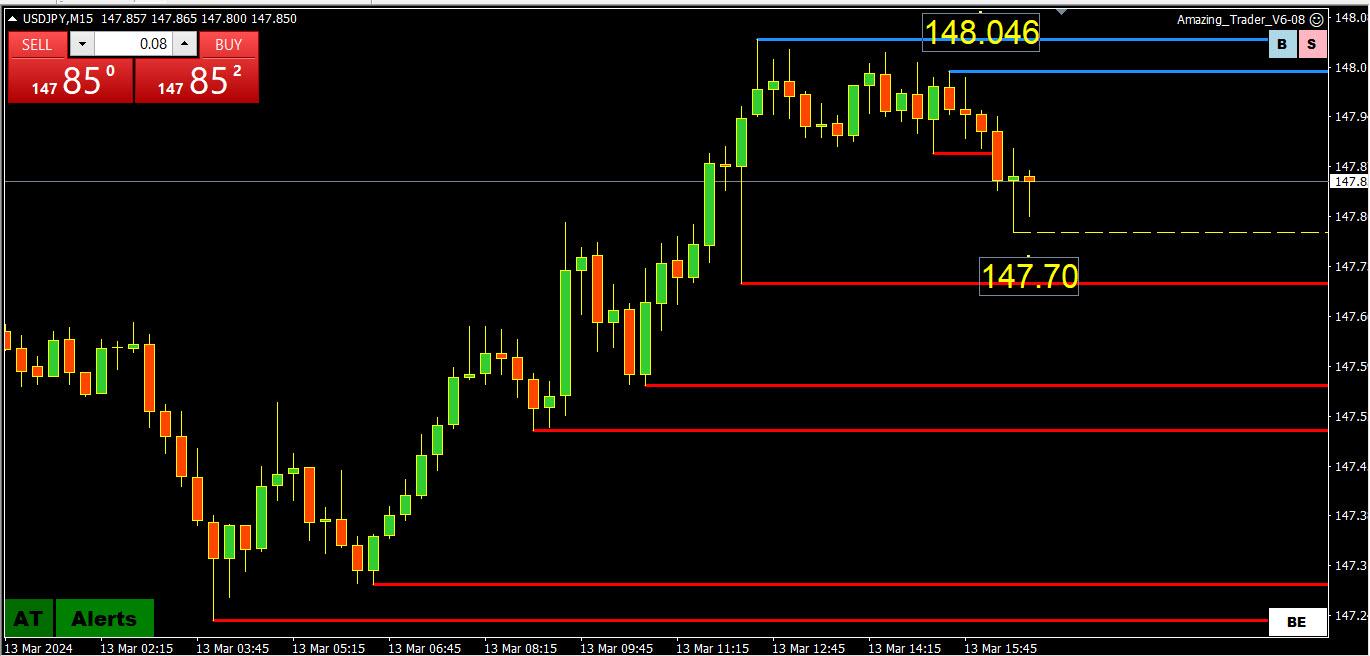
Let’s take a look at a shorter-time frame chart
USDJPY has backed off from a tepid test of 148ish and is still trapped with a bid while above 147.70 support (noted earlier).
See my blog article Is a BoJ Rate Hike Discounted? How Will USDJPY React?
March 13, 2024 at 1:10 pm #2935In reply to: Forex Forum
March 13, 2024 at 12:21 pm #2933In reply to: Forex Forum
EURJPY 4-Hour Chart
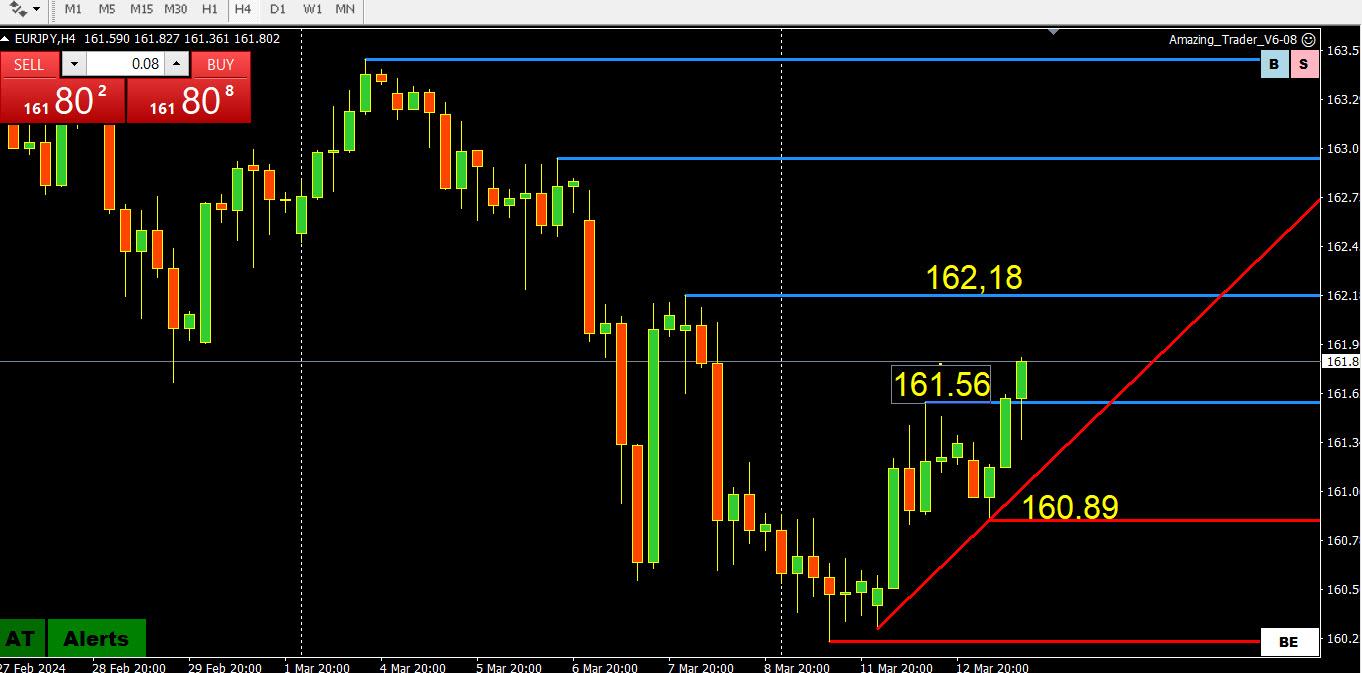
Red AT lines are now dominating as pre-BpJ trading sees USDJPY firm back towards 148 and offsets giving EURUSD some support.
Levels are clear on the chart with a bid while above 161.56 and the trendline.
These are fickle times ahead of the BoJ but for now there seems to be some cold feet from the JOY longs.
March 12, 2024 at 1:44 pm #2871In reply to: Forex Forum
March 12, 2024 at 12:33 pm #2868In reply to: Forex Forum
March 12, 2024 at 10:24 am #2862In reply to: Forex Forum
USDJPY 30 MIN CHART – Correcting but still below the latest breakdown level
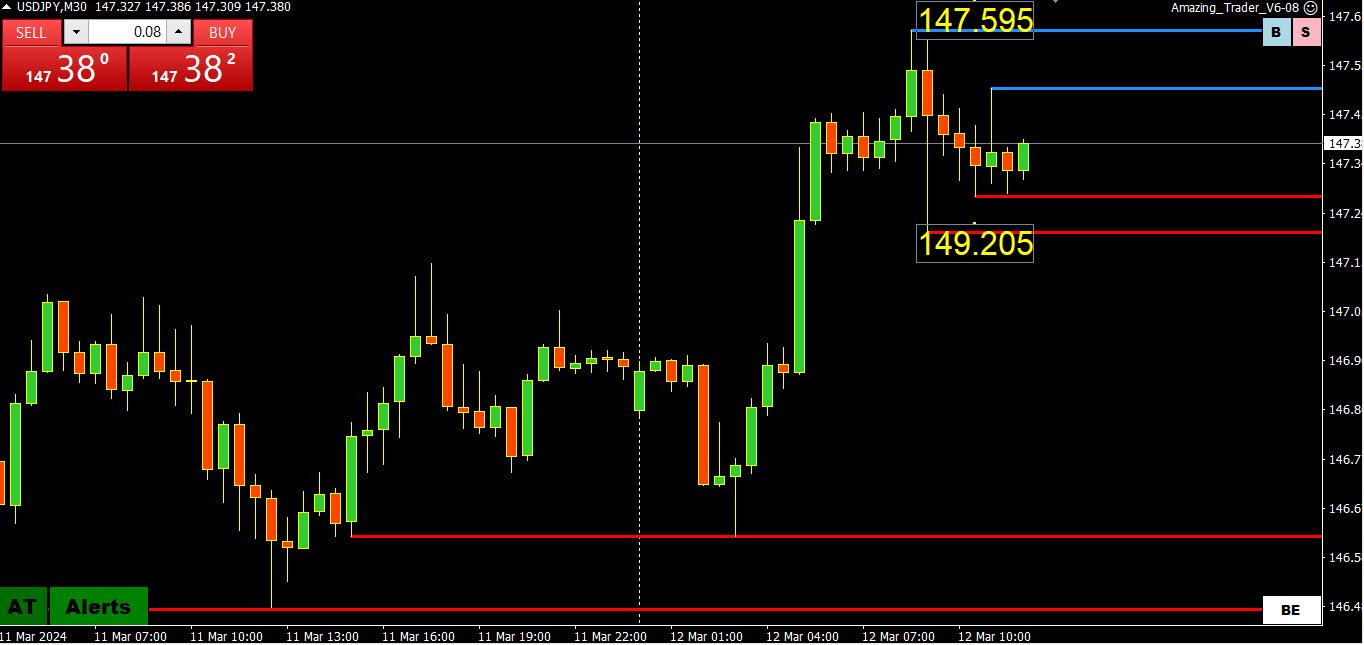
A failure to decisively break below 146.50 leaves the range to 148. On the other side, only 148+ would deflect risk on the downside.
As I noted, 147.61 was a breakdown level so the one blocking a shift in risk back to 148. So far the rebound has paused just below it.
Intra-day levels are in the chart.
NOTE
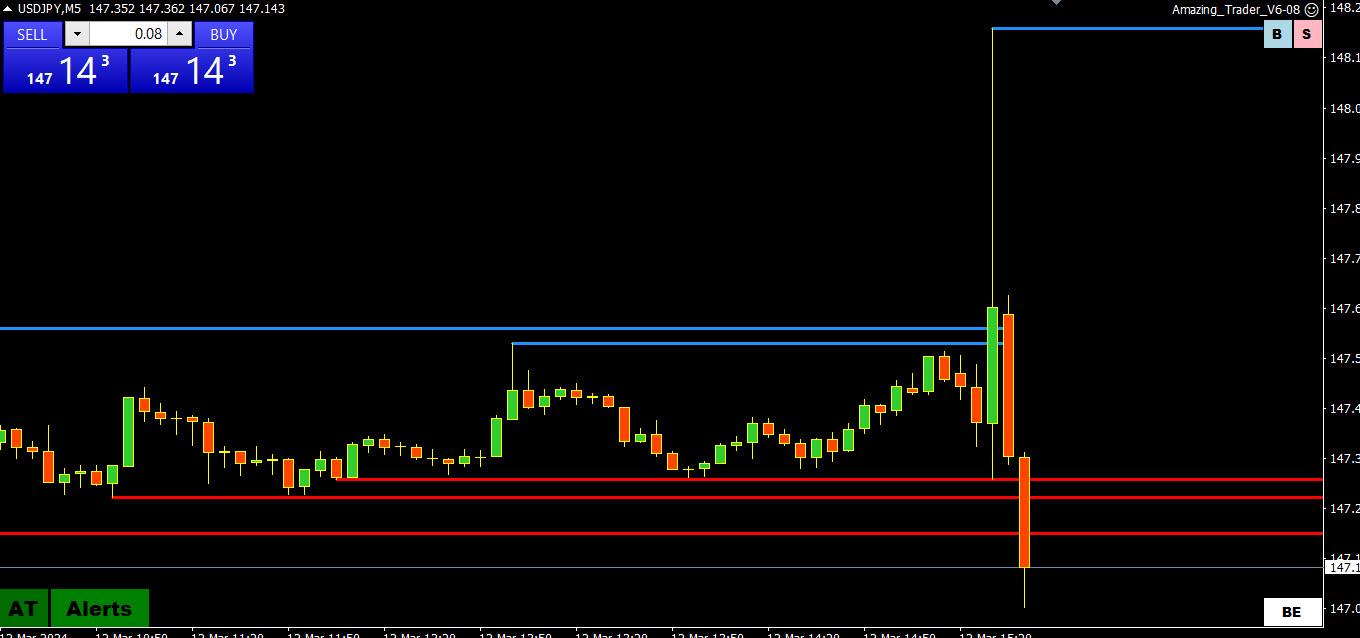
USDJPY bounced after BoJ Gov Ueda, testifying, gave no hint of a rate hike at next week’s meeting. He said we will see what data shows later in the week.
If trading USDJPY, do it intra-day as one off-hand comment overnight can send this pair up or down as market awaits next week’s BoJ decision.
US CPI next on deck.
March 11, 2024 at 7:21 pm #2849In reply to: Forex Forum
A bit different approach to USDJPY
As major supports behind this Up trend are far and away right now -143.250 & 139.000, only approach to trading USDJPY is intraday – time frames from 1h and bellow.
But if we look at it on this Daily chart, the following can be concluded – if in next two days USD finds the strength to go above 148.800 (lots, I know we will be looking at the renewed and even stronger Rally Up.
However, ” If” is not a reliable trading tool, but “Wait and see” comes as a good strategy , so we should accept that approach…
In the mean time, as long as USD is on the defensive, Short it on the smaller time frames given Sell signals , be fast and do not be greedy .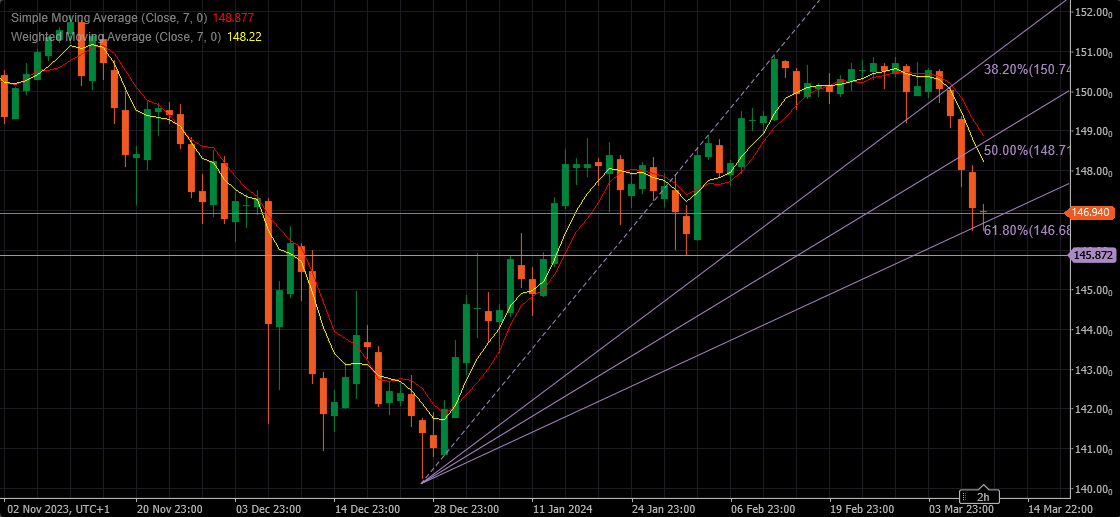 March 11, 2024 at 5:30 pm #2847
In reply to: Forex Forum
Read earlier that Claude Erb, a former commodities portfolio manager at TCW Group, plots bitcoin’s actual price over the past decade along with Erb’s application of Metcalfe’s Law with the result being a fair value of $35,000 for Bitcoin.
Side note, some ideas for orders I tried to post earlier but it would not post for some reason – buy side AudChf 5790 – Buy side AudCad 8900 – Sell side GbpChf 1260 – GbpUsd Buy side 2812 or lower – AudUsd buy side 6594 or lower – UsdJpy sell side 147.10 or higher –
March 11, 2024 at 1:26 pm #2788In reply to: Forex Forum
March 11, 2024 at 10:43 am #2766In reply to: Forex Forum
USDJPY DAILY CHART

As noted last week, the break of 147.61 exposed 145.90 as the next target.
Another test just below 146.50 suggests this will be the pivotal level determining whether there will be a run at 145.90 and then 145.
As also noted (when USDJPY traded below 148), expect a limited USDJPY upside ahead of the March 18-19 BoJ meeting where there is a risk of the neverending story of a rate hike to bring Japan out of negative interest rates finally reaching a conclusion.
Range so far today 146.48-147.13
March 11, 2024 at 10:35 am #2765In reply to: Forex Forum
USDJPY Technical Analysis: Key Levels and Potential Scenarios
USDJPY’s downward momentum from 150.88 has extended to a low of 146.47, currently testing the support level at 145.89.

The initial resistance level is located at 147.25. As long as this resistance level remains intact, the downside move is likely to persist. A potential breakdown below the 145.89 support level might trigger further downside movement towards the 144.30 area.
On the upside, a decisive breakout above the resistance level at 147.25 would suggest that consolidation for the downtrend is underway, with the pair potentially encountering resistance around the 148.00 region.
March 8, 2024 at 11:04 am #2696In reply to: Forex Forum
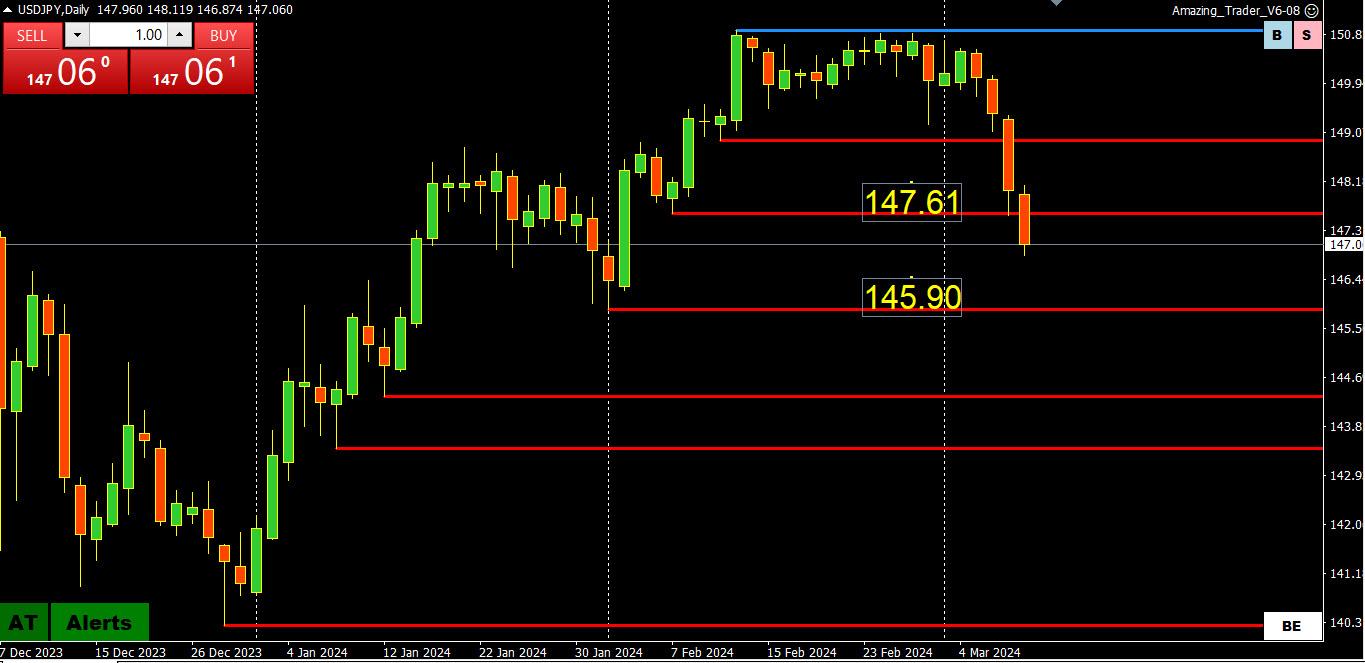
USDJPY DAILY CHART: MELTDOWN
Red AT support lines are being broken like Swiss cheese in a market likely thinned awaiting the US jobs report today.
With consolidation around 148 failing to last, the break of 147.61 leaves a void until 145.90.
On the upside, resistance is now between 147.61=148.00. Only back above 148 would deflect the risk
From the earlier Reuters article, suggests a limited USDJPY upside ahead of the BoJ meeting:
Bank of Japan (BOJ) officials have begun ramping up their hawkish rhetoric and shown increasing confidence that the Japanese economy was moving towards the BOJ’s 2% inflation target, just ahead of the central bank’s March 18-19 policy meeting.
-
AuthorSearch Results
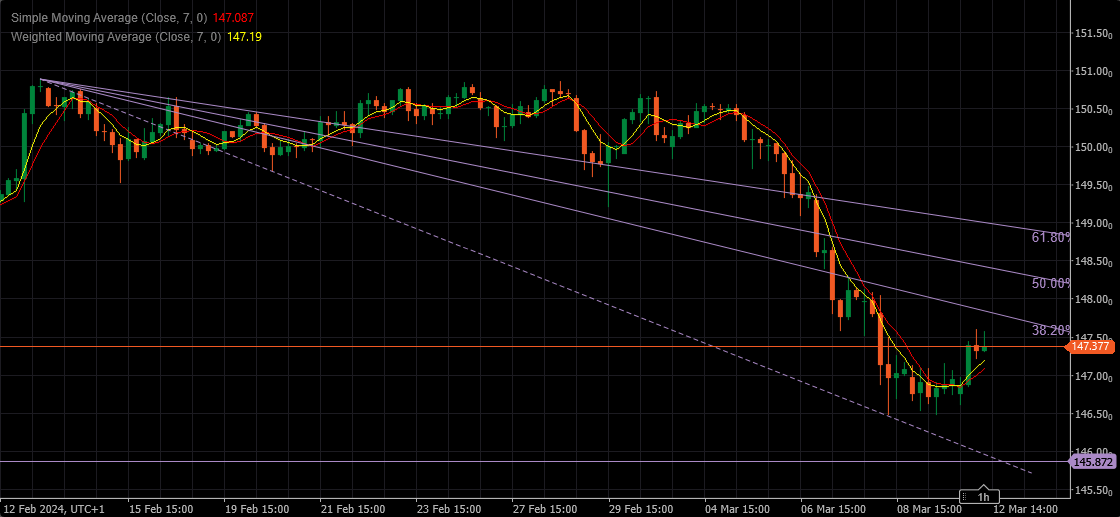 USDJPY 4H Chart – Fibbo Fans
Search
© 2024 Global View