
-
AuthorSearch Results
-
July 29, 2025 at 11:06 pm #28125
In reply to: Forex Forum
July 29, 2025 at 5:38 am #28081In reply to: Forex Forum
Ethereum Soars on $1.9B Inflows and ETF Optimism as BlackRock and SharpLink Double Down
Ethereum (ETH) is once again at the center of investor attention, pulling in a staggering $1.59 billion in inflows over the past week.
This marks the second-largest weekly inflow in Ethereum’s history, amid growing optimism that U.S. regulators will soon approve a spot Ethereum ETF. Overall, digital asset investment products attracted $1.9 billion, marking 15 consecutive weeks of positive flows.This surge in capital has pushed Ethereum’s price up 62% this month to $3,900, positioning it just below the critical $4,000 breakout level. Meanwhile, Bitcoin ETPs faced $175 million in outflows, signaling a capital rotation from BTC to ETH and other altcoins.
Analysts point to the passage of the Genius and Clarity Acts in the U.S. as key drivers of this trend, enhancing regulatory clarity for altcoin investment vehicles.BlackRock and SharpLink Boost Ethereum Exposure
Institutional investors are doubling down. BlackRock’s iShares Ethereum ETF (ETHA) surged past $10 billion in AUM, becoming the third-fastest-growing ETF globally, while the firm raised its ETH holdings to $10.47 billion, with 100% of its crypto exposure now allocated to Ethereum.
Simultaneously, Nasdaq-listed SharpLink Gaming purchased 77,210 ETH worth approximately $295 million, raising its total ETH treasury to over 438,000 ETH. This single purchase surpassed the network’s entire 30-day ETH issuance, underscoring the aggressive accumulation trend among institutions.
Technical Indicators and Risks Remain Ethereum’s rally is further supported by bullish technical signals. A “golden cross” pattern emerged, and the MACD shows strong upward momentum, despite an overbought RSI reading of 82.07, a level often associated with potential price pullbacks.
Solana and XRP also saw inflows of $311 million and $189 million, respectively, while Litecoin and Bitcoin Cash experienced minor outflows. Meanwhile, Ethereum’s on-chain activity surged 288%, reinforcing confidence in the network’s role as the leading smart contract and DeFi platform. As regulatory momentum builds and ETF approval appears within reach, Ethereum’s dominance in institutional portfolios signals a pivotal moment for altcoin adoption—though short-term volatility remains a factor to watch. July 29, 2025 at 2:09 am #28079
In reply to: Forex Forum
Stocks in New Zealand Rise for 5th Session
The NZX 50 rose 24 points or 0.2% to 12,935 on Tuesday morning, marking its fourth straight session of gains, driven by strength in industrial services, communications, and energy minerals.
Record-high closes on Wall Street’s S&P 500 and Nasdaq Monday also supported sentiment following the announcement of a U.S.-EU trade deal that eased global risk concerns. Meanwhile, President Trump said the baseline global tariff rate will likely fall “in the range of 15 to 20%.” Hopes that the U.S. Federal Reserve will hold interest rates steady this week also encouraged traders to add new positions.
On the trade front, the U.S. and China resumed talks, with expectations growing for a 90-day extension to their tariff truce.
However, gains were limited by caution ahead of key business and consumer confidence data in New Zealand due later this week.
Early outperformers included Spark NZ (2.4%), Third Age Health Services (2.3%), South Port NZ (2.0%), and PGG Wrightson (1.8%). NZX Chart July 29, 2025 at 12:46 am #28078
In reply to: Forex Forum
US Futures Steady After Mixed Wall Street Session
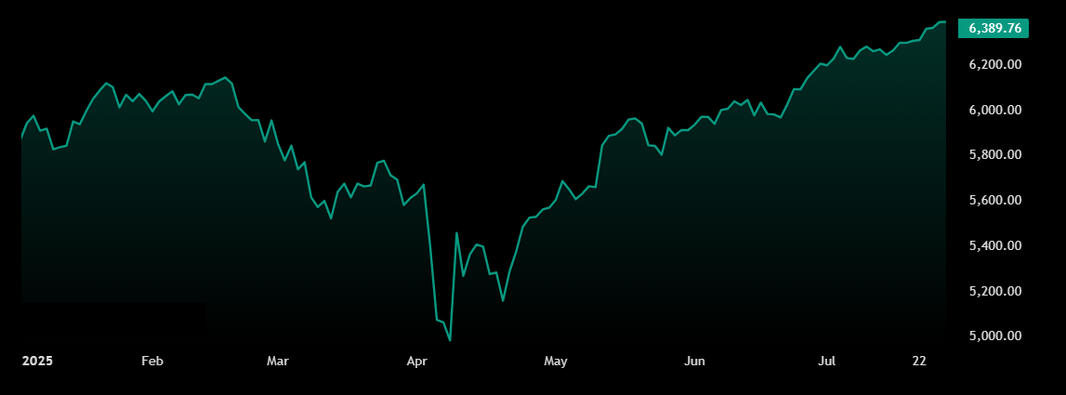
US stock futures held steady on Tuesday following a mixed performance on Wall Street to start the week. On Monday, the S&P 500 and Nasdaq Composite edged up 0.02% and 0.33%, respectively, with both indexes notching fresh record highs.
In contrast, the Dow slipped 0.14%.
The market reacted to a new US-EU trade agreement and braced for a busy week packed with corporate earnings and key economic events.
President Trump announced a trade deal with the EU that sets a baseline tariff of 15%, while optimism grew around a possible extension of the US-China trade truce.
Investors also looked ahead to earnings from major tech names including Meta, Microsoft, Apple, and Amazon.
Meanwhile, attention turns to the Federal Reserve’s policy decision on Wednesday, where traders will be watching for signals of a possible rate cut in September. Key economic data on PCE inflation and the July jobs report are also due later in the week.
S&P 500 Chart
 July 28, 2025 at 12:33 pm #28045
In reply to: Forex Forum
US Futures Edge Higher
US stock futures edged higher on Monday, with S&P 500 futures up 0.2% following a record close on Friday, the Nasdaq 100 gaining 0.4%, and Dow Jones futures rising by nearly 30 points, as investors welcomed signs of de-escalation in the trade war.
Over the weekend, the US and the EU reached a deal under which EU exports to the US will face a 15% tariff, half the 30% rate initially threatened by President Trump.
Additionally, US and Chinese officials are scheduled to meet today to discuss ongoing trade issues, with a widely expected extension of the current truce.
Energy and defense stocks were among the early gainers in premarket trading, including Lockheed Martin (1.1%), GE Aerospace (0.7%), RTX (0.9%), Exxon Mobil (0.6%), and Chevron (0.6%).
Meanwhile, investors are gearing up for the busiest earnings week of the season, with Microsoft, Apple, Amazon, and Meta set to report quarterly results.
The Fed’s monetary policy decision and a slate of key economic data will also be in focus.
Nasdaq Chart
 July 26, 2025 at 11:40 am #28004
In reply to: Forex Forum
where and when have I seen (near) vertical lines on price charts ?
Wall St Week Ahead: Tariffs, Fed, tech results headline jam-packed markets week
RECORD HIGHS, FALLING VOLATILITY
The S&P 500 has surged 28% since its low for the year a week later, while the tech-heavy Nasdaq Composite (.IXIC), opens new tab has jumped 38% in that time.it is all good 🙂
July 24, 2025 at 8:10 pm #27957In reply to: Forex Forum
July 23, 2025 at 3:52 pm #27893In reply to: Forex Forum
US Stocks Gain on Positive Trade Developments
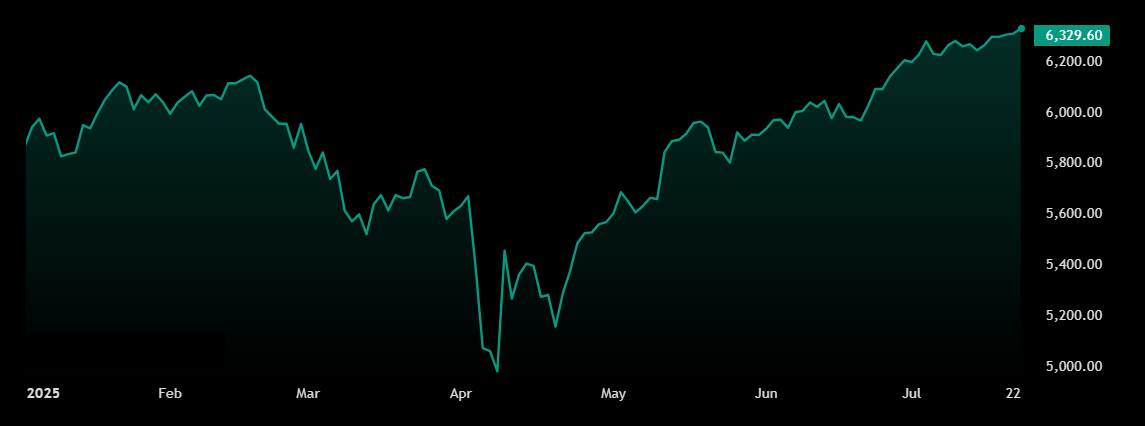
US stocks were higher on Wednesday, with the S&P 500 rising 0.3%, the Nasdaq edging up 0.1%, and the Dow Jones jumping more than 250 points.
The gains followed fresh record closes for the S&P 500 in back-to-back sessions.
Investor sentiment was buoyed by renewed trade optimism after President Trump announced a deal with Japan that would lower tariffs from 25% to 15%.
Japan also committed to investing $550 billion in the US and opening its markets to key American goods.
Additionally, a trade agreement with the Philippines was announced, while hopes are growing that a deal with the EU may soon be reached.
Health and industrials were the top performing sectors while communication services underperformed.
Meanwhile, earnings season remains in focus.
Alphabet (-0.1%), Tesla (-0.5%), T-Mobile (-0.2%), and IBM (0.9%) are set to report after the opening bell.
Texas Instruments plunged 11% after issuing a weak earnings outlook, while AT&T dropped 2.9% despite beating earnings expectations.
S&P 500 Chart
 July 23, 2025 at 11:14 am #27884
In reply to: Forex Forum
Bitcoin Price, XRP Fall. Why the Crypto Rally Is Stalling
Bitcoin and most other cryptocurrencies were falling on Wednesday. The announcement of a U.S.-Japan trade deal appeared to boost stock markets but cryptos weren’t beneficiaries.
While futures on the Nasdaq 100 rose 0.2% in premarket trading, the sentiment boost didn’t really translate to cryptocurrencies. That could be down to crypto’s strong recent rally — Bitcoin is up more than 10% in July, while popular altcoin XRP has climbed 55% over the same period.
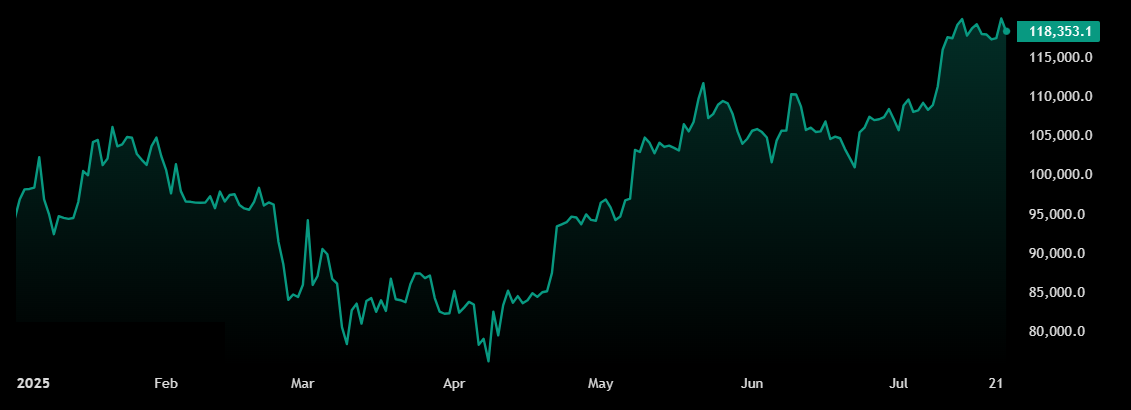
Bitcoin’s price was down 0.5% over the past 24 hours early on Wednesday, at around $118,346, falling from its 24-hour high of above $120,000. The world’s largest cryptocurrency hit a record high of $123,166 last week amid excitement over crypto-related legislation championed by the Trump administration.
Several large altcoins were falling. Ether dropped 0.8%, XRP fell 1.3%, and Solana dropped 0.5%. Memecoin Dogecoin was down 4.3%.
“It seems that we are seeing calendar rhythms, with increased inflows at the beginning of the month and caution at the end,” wrote Alex Kuptsikevich, chief market analyst at FxPro, in a research note. “Cryptocurrencies are ignoring the positive sentiment on the stock markets: technical factors are temporarily dominating the agenda.”
While the U.S.-Japan deal has little direct effect on the cryptocurrency market, reduced trade tensions could increase confidence in investing in volatile assets, such as cryptocurrencies.
Meanwhile, there continue to be signs of further interest in cryptocurrency from traditional financial institutions. PNC Financial Services Group and Coinbase Global said Tuesday they will partner and offer services to each other. PNC will use the “Crypto-as-a-Service” platform of Coinbase, the largest cryptocurrency exchange in the U.S., to offer crypto access for its clients.
BTCUSD Chart
 July 22, 2025 at 1:07 pm #27845
In reply to: Forex Forum
Exchange-Traded Funds, Equity Futures Lower Pre-Bell Tuesday as More Corporate Earnings Awaited
The broad market exchange-traded fund SPDR S&P 500 ETF Trust SPY was down 0.2% and the actively traded Invesco QQQ Trust QQQ was 0.1% lower in Tuesday’s premarket activity as investors await more earnings reports.
US stock futures were also lower, with S&P 500 Index futures down 0.1%, Dow Jones Industrial Average futures slipping 0.02%, and Nasdaq futures retreating 0.2% before the start of regular trading.
Federal Reserve Chair Jerome Powell is scheduled to speak at 8:30 am ET.
The Richmond Fed manufacturing index for July will be released at 10 am ET.
Fed Vice Chair for Supervision Michelle Bowman’s remarks are due at 1 pm ET.
In premarket activity, bitcoin was up by 1.9%. Among cryptocurrency ETFs, the cryptocurrency fund ProShares Bitcoin Strategy ETF BITO was 2% higher, Ether ETF EETH was down 1.3%, and Bitcoin & Ether Market Cap Weight ETF BETH was flat.
Power Play:
Consumer
The Consumer Staples Select Sector SPDR Fund XLP was up 0.3%, while the Vanguard Consumer Staples Fund VDC was inactive. The iShares US Consumer Staples ETF IYK, the Consumer Discretionary Select Sector SPDR Fund XLY, the VanEck Retail
The iShares US Energy ETF IYE was inactive, while the Energy Select Sector SPDR Fund XLE was down by 0.04%.
Amplify Energy AMPY stock was down more than 1% before Tuesday’s opening bell after the company said it has engaged TenOaks Energy Advisors to explore potential buyers for its assets in East Texas and Oklahoma.
Commodities
Front-month US West Texas Intermediate crude oil was down 0.8% at $66.69 per barrel on the New York Mercantile Exchange. Natural gas fell 2.2% to $3.25 per 1 million British Thermal Units. United States Oil Fund USO was 0.7% lower, while the United States Natural Gas Fund UNG fell 1.8%.
Gold futures for August declined 0.3% to $3,396.40 an ounce on the Comex, while silver futures were down 0.6% at $39.10 an ounce. SPDR Gold Shares retreated by 0.3%, and the iShares Silver Trust was 0.1% lower.
SPY Chart
 July 21, 2025 at 12:19 pm #27803
In reply to: Forex Forum
US Futures Start the Week Higher with Earnings in Focus
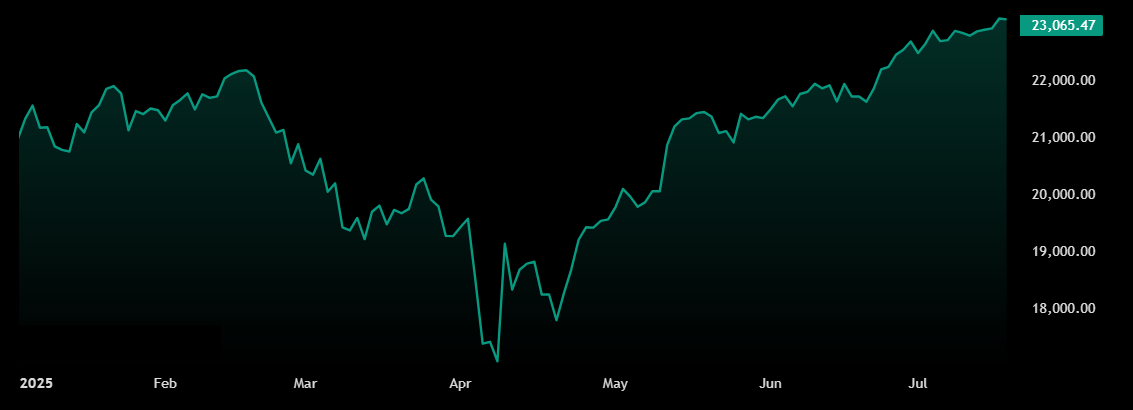
US stock futures traded slightly higher on Monday, with contracts on the Dow, S&P 500, and Nasdaq each up nearly 0.2%, as investors monitored trade developments and prepared for a busy week of corporate earnings.
Commerce Secretary Howard Lutnick reaffirmed that August 1st remains a “hard deadline” for implementing new tariffs, though he signaled that negotiations with trade partners are still ongoing.
On the earnings front, Verizon surged nearly 5% in premarket trading after reporting results that beat expectations on both earnings and revenue, while also raising its full-year profit outlook.
Market focus is also turning to a wave of key earnings reports due this week from megacap names including Alphabet and Tesla, as well as IBM, T-Mobile, and Coca-Cola.
Meanwhile, Microsoft shares slipped 0.2% in premarket action after the company issued a warning about “active attacks” targeting a server software used by government agencies and businesses for internal document sharing.
Nasdaq Chart
 July 17, 2025 at 7:35 pm #27689
In reply to: Forex Forum
July 17, 2025 at 3:22 pm #27677In reply to: Forex Forum
July 16, 2025 at 7:32 pm #27628In reply to: Forex Forum
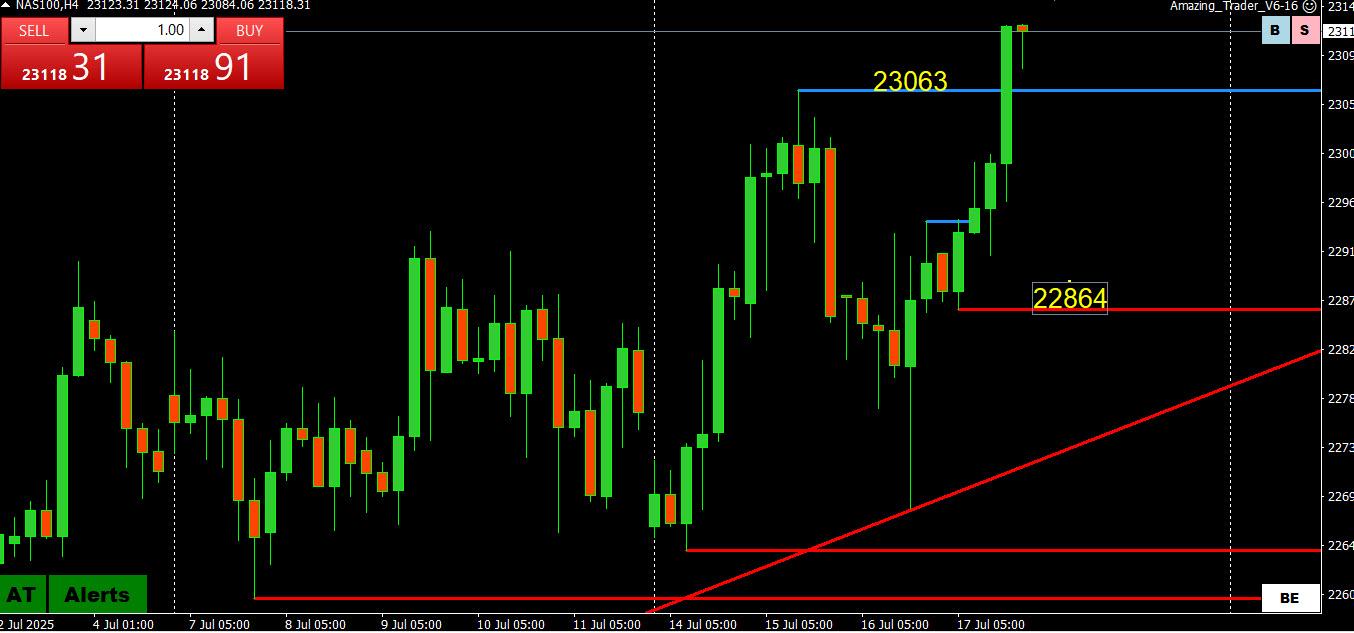
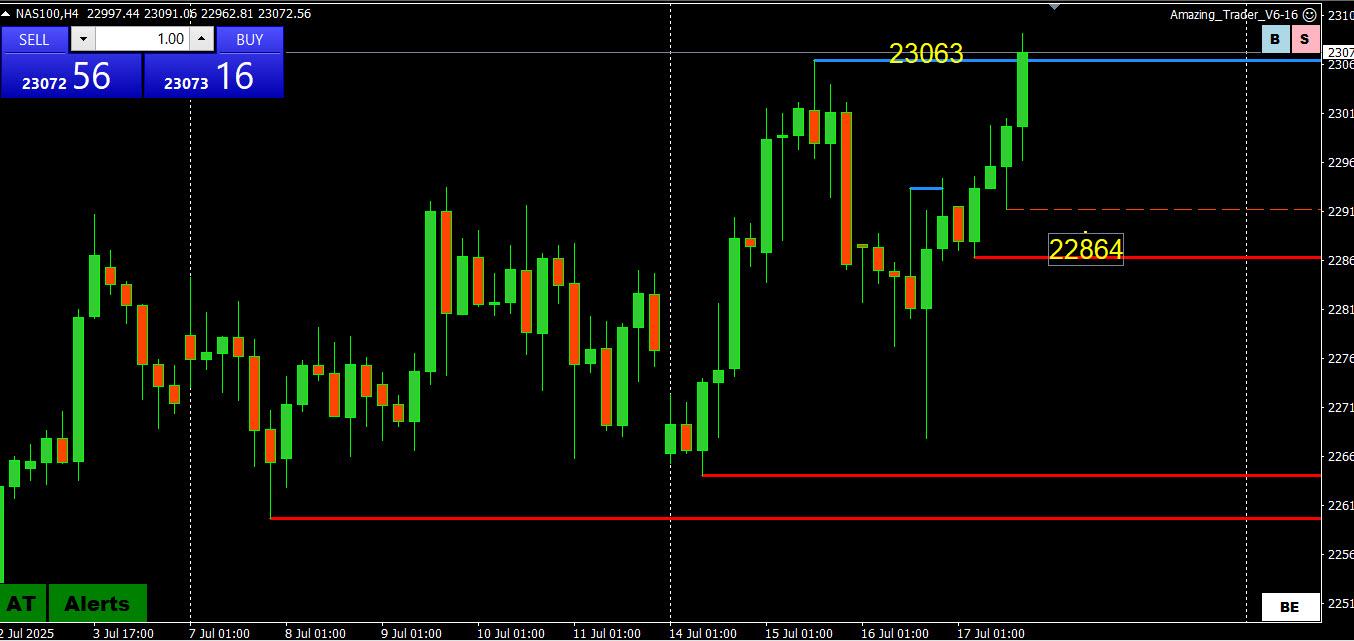
NAS100 (NASDAQ)
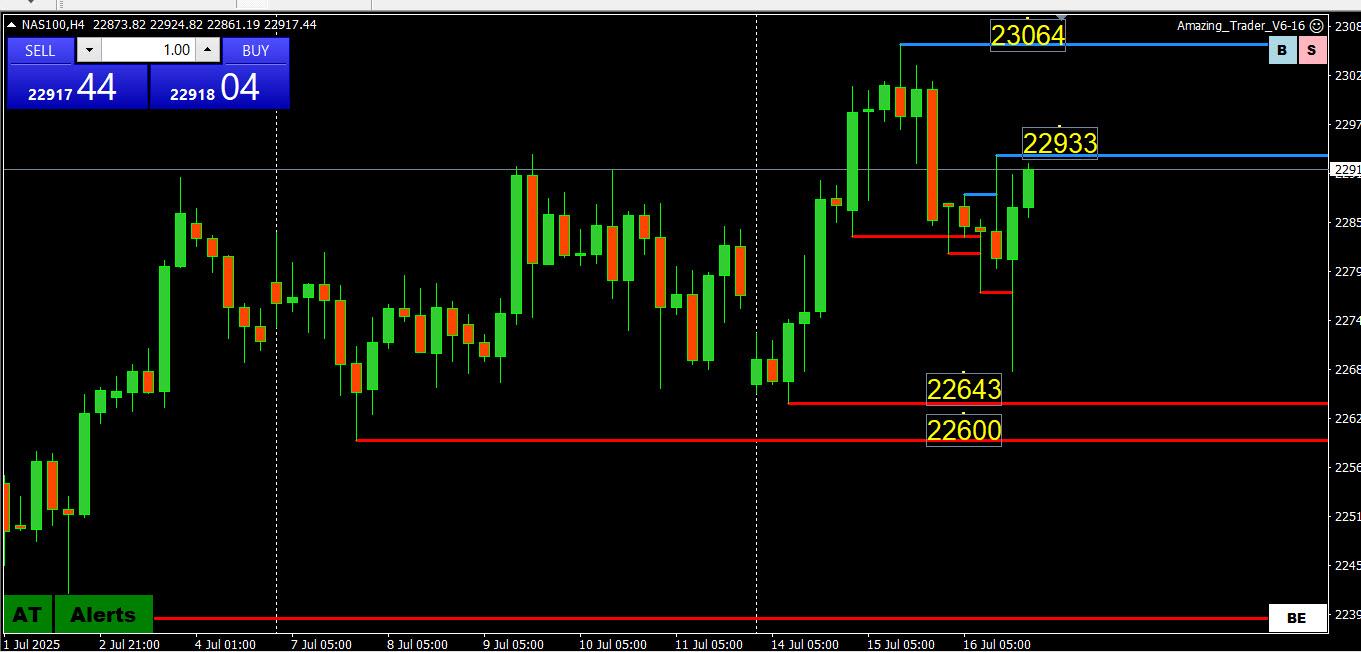
Despite the chaos, NAS100 performed technically, with the downside pausing above 26600-43 support while upside also was contained below the record 23064 high.
Upside: To put the record high at risk and negate any bearish signs, 22933+ is needed.
Downside: Failure to regain 22933 and then below 22600 would cause me to re-evaluate.
NAS100 4 HOUR CHART
 July 15, 2025 at 8:01 pm #27588
In reply to: Forex Forum
NAS100 (NASDAQ)
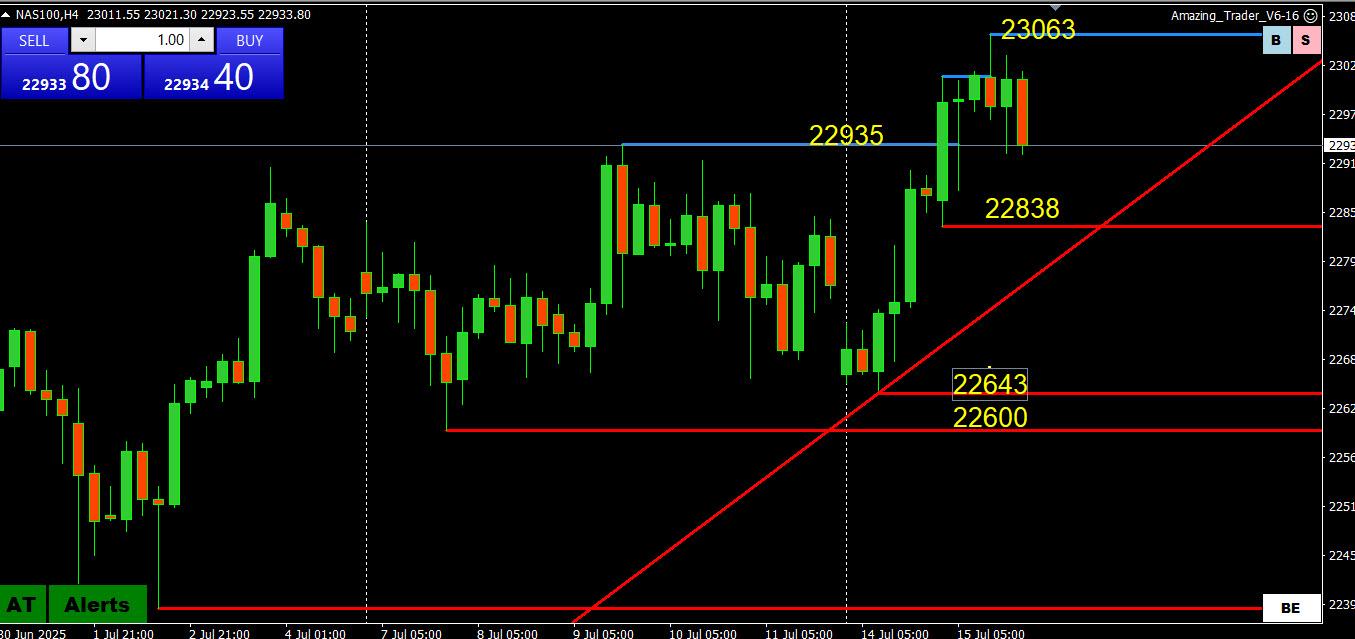
Similar to US500 … a retreat from a new record high except still having a stronger trend.
To raise the risk that the top is in, at least for now, back below the old record high (22935) and 22838 would indicate a break of momentum.
To do more damage, the trendline and 22600-43 would need to be broken.
One change is there is little to go after on the upside unless 23063 is broken,
NAS100 4 HOUR CHART
 July 15, 2025 at 5:24 pm #27577
In reply to: Forex Forum
US Equity Indexes Mixed as Nvidia Helps Lift Nasdaq While Investors Weigh Bank Earnings, Inflation Print
US equity indexes traded mixed after midday Tuesday, following quarterly earnings from the largest banks, consumer price inflation and renewed optimism among technology investors.
The Nasdaq rose 0.4% at 20,658.1, while the S&P 500 slipped 0.1% to 6,263.4 and the Dow Jones Industrial Average fell by 0.7% to 44,140.9. All sectors except technology and communication services fell intraday. Healthcare, energy, and financials led the decliners.
Wells Fargo WFC lowered its full-year net interest income outlook despite reporting second-quarter results above market expectations.
JPMorgan Chase JPM reported better-than-expected Q2 results as investment banking activity gained momentum amid improving market sentiment. Chief Executive Jamie Dimon, however, warned that the US economy still faces substantial risks, including trade tariffs.
Citigroup C reported a year-over-year gain in net income and revenue during Q2.
Meanwhile, in economic news, the consumer price index rose 0.3% month-over-month in June, the Bureau of Labor Statistics reported Tuesday. That’s in line with a Bloomberg-compiled survey and a jump from a 0.1% gain in May. Annually, inflation accelerated to 2.7% from 2.4%, faster than the 2.6% consensus.
Core inflation, which excludes the volatile food and energy components, grew 0.2% from 0.1%, below the 0.3% forecast. The annual core measure came in at 2.9%, in line with market projections.
Most US Treasury yields rose, with the 10-year Treasury up 5.4 basis points to 4.48% and the two-year 5.6 basis points higher at 3.95%.
Nvidia NVDA secured a “monster win” as the US government assured that licenses for the H20 graphic processing units sales in China will be granted, Wedbush Securities said in a note to clients Tuesday. The tariff war halted H20 sales, and Wedbush said this cost Nvidia about $8 billion in quarterly sales. Shares jumped 4.2% intraday, among the top gainers in the S&P 500, the Nasdaq, and the Dow.
Nasdaq Chart
 July 15, 2025 at 1:19 pm #27553
In reply to: Forex Forum
July 14, 2025 at 7:50 pm #27514In reply to: Forex Forum
NAS100 (NASDAQ)
Impressive start to the week here as well, shrugging off a lower gap opening, finding support in our 22600-60 band and then bouncing back in range of its record 22935 high BUT
To expose the high, 22877 needs to become support. Otherwise, expect support as long as it trades above 22600.
NAS100 4 HOUR CHART
 July 11, 2025 at 3:00 pm #27406
In reply to: Forex Forum
US Stocks Lower on Friday
The S&P 500 lost 0.5% and the Nasdaq dropped 0.3% on Friday, after closing at a record high the day before.
Also, the Dow Jones was down almost 300 points, as investors weighed renewed tariff threats from the Trump administration.
The US President announced a 35% tariff on Canadian imports starting August 1st and signaled plans to impose broad-based tariffs of 15% to 20% on most other trading partners, up from the current 10% rate.
The EU is expected to receive formal notice of the applicable tariff rates shortly.
Meanwhile, traders are also bracing for the start of earnings season next week, along with key economic data, including the CPI. All sectors were in the red but materials and health led the losses.
Megacaps were mixed, with Microsoft (-0.4%), Apple (-0.8%), Meta (-1.4%), Broadcom (-0.6%), Alphabet (-0.3%), and Tesla (-0.8%) in the red while Nvidia (0.6%) and Amazon (0.7%) traded higher.
For the week, the S&P 500 and Nasdaq were little changed, while the Dow slipped 0.4%.
 July 11, 2025 at 10:10 am #27393
In reply to: Forex Forum
NAS100 (NASDAQ)
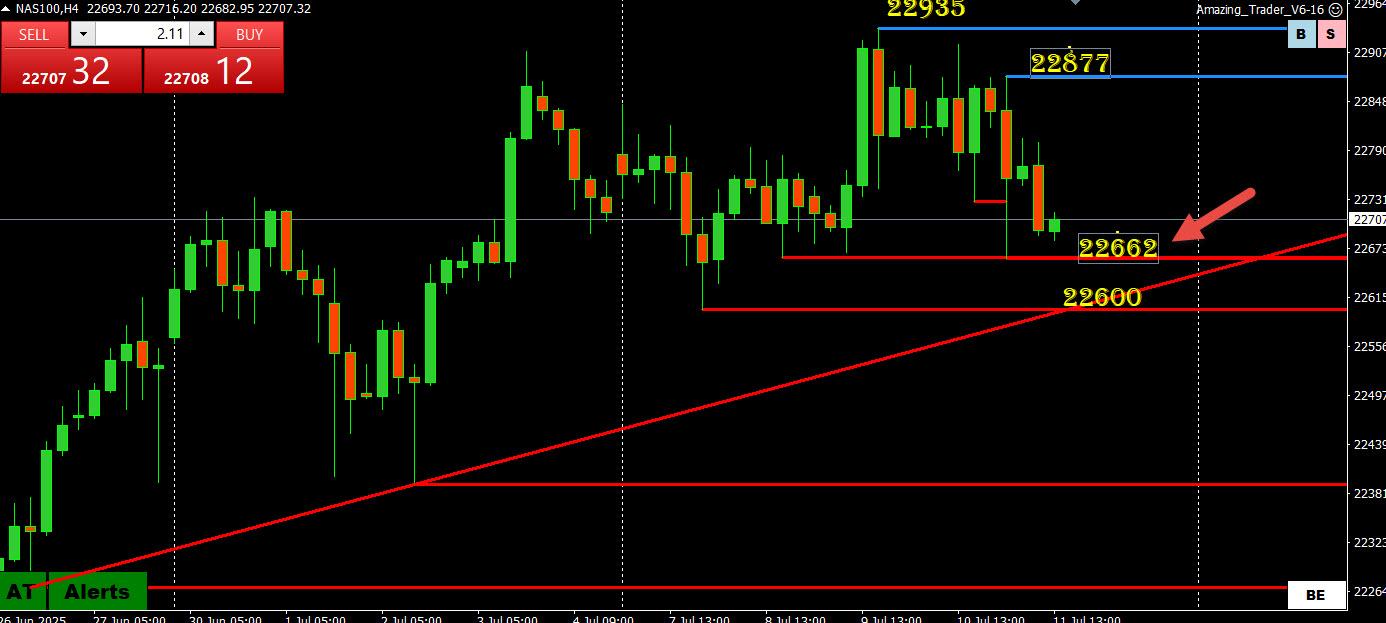
I posted this last night and so far 22662 has checked the downside. For those interested, this is an Amazing Trader chart and looking at it you can see why I say its levels matter.
I would be remiss by not pointing out a potential top/change of directional risk pattern formed by the 2 blue AT lines after not testing its record 22935 high.
This patter, HOWEVER, would only be confirmed by a break of 22600-22662.
Expect support as long as it trades above 22600-22662. Would re-assess if that support is broken.
NAS100 4 HOUR CHART
 July 10, 2025 at 8:03 pm #27368
In reply to: Forex Forum
NAS100 (NASDAQ)
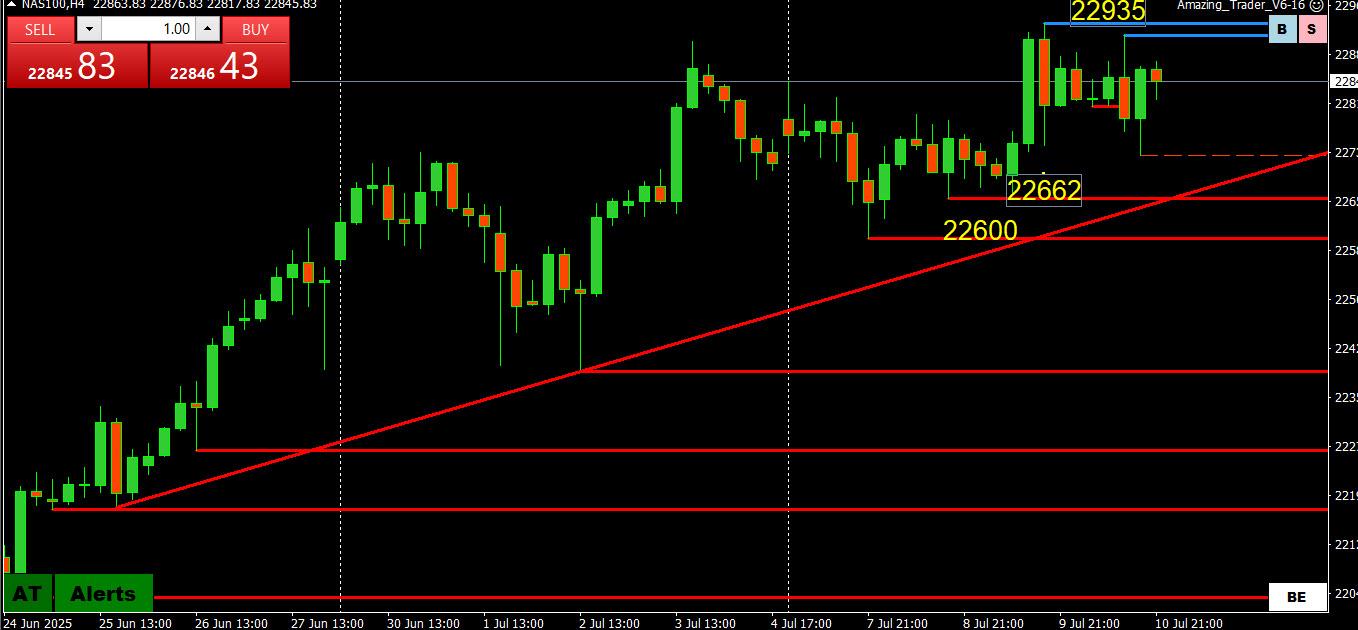
I would be remiss by not pointing out a potential top/change of directional risk pattern formed by the 2 blue AT lines after not testing its record 22935 high.
This patter, HOWEVER, would only be confirmed by a break of 22600-22662.
Expect support as long as it trades above 22600-22662. Would re-assess if that support is broken.
NAS100 4 HOUR CHART
 July 9, 2025 at 8:16 pm #27312
In reply to: Forex Forum
NAS100 (NASDAQ)
You can see by a new record high today why I said yesterday, no matter what charts say, even suggesting a potential top in the NAS triggers a bout of PTSD.
With that said, with no resistance other than the record high (22935), use that as the key level.
Expect support as long as it trades above 22600-22662. Would re-evaluate if that support is broken.
NAS100 4 HOUR CHART
 July 8, 2025 at 8:17 pm #27250
In reply to: Forex Forum
NAS100 (NASDAQ)
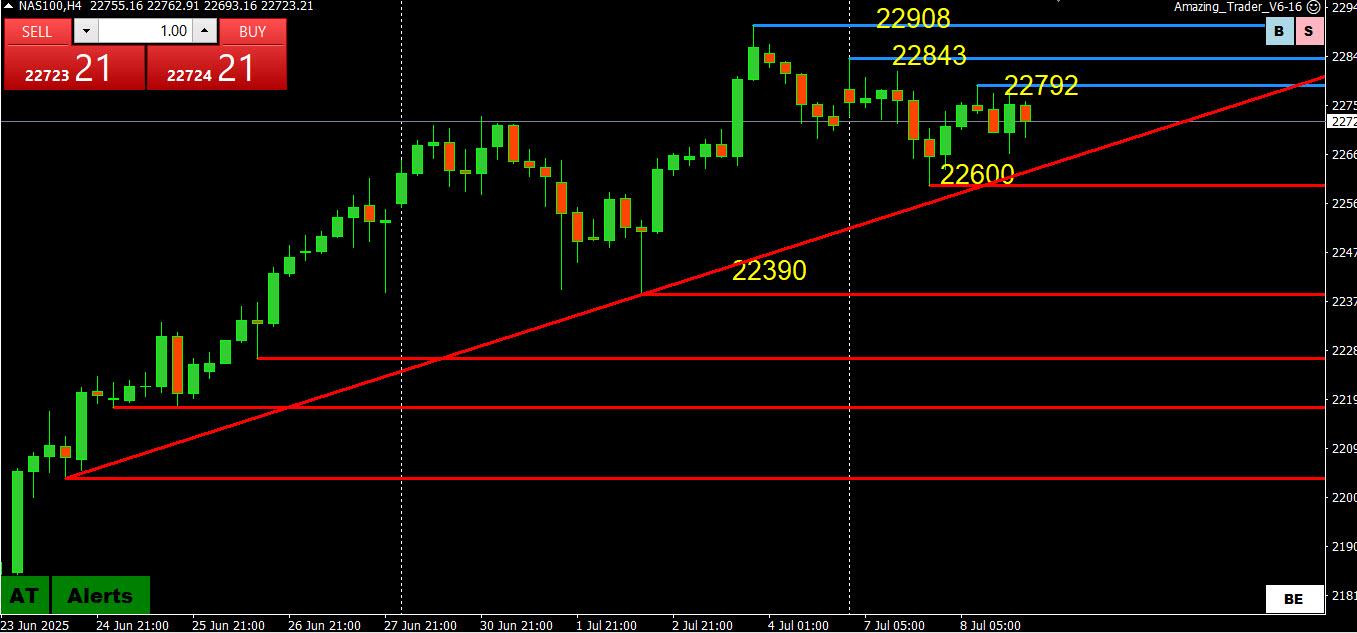
I get a bout of PTSD even talking about a top so going strictly by the chart there is “potential” for a top and change in directional risk BUT only confirmed if 22390 is broken.
To negate the risk, 22843 would need to be taken out.
Otherwise, it is consolidation with a limited upside while below 22843.
NAS100 4 HOUR CHART
 July 8, 2025 at 1:03 pm #27228
In reply to: Forex Forum
US Futures Point to a Rebound
US futures erased most early losses on Tuesday, as investors digested the latest trade developments.
Futures on the S&P 500 rose 0.1%, the Nasdaq 100 edged up 0.2%, and Dow Jones futures hovered near the flatline.
Markets responded to news that President Trump had announced revised tariff rates on 14 countries that have yet to reach trade agreements with the US. Reports also indicated that the US has proposed a deal to the EU that would retain a 10% baseline tariff, with exceptions for sensitive sectors such as aircraft and spirits.
Investors found some relief in the extended timeline for negotiations, as the new tariffs are not set to take effect until August 1st, allowing more time to reach agreements.
On the corporate front, Tesla shares rose nearly 1% in premarket trading, rebounding after a 6.8% decline on Monday.
Other megacap tech stocks were mostly higher ahead of the opening bell, including Nvidia (+0.8%), Amazon (+0.3%), Meta (+0.6%), Broadcom (+0.7%), and Alphabet (+0.5%).
SP 500 Chart
 July 7, 2025 at 7:43 pm #27194
In reply to: Forex Forum
NAS100 (NASDAQ)
Similar to US500
Two blue Amazing Trader lines drawn off the high and followed by the break of 22632 indicates a top and potential change in direction or at a minimum a loss of upward momentum.
For downside momentum to build, 22390 would need to be taken out.
Otherwise it is consolidation with a limited upside unless 22843 is broken
NAS100 4 HOUR CHART
 July 3, 2025 at 11:21 am #27091
In reply to: Forex Forum
Trading alert – early market closures
US traders will head for early exits once data comes out
Thursday, July 3, 2025, U.S. markets will have early closures ahead of Independence Day:
• Stock markets (NYSE and Nasdaq) will close at 1 p.m. ET. 
• Bond markets will close at 2 p.m. ET. 
On Friday, July 4, both stock and bond markets will remain fully closed in observance of Independence Day.
 July 2, 2025 at 6:11 pm #27067
In reply to: Forex Forum
Trading alert
US traders will head for the exits once data comes out tomorrow.
Yes, on Thursday, July 3, 2025, U.S. markets will have early closures ahead of Independence Day:
• Stock markets (NYSE and Nasdaq) will close at 1 p.m. ET. 
• Bond markets will close at 2 p.m. ET. On Friday, July 4, both stock and bond markets will remain fully closed in observance of Independence Day.
July 1, 2025 at 8:22 pm #27011In reply to: Forex Forum
NAS100 (NASDAQ)
Even suggesting a top in NAS100 is akin to heresy but charts show 22393 (now a near double bottom) as the level that needs to hold or risk for a pause that shifts focus to layers of support between 22000-22200
Only below the lower end would suggests a bigger risk of a retracement.
NAS100 4 HOUR CHART
 July 1, 2025 at 12:14 pm #26985
In reply to: Forex Forum
Uncertain Trade Outlook Trims Wall Street Pre-Bell; Asia Mixed, Europe Off
Wall Street futures pointed moderately lower pre-bell Tuesday as traders weighed broad equity indices at all-time zeniths, but a lack of resolution on the Trump Administration’s trade deals with most major trading partners.
In the futures, the S&P 500 fell 0.2%, the Nasdaq declined 0.3% and the Dow Jones was off 0.1%.
In other news, Federal Reserve Chair Jerome Powell is slated to discuss monetary policy at the European Central Bank’s annual forum in Portugal, at 10 am ET.
The May Job Openings and Labor Turnover Survey, or JOLTS, posts at 10 am, sure to be parsed for clues to tightness in national labor markets.
Asian exchanges traded unevenly overnight, while European bourses edged lower midday on the continent.
MSC Industrial Direct (MSM) traded up 1.6% pre-bell after the industrial equipment distributor reported adjusted earnings and net sales above Street views in morning hours.
On the economic calendar, in addition to the JOLTS release, is the S&P Global final US manufacturing PMI at 9:45 am ET, followed by the ISM manufacturing index for June and the construction spending bulletin for May, both at 10 am.
In premarket action, Bitcoin traded at $106,560, West Texas Intermediate crude oil traded higher at $65.58, and 10-year US Treasuries offered 4.19%. Spot gold traded for $3,349 an ounce.
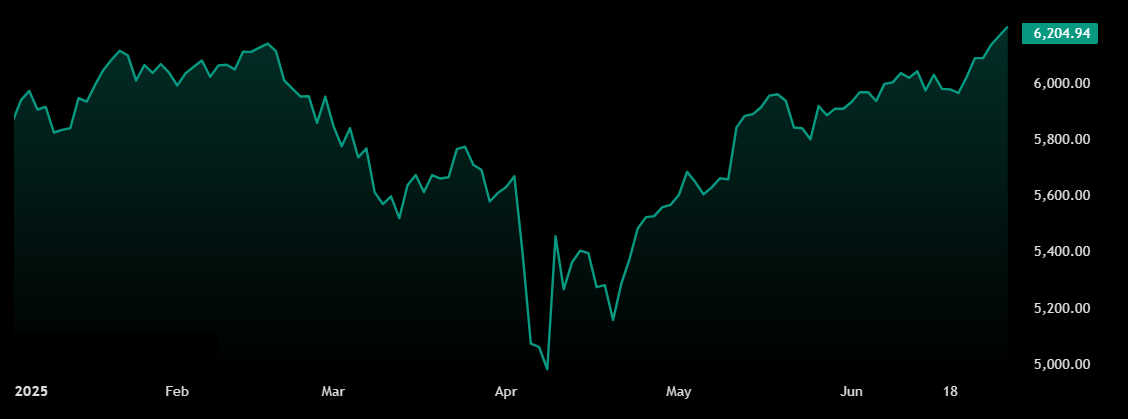
SP 500 – SPX Chart
 June 30, 2025 at 8:14 pm #26960
In reply to: Forex Forum
NAS100 (NASDAQ)
Same as US500
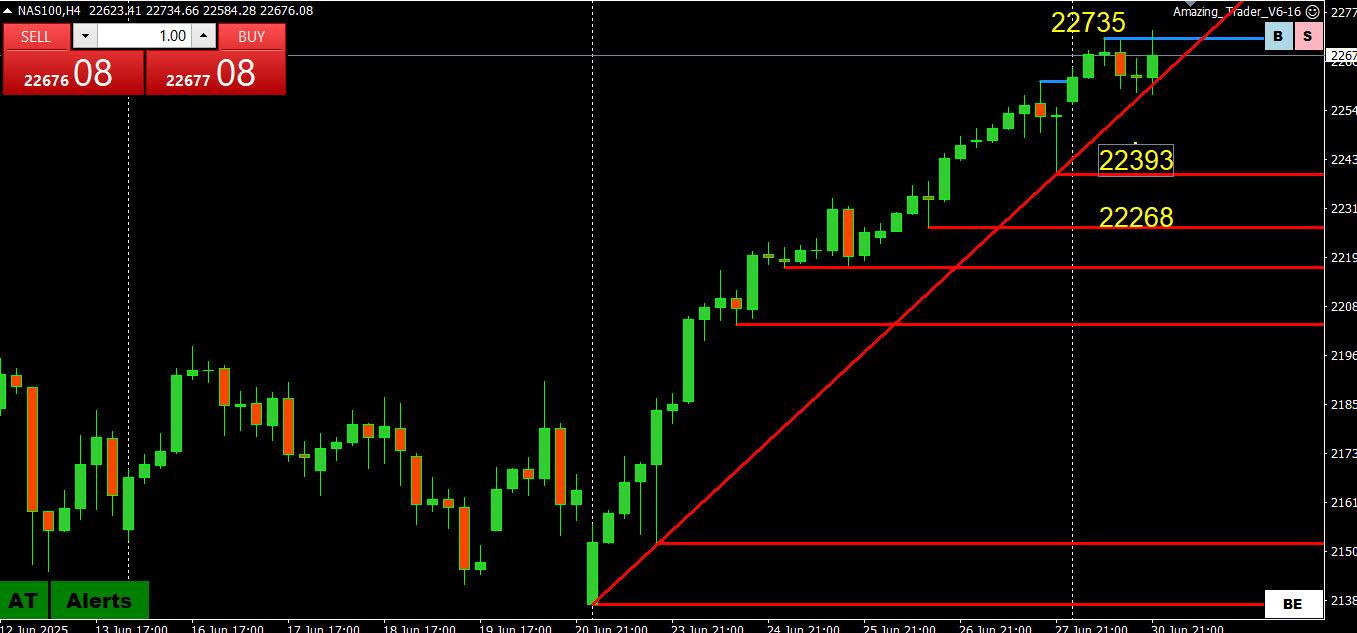
When in unchartered (record high) territory an absence of key levels leaves the most recent high (new record) as key resistance.
Support at 22393 needs to hold to keep[ momentum moving higher. .
A test for stocks will come after month/quarter end passes as fund/money managers will want to show investors that they are invested in the rally to record highs ahead of month end.
NAS100 4 HOUR CHART
-
AuthorSearch Results


Search
© 2024 Global View