
-
AuthorSearch Results
-
August 20, 2025 at 2:17 pm #29320
In reply to: Forex Forum
August 20, 2025 at 12:20 am #29293In reply to: Forex Forum
Crypto Liquidations Top $506M as BTC Teases Below $113k
The crypto leveraged market, led by Ethereum ETHUSDT, recorded more than $506 million in net liquidations during the last 24 hours. According to market data analysis from CoinGlass, 143,027 traders were liquidated, with long traders involving more than $430 million compared to $77 million in short traders.
The wider crypto market followed major stock indexes in intraday correction. For instance, the S&P 500 dropped 0.6 percent on Tuesday while the NASDAQ index dropped 1.5 percent in the last 24 hours.
Top Reasons Why Crypto Dropped Today In the past two days, the overall demand for Bitcoin and Ethereum by institutional investors has significantly declined. For example, the U.S. spot Ether ETFs have recorded a net cash outflow of more than $250 million in the past two days led by BlackRock’s ETHA.
Additionally, the U.S. spot BTC ETFs, led by BlackRock’s IBIT, recorded a net cash outflow of more than $130 million in the last two days. On-chain data analysis also shows an accelerated selloff by whale investors.What are Midterm Expectations for Crypto Bull Market
The crypto market is awaiting tomorrow’s FOMC meeting minutes and U.S. unemployment claims to gauge Friday’s Fed Chair Jerome Powell speech. Furthermore, last week’s hotter than expected inflation data has faded the bets on Fed rate cut in September.
The midterm crypto outlook will heavily be influenced by Bitcoin and Ethereum’s price action. As for ETH, the lower edge of the CME gap around $4,098 remains a magnet, with technical analysis showing $4k as a major support level. Meanwhile, Bitcoin price must hold above the support level around $113k to invalidate a potential retrace towards $109k in the coming weeks. August 19, 2025 at 4:12 pm #29267
In reply to: Forex Forum
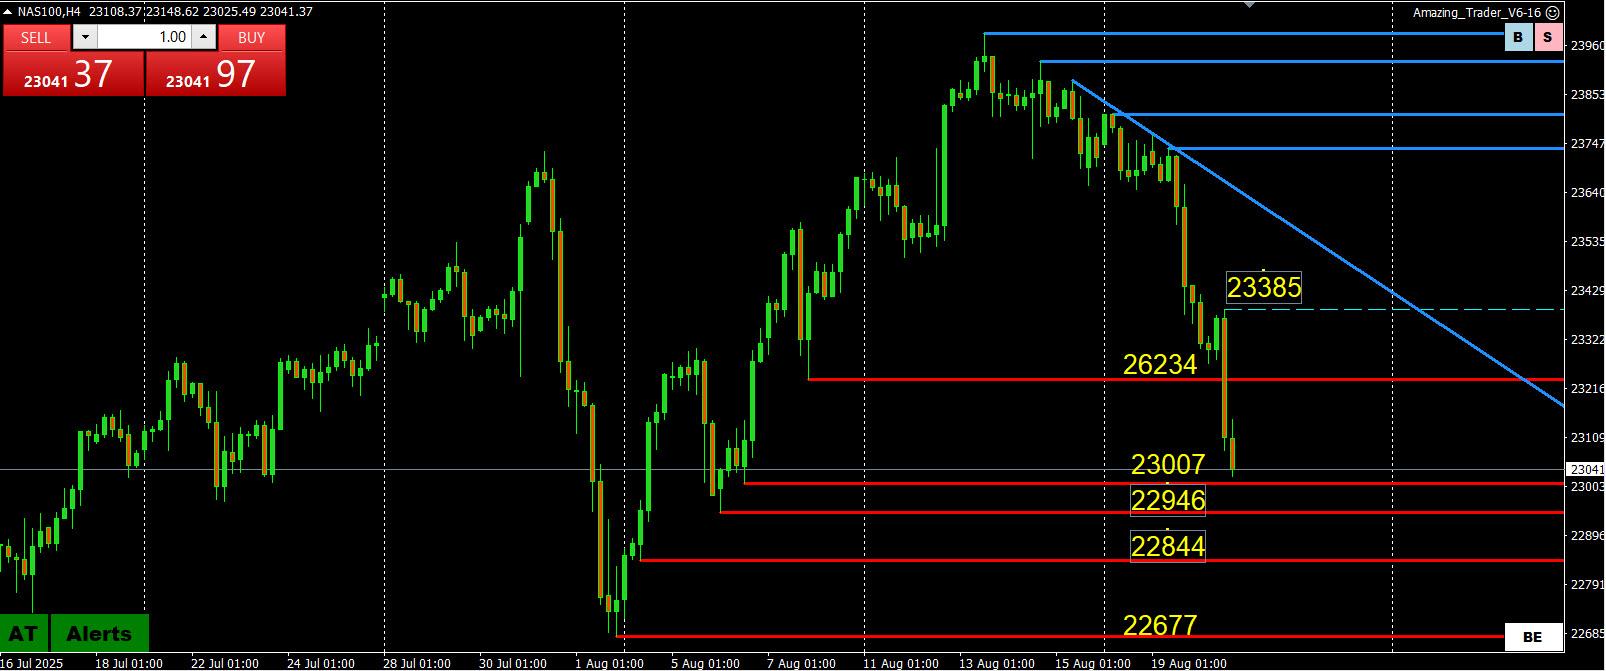
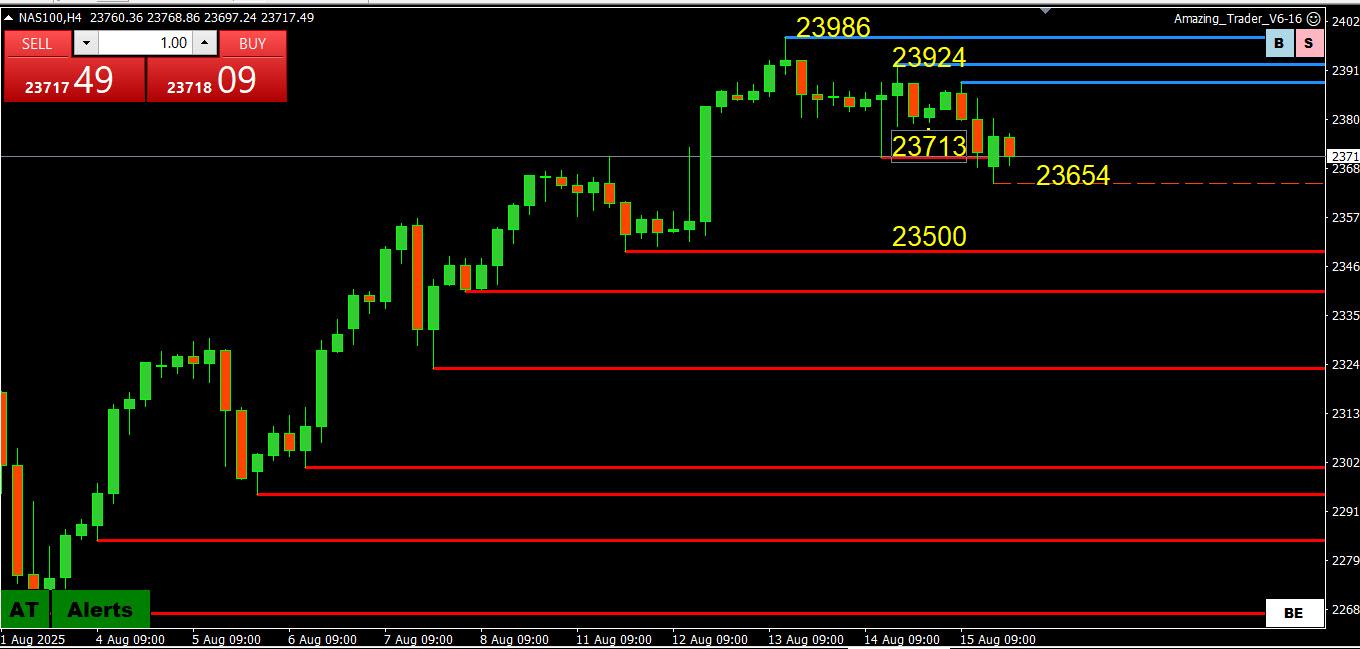
NAS100 (NASDAQ)
As I have been posting:
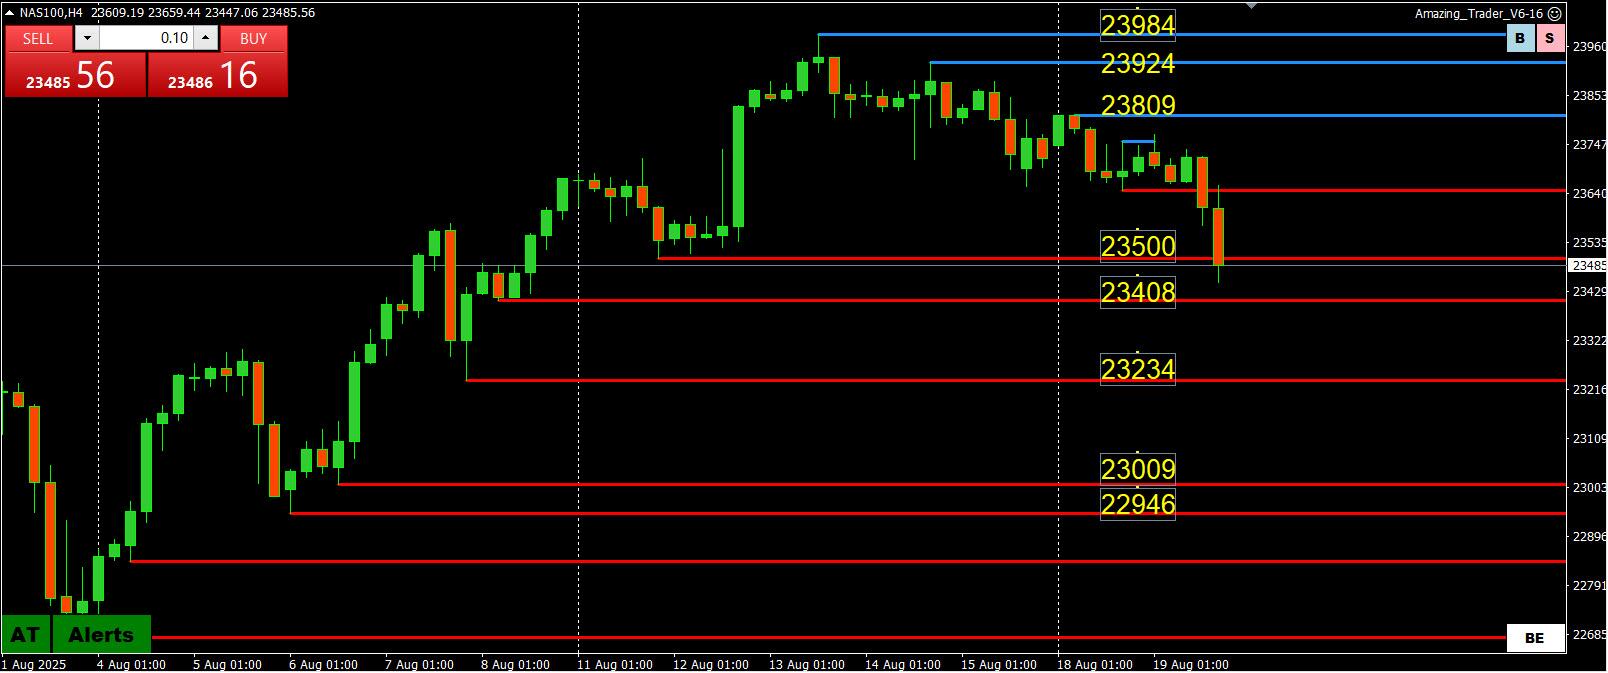
While it’s hard to bet against the NAS, it is also hard to ignore the charts, especially this Amazing Trader pattern..
3 blue Amazing Trader lines drawn off the high often sees an acceleration to the downside.
Now that the move down has accelerated, to keep it in check, NAS100 needs to stay above 23500… currently being pivoted.
Below 23500 lies 23408, 23234, 23009 ahead of 23000.
NAS100 4 HOUR CHART
 August 18, 2025 at 8:07 pm #29210
In reply to: Forex Forum
August 17, 2025 at 10:47 pm #29151In reply to: Forex Forum
Asia Morning Call-Global Markets
EQUITIES
GLOBAL – Global stocks were flat but still traded near record highs on Friday as U.S. President Donald Trump and his Russian counterpart Vladimir Putin held high-stakes talks in Alaska over Ukraine.
The MSCI All Country World Index EURONEXT:IACWI consolidated recent gains. It was last flat at 951.70, just shy of the record level of 954.21 set on Wednesday.
NEW YORK – The blue-chip Dow Jones ended higher after hitting an intraday record high on Friday, as UnitedHealth’s shares jumped after Berkshire Hathaway raised its stake, but other Wall Street indexes slipped as mixed data clouded the Federal Reserve’s next monetary policy move.
The Dow Jones Industrial Average DJI rose 34.86 points, or 0.08%, to 44,946.12, the S&P 500 SPX lost 18.74 points, or 0.29%, to 6,449.80 and the Nasdaq Composite IXIC lost 87.69 points, or 0.40%, to 21,622.98.
LONDON – European shares came off multi-month highs on Friday, as declines in heavyweight tech and financial shares offset gains from some corporate earnings, while investors monitored a crucial U.S.-Russia summit.
The pan-European STOXX 600 index SXXP closed 0.1% lower, after hitting a near five-month high earlier in the session.
TOKYO – Japan’s Nikkei closed at an all-time high on Friday, as the yen weakened and data showed the nation’s economy was surprisingly resilient. The Nikkei 225 Index NI225 accelerated gains in the afternoon session, surging 1.7% to end at a record peak of 43,378.31.
NEW YORK – The dollar slipped on Friday as a data-heavy week wound down, keeping the case for a September Federal Reserve interest rate cut intact, while traders awaited talks in Alaska between U.S. President Donald Trump and Russian leader Vladimir Putin regarding Ukraine.
The dollar, which had jumped on Thursday as data showed U.S. producer prices increased more than expected in July, gave up most of those gains on Friday, and was set to finish the week 0.4% lower against a basket of currencies.
Nikkei Chart August 15, 2025 at 7:13 pm #29101
In reply to: Forex Forum
August 15, 2025 at 10:48 am #29063In reply to: Forex Forum
US stock market options expirations
Date: Friday, August 15, 2025
- Event: Monthly U.S. equity options expiration (standard options expire on the third Friday of each month).
- No quadruple witching: August is not a quarterly expiration month, so only single-stock and index options expire—not futures.
- When stock options expire, hedging and position adjustments by large institutions (market makers, hedge funds) can cause higher volatility and trading volume, particularly in the last hours of the session—known as “options expiration dynamics”.
Expected Market Behavior Around August 15
Increased Volatility and Volume
- Traders close or roll positions to avoid assignment.
- Hedging activity from options dealers can create sharp price swings.Liquidity is often high near the close, but order flow can push stocks toward key strike prices.
Pin Risk and Strike Price Magnet
- Stocks with large open interest at specific strike prices often “pin” near those levels as expiration approaches.
- Example: If a stock has heavy open interest at $100, price action may gravitate toward $100 on expiration day.
Index and ETF Impact
- Index options (like SP500 or Nasdaq) also expire, so S&P 500 and Nasdaq futures might see volatility as hedges unwind.
- This can spill over into broad market ETFs such as SPY and QQQ.
Expiration Week Effect
- Historically, the week of options expiration often shows above-average returns early in the week and choppy price action on Friday.
- The day after expiration (Monday) often experiences weaker returns as the market normalizes.
Trading Considerations
- Be cautious with stop-losses near key strike prices; price action may be erratic.
- Expect liquidity to cluster near popular strikes (especially in large-cap stocks and major ETFs).
- Watch VIX and implied volatility—they often decline after expiration.
- Consider rolling or closing options positions early if you don’t want assignment risk. (from the internet)
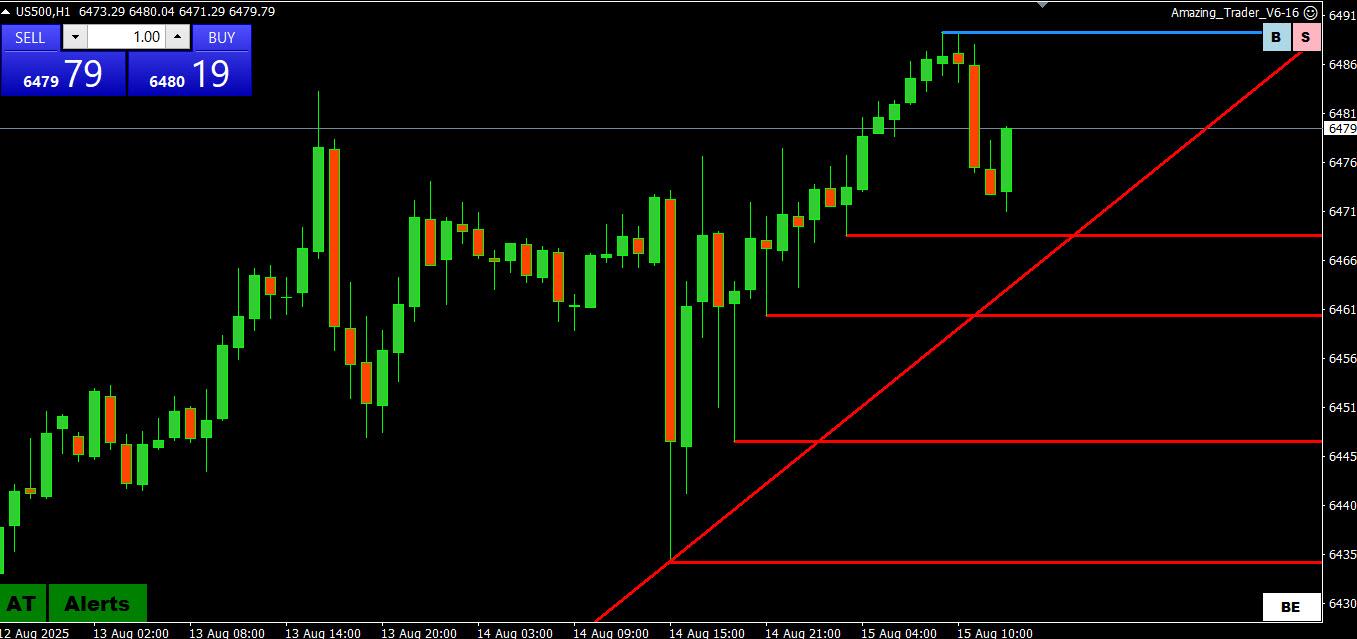
US500 1 HOUR CHART
 August 14, 2025 at 8:06 pm #29037
In reply to: Forex Forum
August 13, 2025 at 8:05 pm #28965In reply to: Forex Forum
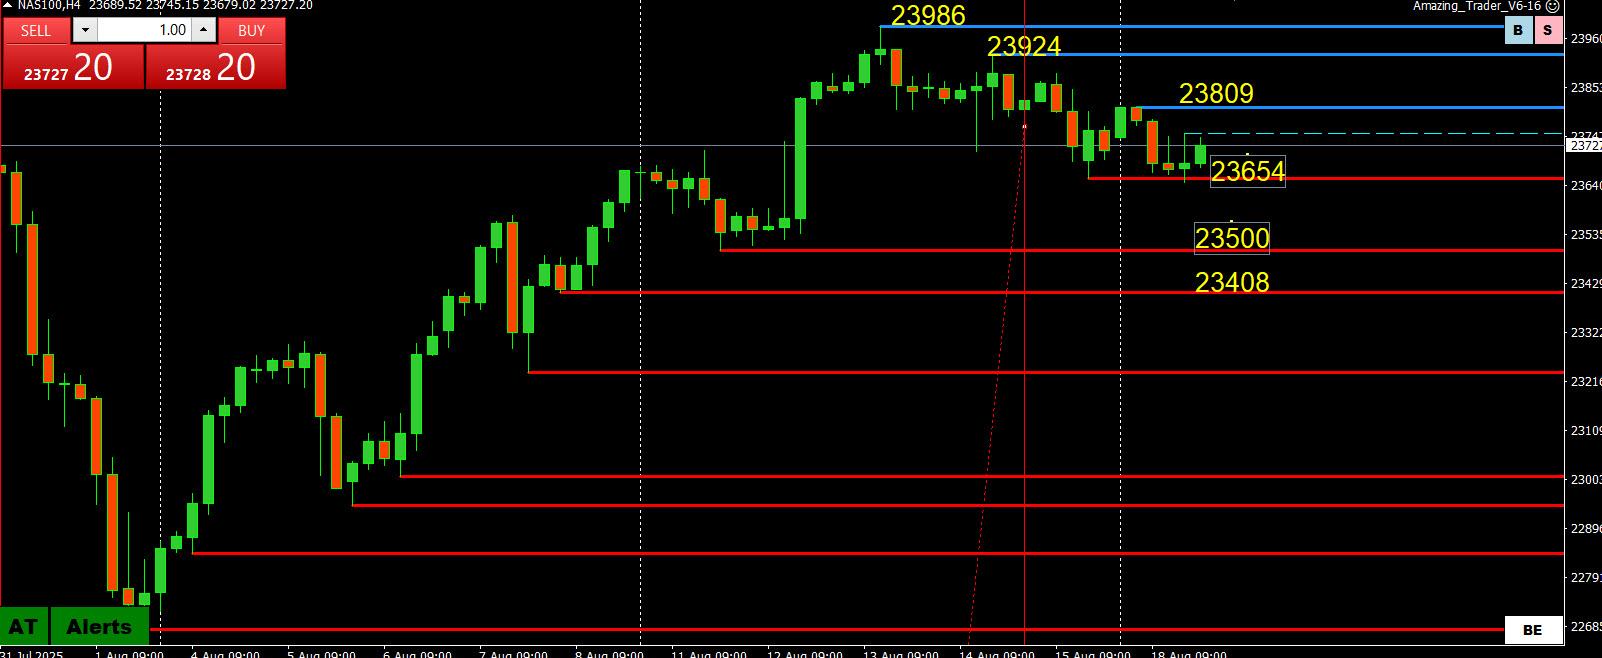
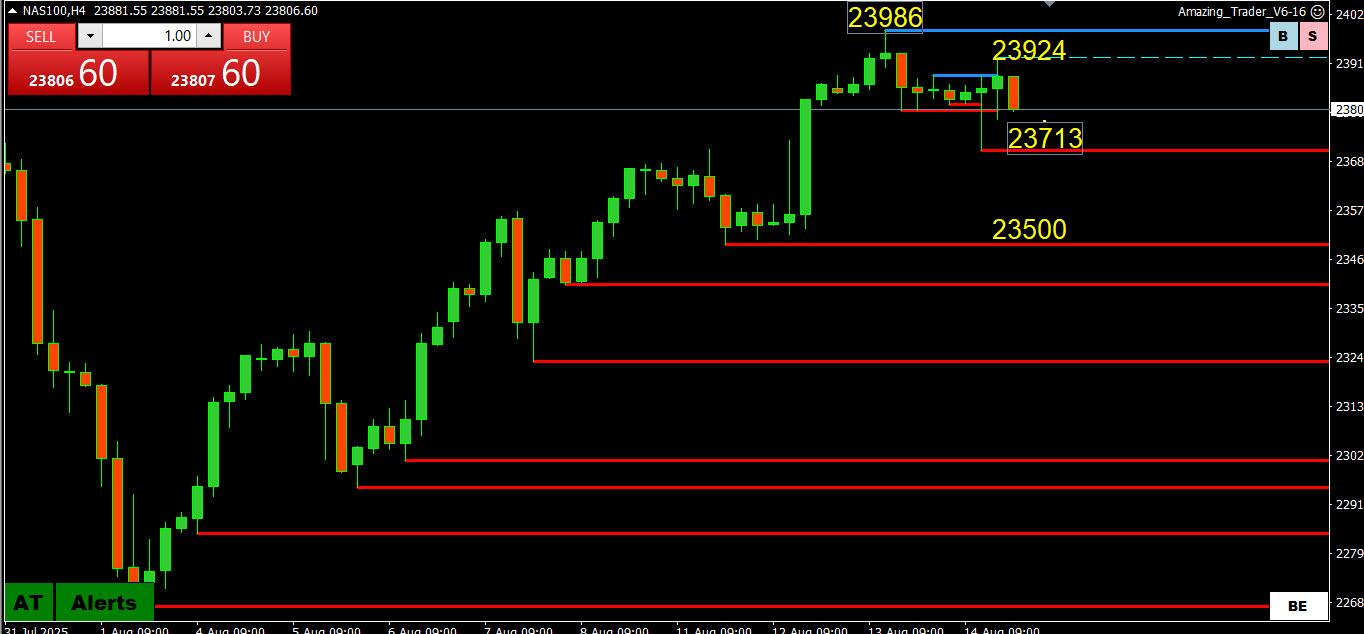
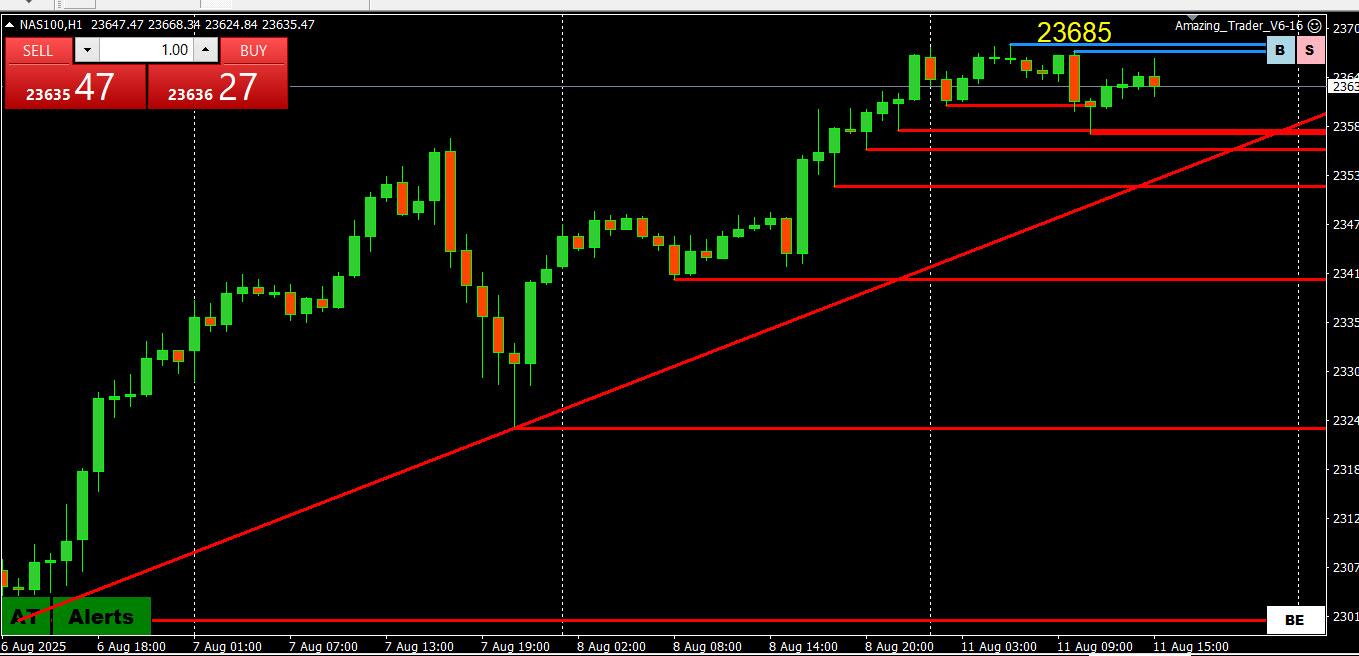
NAS100 (NASDAQ)
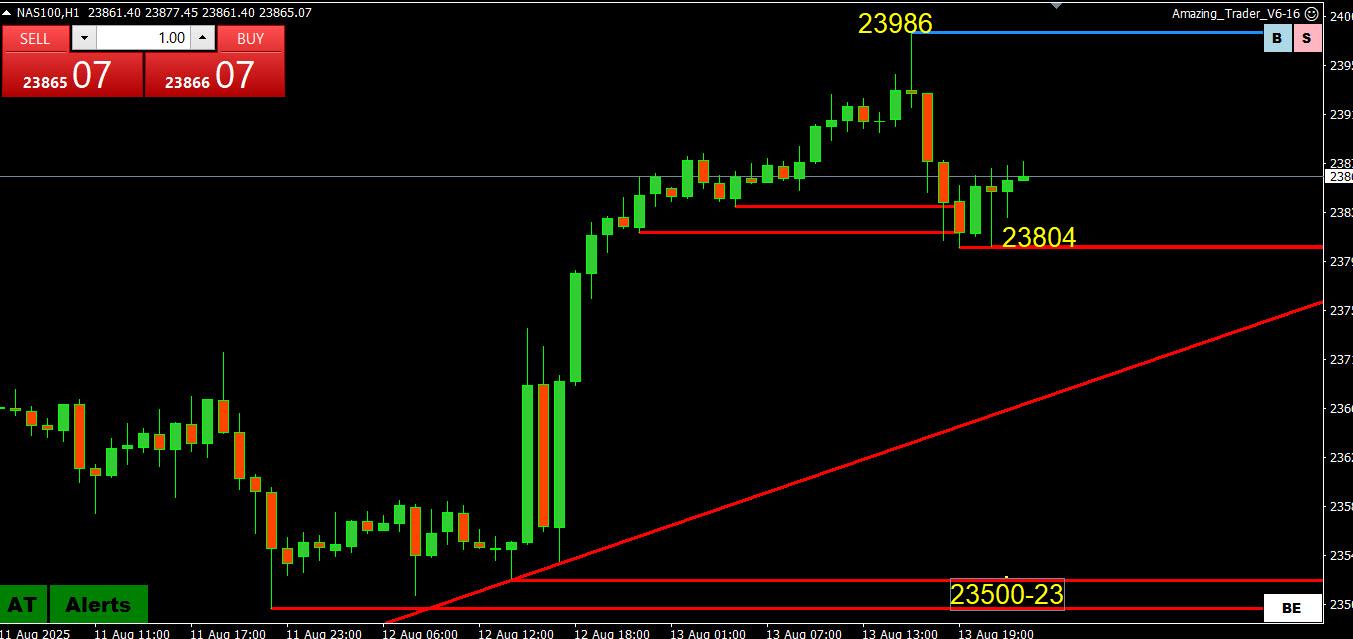
Passing its first Day after a breakout test by trading above its former 23729 high.
So keeps its strong bid while above 23729 but the spike high to 23986 and looming 24000 level argue for a risk of a breather. However, a breather has not been in the NAS dictionary but still worth noting.
NAS100 1 HOUR CHART
 August 13, 2025 at 9:07 am #28904
In reply to: Forex Forum
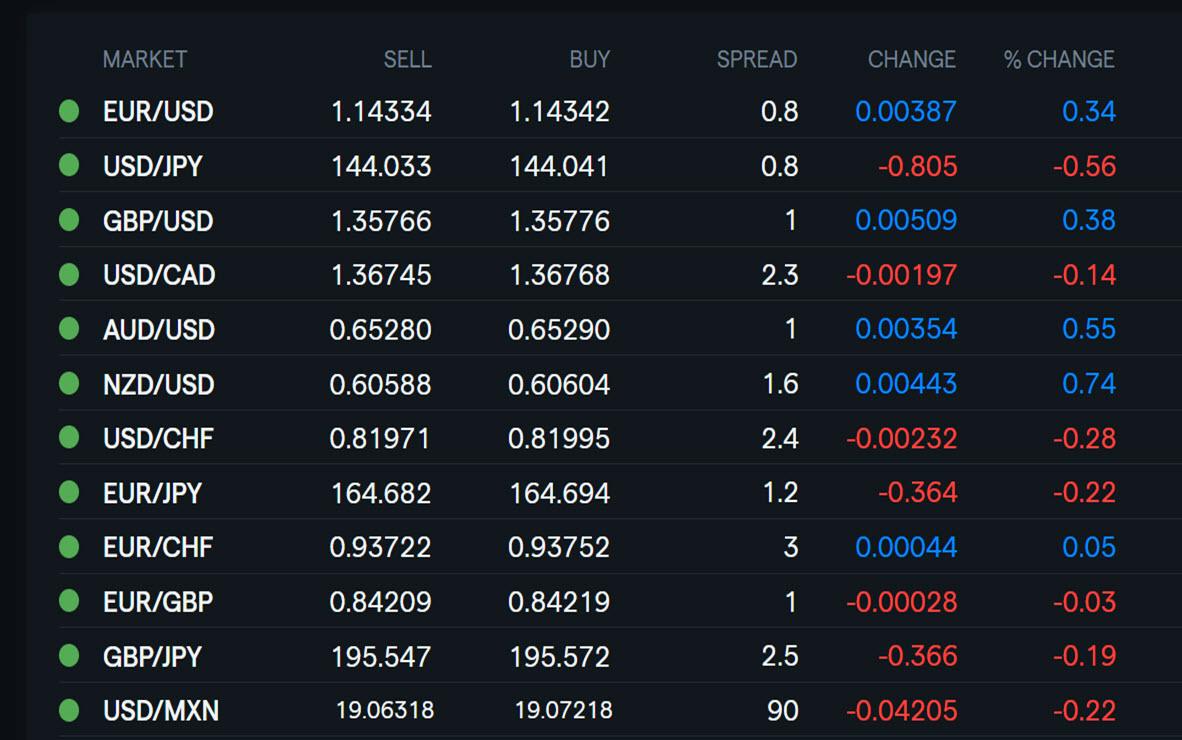
Using my platform as a Heatmap shows.
… the dollar is trading weaker, extending its slide following Tuesday’s release of US CPI
– EURUSD has regained 1.17+
– USDJPY is trading soft below 148
– GBPUSD is trading firm above 1.35Gold is firmer, testing resistance at 3364
US stocks holding firm as SP500 and Nasdaq etrend trade in record high territory
US bond yields slip
Bitcoin’s focus is on 120,000
 August 12, 2025 at 7:56 pm #28896
In reply to: Forex Forum
August 12, 2025 at 4:47 pm #28875In reply to: Forex Forum
August 11, 2025 at 8:25 pm #28810In reply to: Forex Forum
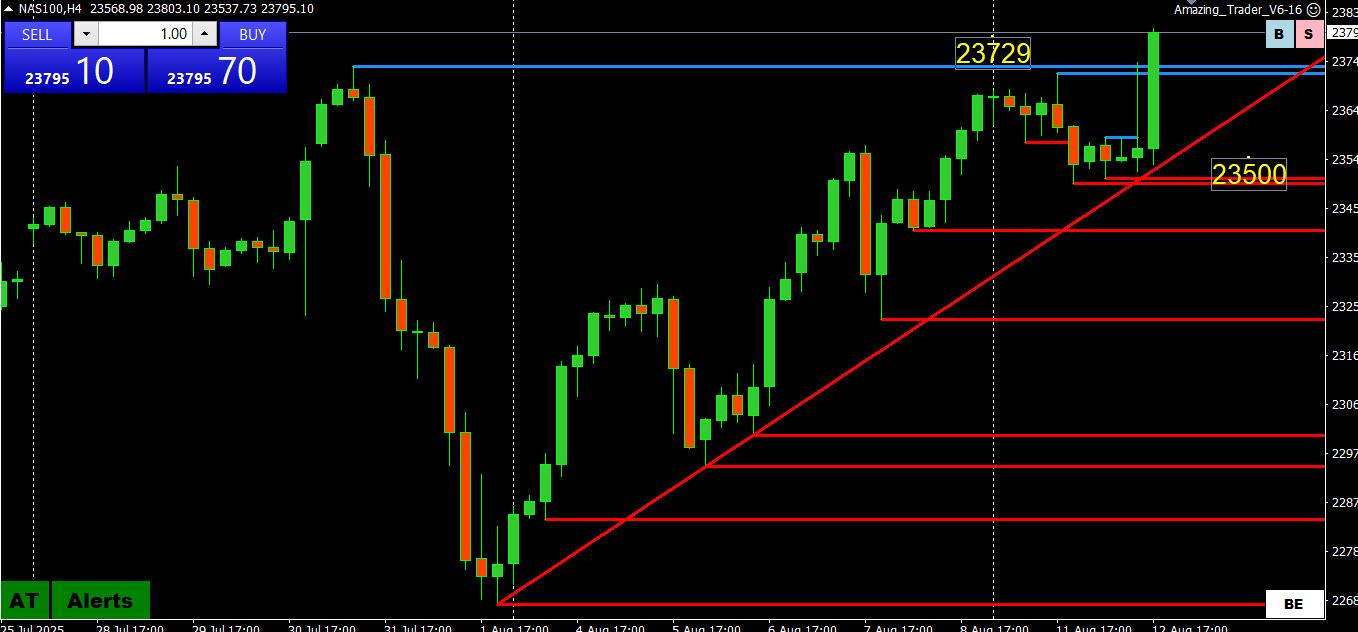
NAS100 (NASDAQ)
Nothing goes up forever but with NAS100 betting on a top has been a losing wager.
With that said, we can only go by what charts are showing and that is a pause just shy of the record 23729 high.
Below 23579 )just broken) would dent upward momentum, below 23407 would raise the risk of a top (for now) and below 23234 would confirm it.
NAS100 4 HOUR CHART
 August 11, 2025 at 12:46 pm #28783
In reply to: Forex Forum
August 8, 2025 at 9:53 pm #28703In reply to: Forex Forum
Stocks rose on Friday, led by the tech sector, as the major averages ended the week with solid gains.
The Nasdaq Composite jumped 0.98% for a record close of 21,450.02. The tech-heavy index hit a fresh all-time intraday high earlier in the day. The S&P 500 added 0.78% and ended at 6,389.45, a hair’s breadth shy of a record close. The Dow Jones Industrial Average climbed 206.97 points, or 0.47%, closing at 44,175.61. CNBC
August 8, 2025 at 4:57 pm #28693In reply to: Forex Forum
August 7, 2025 at 8:21 pm #28619In reply to: Forex Forum
August 7, 2025 at 2:38 pm #28598In reply to: Forex Forum
August 6, 2025 at 8:46 pm #28543In reply to: Forex Forum
August 6, 2025 at 3:31 pm #28525In reply to: Forex Forum
August 5, 2025 at 8:58 pm #28482In reply to: Forex Forum
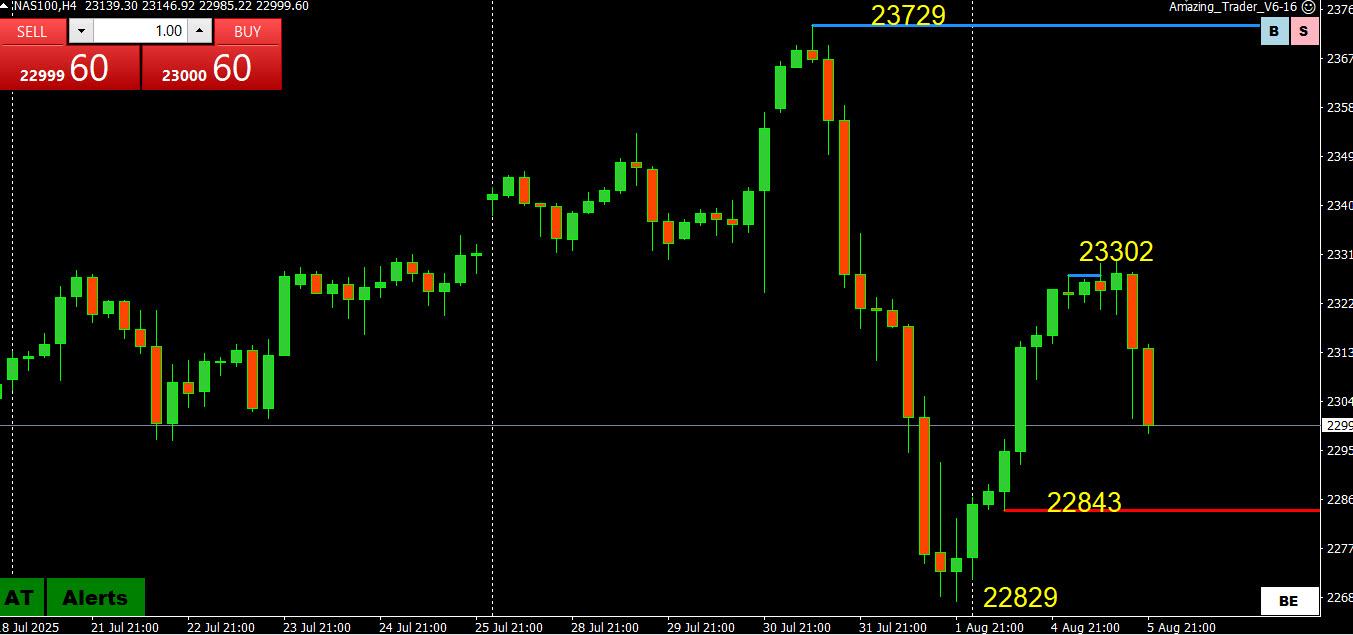
NAS100 (NASDAQ)
Same question as US500
Retracement or is the low in?
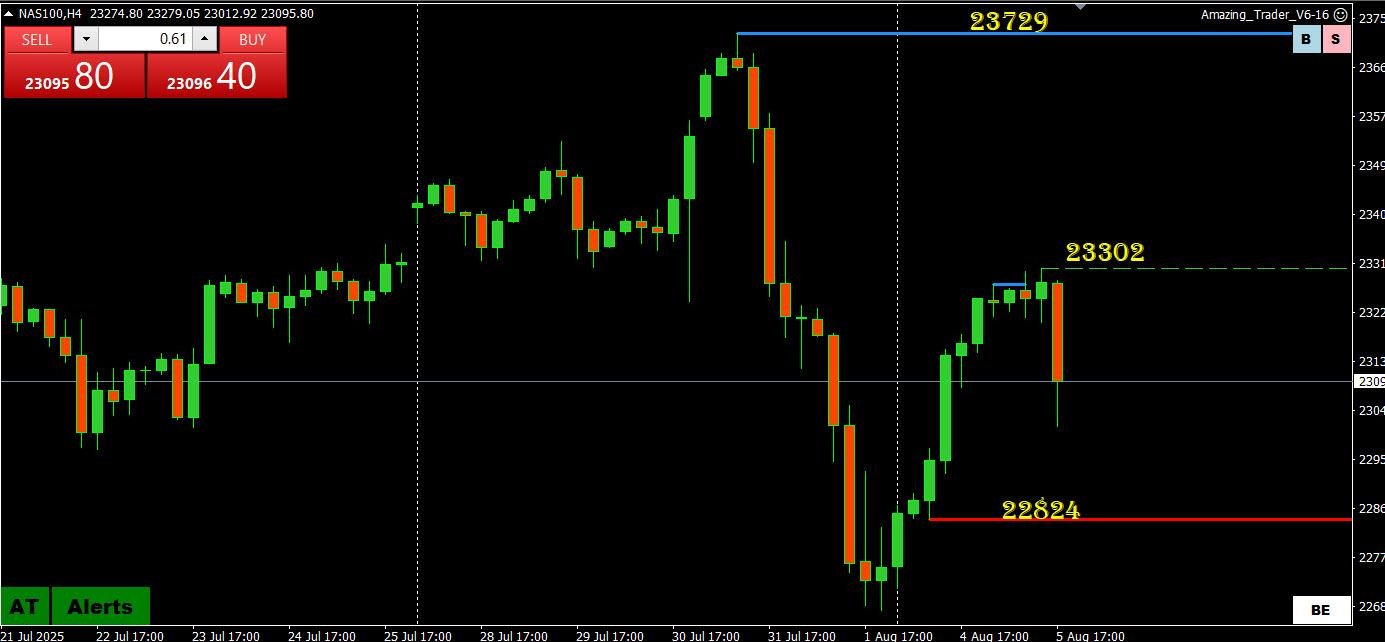
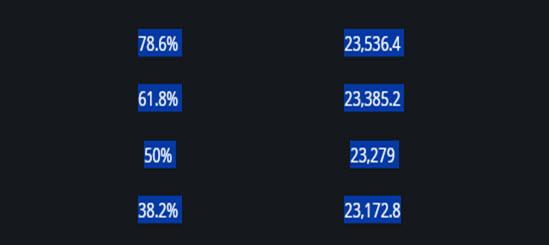
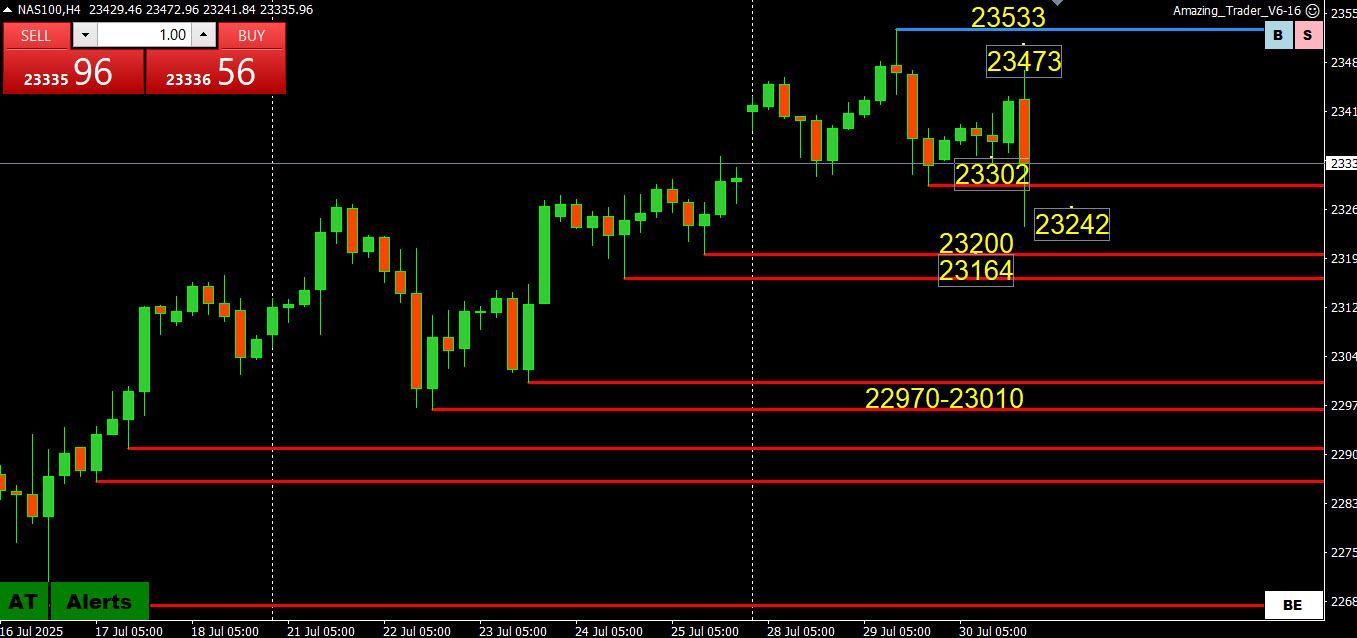
Tuesday high at 23302 was below 23385 = 61.8% so still in a retracement mode.
On the upside, dependent in 22843 holding to keep hopes for more than a retracement alive… below it pouts 22644-77 back on the radar.
NAS100 4 HOUR CHART
 August 5, 2025 at 4:31 pm #28476
In reply to: Forex Forum
August 5, 2025 at 1:31 pm #28445In reply to: Forex Forum
August 5, 2025 at 12:17 pm #28437In reply to: Forex Forum
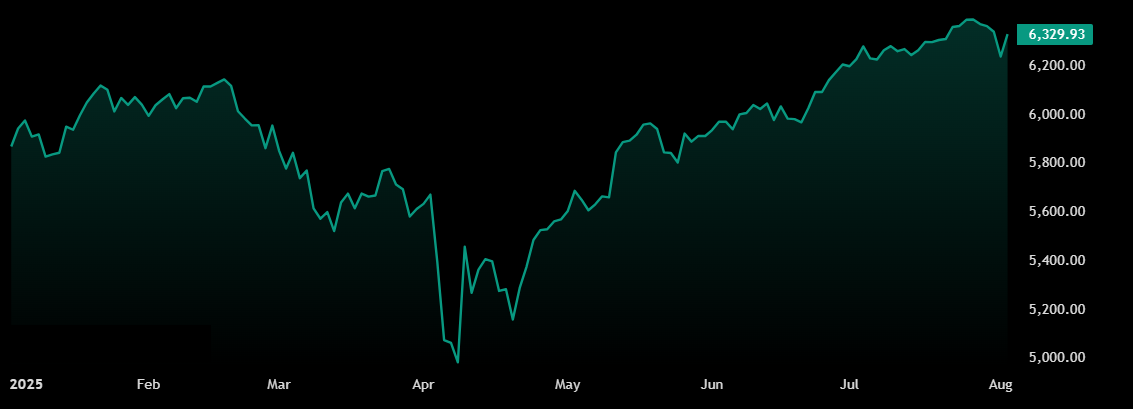
S&P and Nasdaq Futures Rise
S&P 500 futures rose 0.3% and Nasdaq 100 futures gained 0.4% on Tuesday, while the Dow Jones hovered around the flatline, following strong gains of over 1% in the previous session.
Investor sentiment remained upbeat, supported by corporate earnings and growing expectations of Federal Reserve rate cuts.
Palantir shares surged nearly 6% in premarket trading after the company raised its annual revenue forecast for the second time this year.
Pfizer advanced 2.4% after beating both earnings and revenue estimates.
In contrast, Caterpillar fell 3.6% following an earnings miss, and Vertex Pharmaceuticals tumbled 13.8% after announcing it would not move forward with late-stage trials for its next-generation pain treatment.
Meanwhile, megacap tech stocks were mostly higher before the opening bell, with Nvidia up 0.6%, Microsoft 0.5%, Apple 0.4%, Amazon 0.5%, Meta 0.3%, Broadcom 0.5%, and Tesla 0.4%, while Alphabet was little changed.
SP 500 Chart
 August 4, 2025 at 7:32 pm #28411
In reply to: Forex Forum
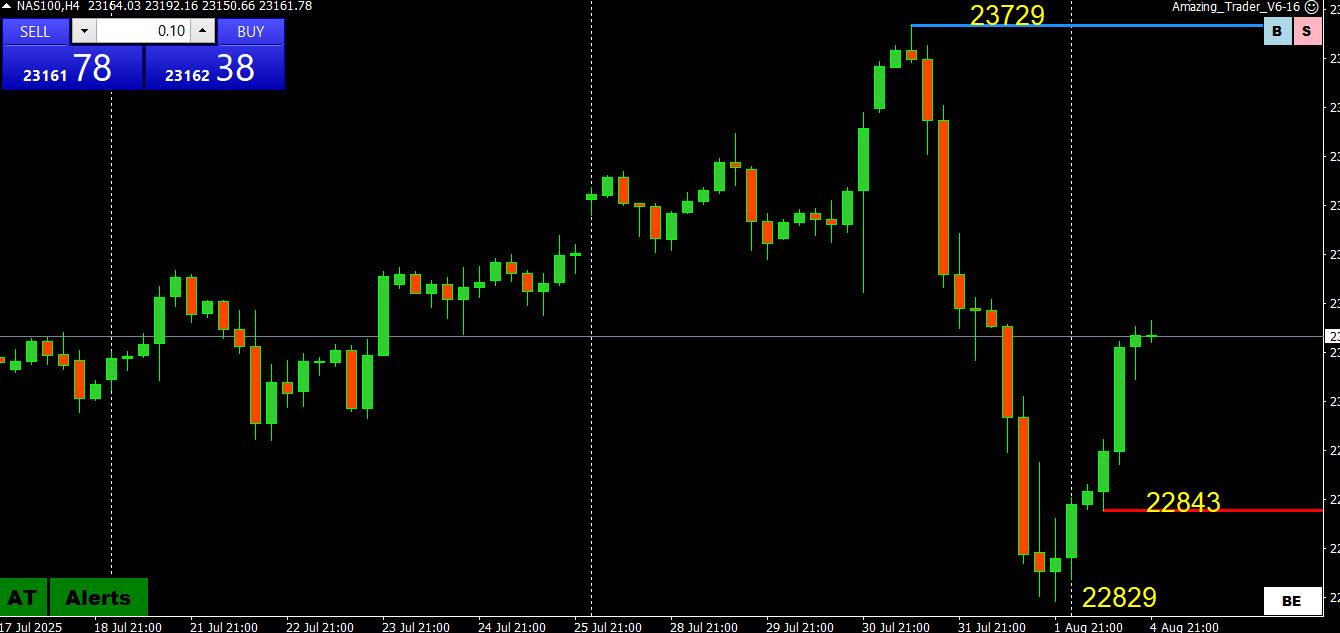
NAS100 (NASDAQ)
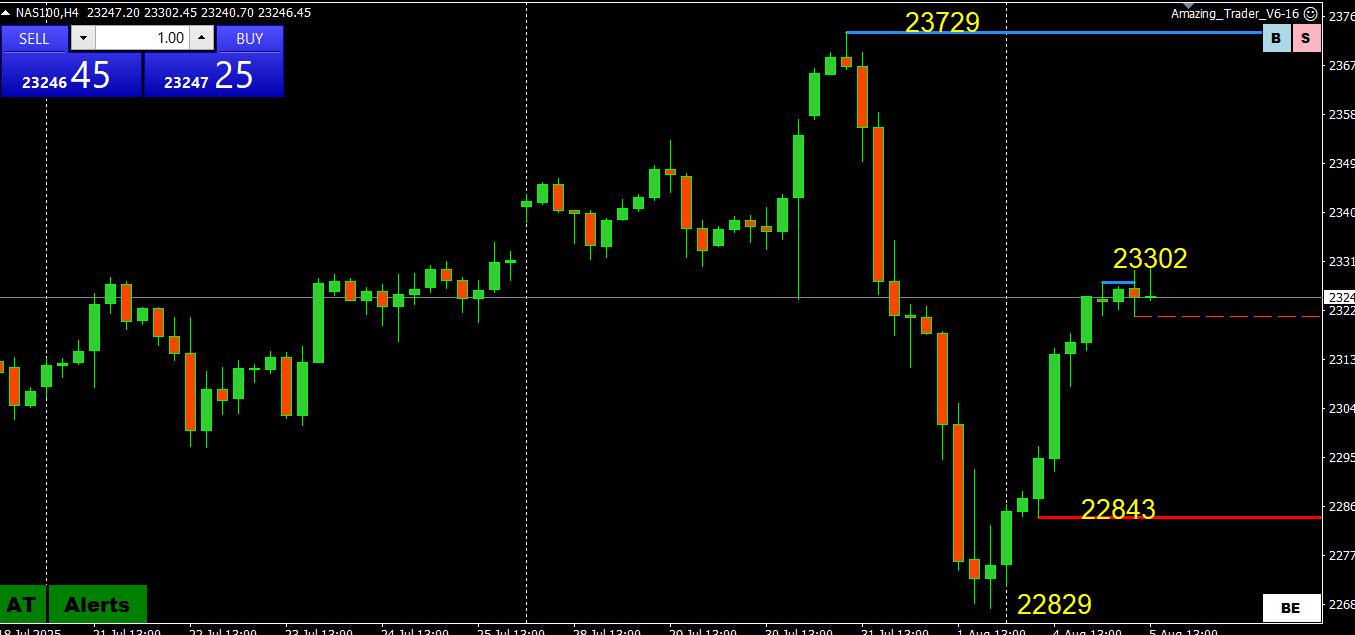
Is the low in or just a retracement after the strong bounce off Friday’s low
Jury is out with little in the way of obvious resistance so use FIBOS as potential levels (scroll below)
Those hoping the low is in need 22843 (red AT line) to hold to keep those hopes alive.
NAS100 4 HOUR CHART
FIBOS for 23729 => 22829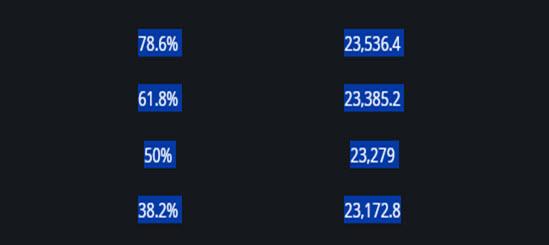 July 31, 2025 at 8:22 pm #28262
In reply to: Forex Forum
July 30, 2025 at 9:24 pm #28202In reply to: Forex Forum
July 30, 2025 at 7:56 pm #28195In reply to: Forex Forum
July 29, 2025 at 11:49 pm #28128In reply to: Forex Forum
Strategy Acquires 21,021 Bitcoin, Now Holds 628,791 Coins: Why Is BTC Price Dropping?
Strategy (Nasdaq: MSTR, STRK, STRF, STRD), the largest corporate Bitcoin BTCUSDT holder, has made a bold move to strengthen its balance sheet. The Bitcoin treasury company announced on Tuesday, July 29, that it had closed its initial public offering of around 28 million shares of Variable Rate Series A Perpetual Stretch Preferred Stock (STRC) at a public offering price of $90, thus raising about $2.52 billion.
Strategy announced that the proceeds from the IPO of the newly formed vehicle were used to purchase 21,021 Bitcoins.“Strategy has acquired 21,021 BTC for around $2.46 billion at about $117,256 per Bitcoin and has achieved a BTC Yield of 25.0% YTD 2025. As of 7/29/2025, we hodl 628,791 BTC acquired for approximately $46.08 billion at around $73,277 per Bitcoin,” Michael Saylor, Chairman at Strategy, noted. Strategy Leads an Army of Corporate Investors in Bitcoin Accumulation Strategy’s STRC fundraising was the largest U.S. IPO in 2025 to date. The company has led an army of 282 corporations that have accumulated over 3.61 million Bitcoins to date, according to BitcoinTreasuries.
More institutional investors have implemented a Bitcoin treasury management system to beat inflation and macroeconomic uncertainties.Why Has BTC Price Faltered?
Bitcoin price is affected by a wide range of factors, both on-chain and external fundamentals. Although on-chain data shows an aggressive accumulation of Bitcoin by whale investors, short-term holders and spot traders have been expecting heightened volatility ahead of Wednesday’s FOMC statement and the Fed’s federal funds rate announcement.
According to market data from Coinglass, Bitcoin’s Futures Open Interest (OI) dropped by over 5 percent on CME to $16.9 billion, signaling mild panic selling.
Nonetheless, the overall BTC’s OI remained elevated compared to last quarter and year, thus signaling that a macro bullish outlook remains strong.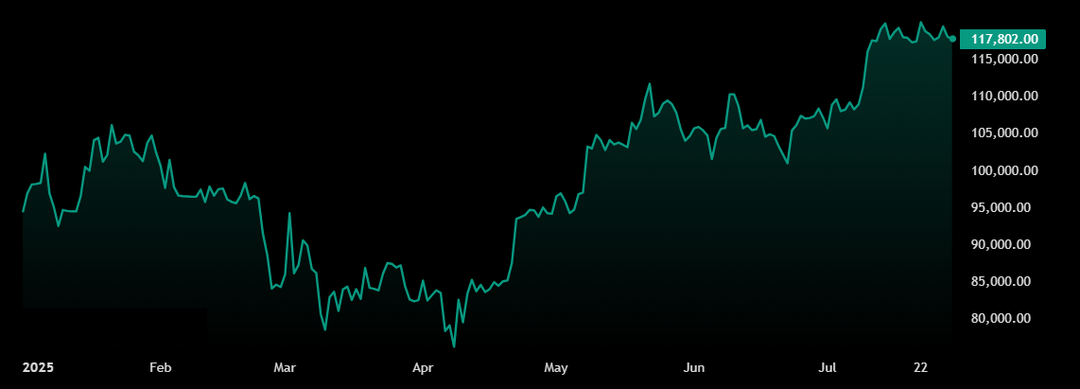 July 29, 2025 at 11:07 pm #28126
In reply to: Forex Forum
S&P 500 Breaks Winning Streak After U.S.-China Meeting Ends Without a Deal The Dow Jones Industrial Average fell more than 200 points on Tuesday, with investors considering a possible tariff extension for China and a fresh batch of corporate earnings.
U.S. and Chinese trade negotiators discussed potentially extending a tariff truce over two days of talks but haven’t yet come to an agreement, senior officials said Tuesday.
Treasury Secretary Scott Bessent and U.S. Trade Representative Jamieson Greer said they would report back Wednesday to President Trump, who will make the final decision on an extension for the truce set to expire on Aug. 12. The Dow fell 0.5%, or 204.57 points.
The S&P 500 declined 0.3%, ending its streak of six consecutive record highs, and the Nasdaq composite lost 0.4%. Some analysts say that investors are more focused on picking out the winners and losers from tariffs and newly minted trade deals, rather than the fears of a deep recession and runaway inflation that gripped markets months earlier.
The latest batch of earnings reports showed signs of tariff-induced stress for American corporations. Chrysler maker Stellantis said it expects a roughly $1.7 billion hit from tariffs this year. Consumer bellwether Procter & Gamble said shoppers were delaying purchases and searching for discounts.
Whirlpool shares declined 13% after the company slashed its outlook but said it would eventually benefit from tariff policies. Investors also parsed data that suggests the economy is weakening.
The goods-trade deficit shrank last month, as fewer goods traded in either direction across U.S. borders. Imports dropped more than exports, according to preliminary figures from the Commerce Department.
The Conference Board’s latest consumer data showed that Americans are feeling better about the economy but are still worried about tariffs and the labor market.
Elsewhere, the 10-year Treasury yield moved lower, falling to 4.329% from 4.418% on Monday.
Wall Street is also looking to the Federal Reserve’s interest-rate decision due Wednesday. Central bank officials are expected to hold rates steady, but a press conference from Fed Chair Jerome Powell following the decision could shed light on the Fed’s openness to cutting rates at its next meeting in September.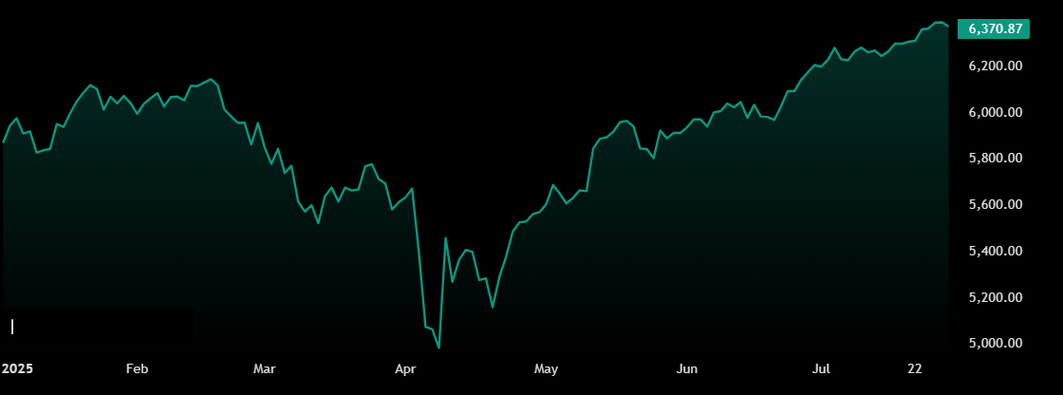
-
AuthorSearch Results





Search
© 2024 Global View