
-
AuthorSearch Results
-
June 13, 2025 at 5:26 pm #26267
In reply to: Forex Forum
Bitcoin clings to $105K as opinions diverge on oil price outlook
Key points:
· Bitcoin recovers from a trip below $103,000 with markets on edge over the Israel-Iran conflict.
· Oil steals the show on the day, but analysis is far from unanimous on the outlook.
· BTC price predictions see the rebound persisting, shaking off the likelihood of further losses.
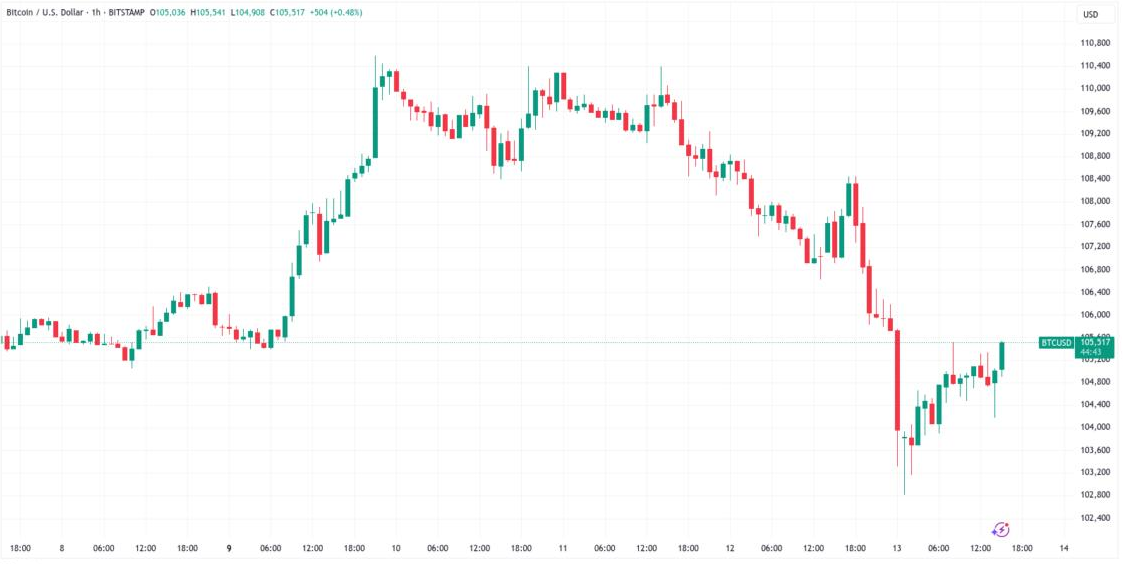
Bitcoin BTCUSD bounced past $105,000 around the June 13 Wall Street open as markets awaited cues from the Israel-Iran conflict.
Oil may yet see “final flush” after day of gains
Geopolitical tensions had sparked snap losses across crypto and stocks overnight, while oil soared and gold hit two-month highs.
Both the S&P 500 and Nasdaq Composite Index were down around 1% on the day at the time of writing.
Reacting, crypto commentators had mixed opinions over how a resurgent oil price might impact Bitcoin and altcoins going forward.
“Oil up. Gold up. Bitcoin down”
“Bitcoin ended up outperforming the other two over the first 48 hours in that situation. Will be interesting to see what happens here”
“Oil might have significant move down after this. So far it looks clear that they aren’t and won’t be targeting Iran’s oil facilities”
“Bitcoin is stored energy in digital form. Therefore, if energy prices rise, Bitcoin will be worth more in terms of fiat currency”
 June 13, 2025 at 1:46 pm #26253
In reply to: Forex Forum
Bitcoin Price Tumbles as Gold Rises. Why Crypto Is No Haven
Bitcoin fell early Friday as it reacted to heightened global tensions in the Middle East, dropping along with other so-called risk assets.
It remains to be seen what sustained effect the geopolitical tensions will have on cryptos’ recent momentum. Amazon.com and Walmart are the latest companies to consider issuing their own stablecoins, according to a Friday report by The Wall Street Journal.
It comes less than a month after U.S. banks JPMorgan Chase, Bank of America and Citigroup were also reported to be exploring issuing a stablecoin — a digital asset pegged to a fiat currency, typically the U.S. dollar.
The world’s largest crypto was down 1.9% over the past 24 hours to $105,061, according to CoinDesk. It dropped to as low as $103,274 overnight, for a loss of about 4% on a 24-hour basis, but has recouped some of those losses since, perhaps indicating crypto investors’ interest in buying on dips.
Israel launched a wide-ranging strike on Iran overnight, targeting the country’s nuclear program and military leadership. Oil prices jumped and markets fell. Futures tracking the S&P 500 were down 1.4% early Friday morning.
Ether and XRP were down 7.1% and 3.7%, respectively. Solana plummeted nearly 9%.
Gold, the ultimate haven asset, rose 1.1%.
Bitcoin has held up relatively well amid the tariff drama over the last couple of months, with some hailing it as “digital gold,” or a haven in uncertain times. Friday’s price move will likely dent those ideas.
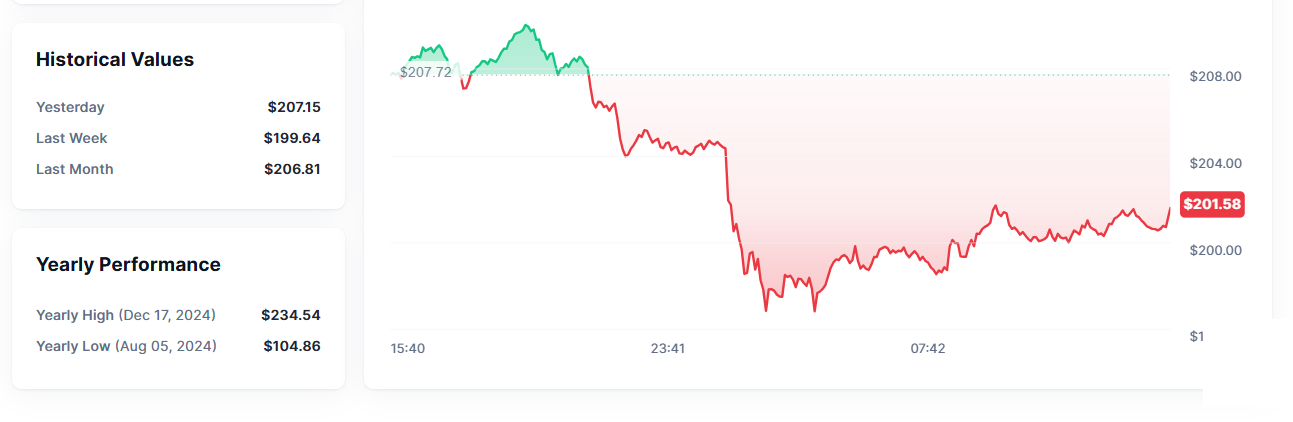
The total market value of cryptocurrencies fell to $3.22 trillion on Friday morning from a peak of $3.47 trillion late Wednesday as investors fled risk assets in response to the Israel-Iran conflict
CoinMarketCap 100 Index Chart
 June 13, 2025 at 12:06 pm #26241
In reply to: Forex Forum
BTCUSD – Bitcoin
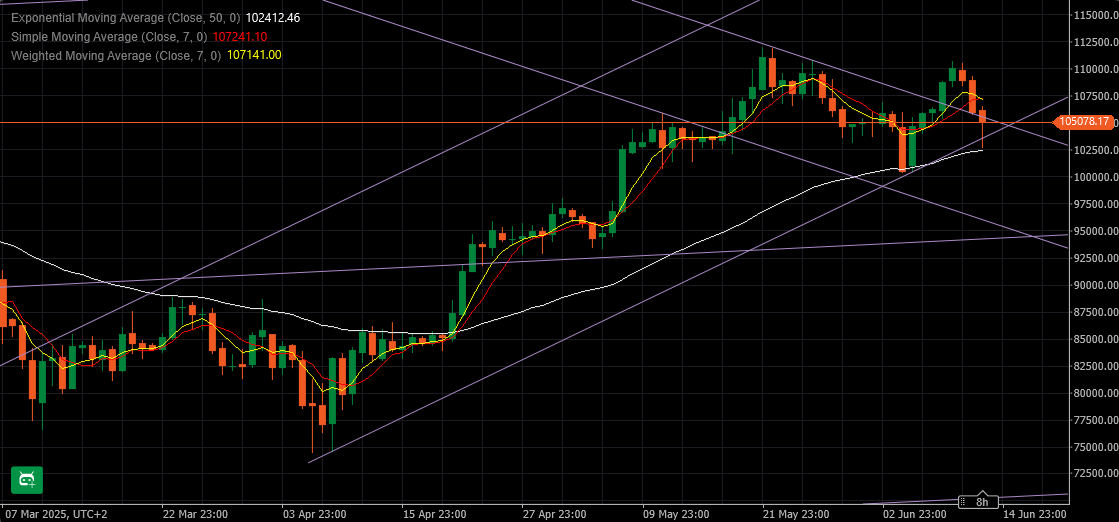
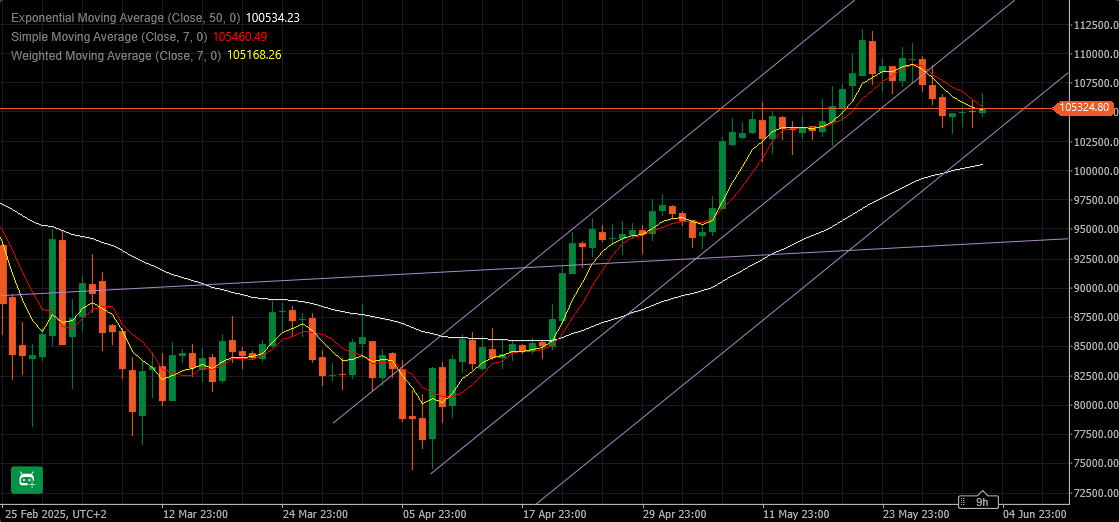
Bitcoin dived to 102.715 overnight but rebounded nicely so far.
That support line that you see on the chart that was briefly broken – on weekly chart it comes at 102.000 – so not even broken, yet.
If BTC manages to return to levels above 107.000 till tonight, this would be considered as just a dip.
Intraday it is pushing up right now, with resistances at:
105.500, 106.560 & 107.000
Supports: 104.445, 103.975 & 103.235
 June 12, 2025 at 7:06 pm #26205
In reply to: Forex Forum
BTCUSD
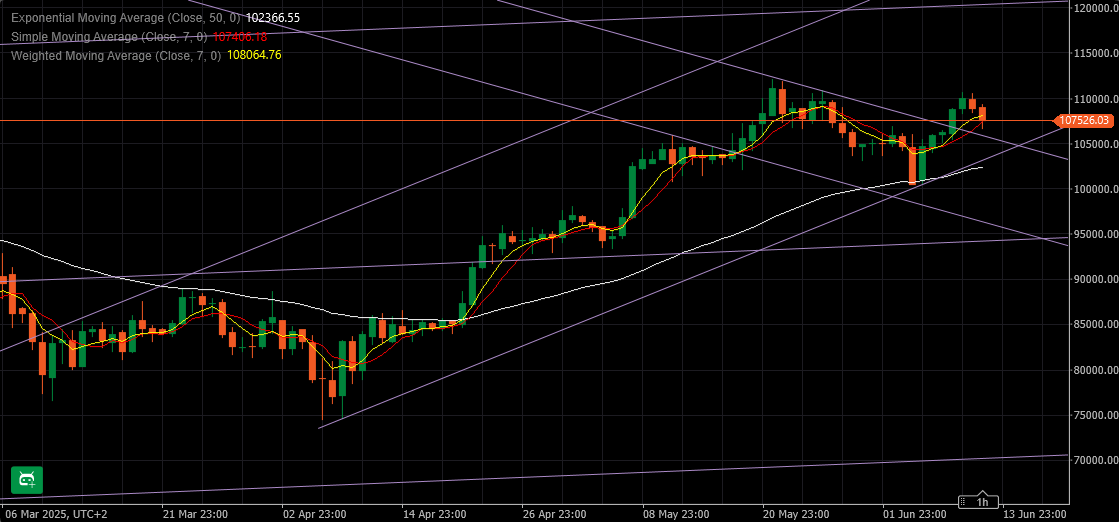
No change in view on Bitcoin from this morning, unless it closes tonight above 108.400 – in that case we would expect another push Up tomorrow.
For now we have just a dip towards support at 105.800 and we have to treat this situation as Bullish.
Close tonight below 107.200 would question that, but as long as above 105.800 continuation of the rally might be imminent.
 June 12, 2025 at 6:43 pm #26200
In reply to: Forex Forum
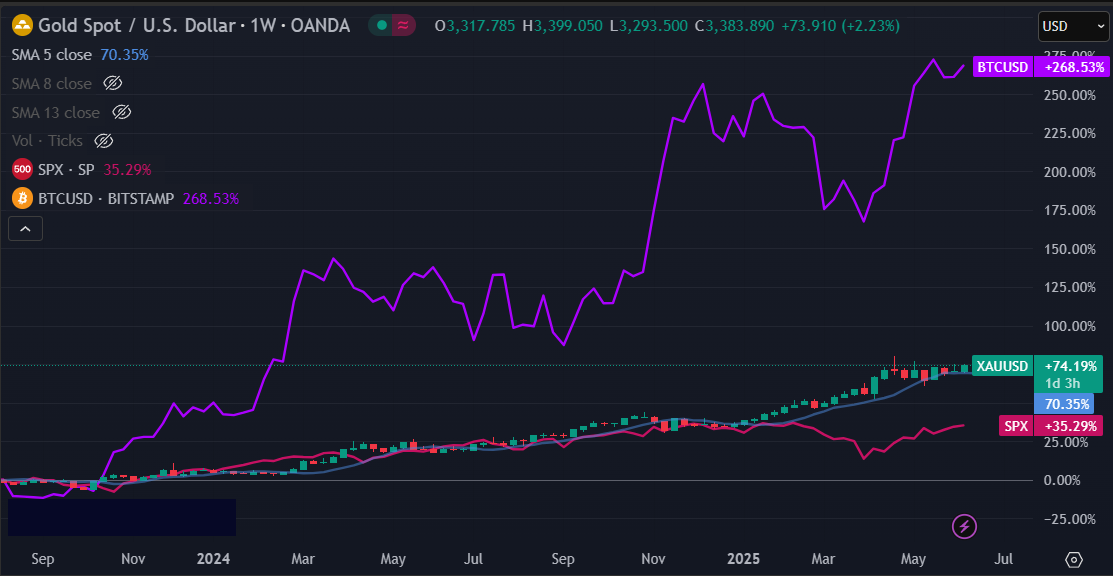
Here’s why stocks, bitcoin and gold are racing to record highs at the same time. It hasn’t happened in over 10 years.
U.S. stocks, bitcoin and gold on Thursday were all racing toward all-time highs – an unusual development, as investors attempt to navigate a new and uncertain era in global financial markets.
Their convergence on the path to record highs has occurred only once since 2014, when the S&P 500 SPX, bitcoin (BTCUSD) and gold (GC00) each closed at their respective peak levels on March 7, 2024, according to the Dow Jones Market Data
However, the catalyst this time looks to be different, with focus now on a signs that global investors want to trim their exposure to U.S. assets in President Donald Trump’s second term. His policy agenda has sparked trade uncertainty around the world, while domestically it looks poised to add to the U.S. deficit.
A common thread underpinning the recent strength in bitcoin, gold and U.S. stocks has been a very steep downward trend this year in the U.S. dollar
In general, it has been rare for stocks SPX and gold (GC00) to approach all-time highs in tandem, with the former considered to be a risk-on asset
Bitcoin (BTCUSD) mostly has been perceived a risky asset, as well, and has typically moved in step with stocks over the past few years, though crypto bulls have argued that it could eventually become a store of value or itself a safe haven.
Bitcoin, gold and the S&P 500 were each near their respective record highs as Thursday’s trading kicked off. The S&P 500 had ended at 6,022.24 on Wednesday, roughly 2% away from its record close of 6,144.15 on Feb. 19, according to FactSet data. Bitcoin traded at around $107,032 on Wednesday afternoon, about 4.4 % away from its all-time high of $111,986 reached on May 22. Front-month gold futures traded at around $3,386.50 early Thursday, about 0.7% below the record high of $3,411.40 hit on May 6.
 June 12, 2025 at 4:20 pm #26197
In reply to: Forex Forum
Bitcoin bulls halt $4K BTC price dip as US dollar hits new 3-year lows
Key points:
· Bitcoin hits its anticipated $107,000 low before heading higher as US inflation data boosts bulls.
· US dollar strength suffers as inflation continues to slow beyond expectations.
· BTC price expectations include new all-time highs before the end of the month.
Bitcoin BTCUSD bounced near $107,000 at the June 12 Wall Street open as slowing US inflation data punished the dollar.
Fresh strength followed promising numbers from the US Producer Price Index (PPI), which came in below expectations to show the lowest increase since September 2024.
That trend itself repeated results from the Consumer Price Index (CPI) the day prior — a double tailwind for crypto and risk assets.
The Fed has remained hawkish in its stance on policy for 2025, however, despite protests from US President Donald Trump.
A look at the latest data from CME Group’s FedWatch Tool now shows markets pricing in the next Fed rate cut at its September meeting. The June 18 meeting of the Federal Open Market Committee (FOMC) remains tipped to offer no change in rates.
As a result of the inflation numbers, US dollar strength took a fresh hit, with the US dollar index (DXY) dropping to its lowest levels since March 2022.
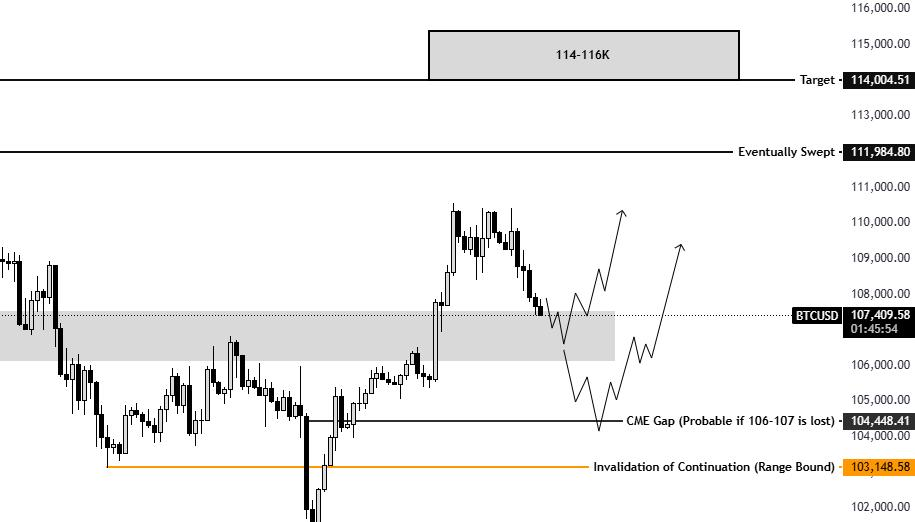
$116,000 June BTC price target in play
Bitcoin traders were meanwhile uncertain about short-term BTC price action after BTCUSD fell nearly $4,000 in 24 hours.
 June 12, 2025 at 1:30 pm #26185
In reply to: Forex Forum
June 12, 2025 at 1:26 pm #26183In reply to: Forex Forum
June 11, 2025 at 12:43 pm #26117In reply to: Forex Forum
June 11, 2025 at 11:44 am #26110In reply to: Forex Forum
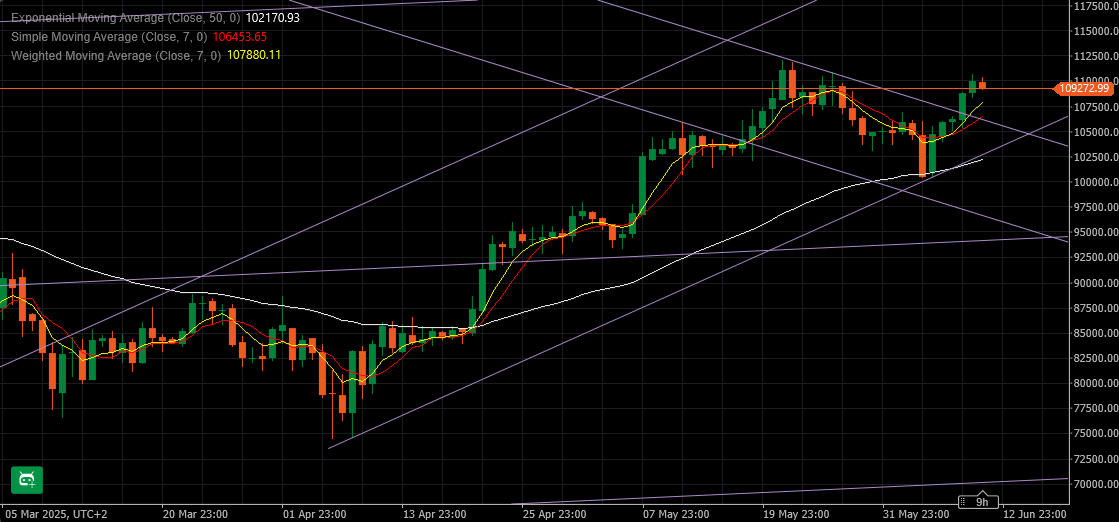
BTCUSD
Bitcoin came close to resistance at 110.800 but stayed short of it.
Now it is most important for Supports to hold if we want to see it any higher and soon.
Supports: 108.350, 108.000 & 106.200
Right now BTC is probing lower, but if this wave finds a footing just above 109.000, that might turn North fairly quick.
Do not be naive trying to figure out the top of BTC – you might end up with an un existing margin 🙂
 June 10, 2025 at 2:40 pm #26068
In reply to: Forex Forum
Meta’s Bitcoin rejection means Big Tech is still skeptical
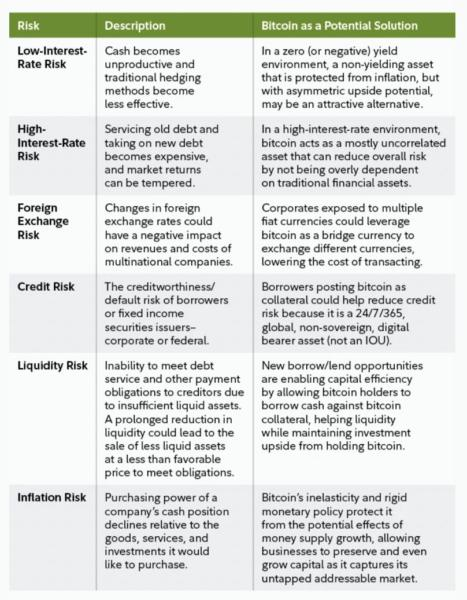
Strategy became the first publicly traded company to adopt Bitcoin as its primary treasury reserve asset in August 2020, but not many major tech firms have followed since.
Treasury reserves, sometimes called cash reserves, are held by corporations to fund short-term or emergency obligations. These are typically cash or cash equivalents like money market funds or three-month US Treasury bills.
The social media giant Meta keeps $72 billion in liquid assets in its reserve. But at its annual meeting on May 28, shareholders turned back a proposal to assess whether Bitcoin BTCUSD might qualify as a future treasury reserve asset. The proposal was dismissed by a ratio of 1,221 to 1.
That rejection in itself is not so surprising. Despite growing corporate Bitcoin adoption, Big Tech and most mainstream corporations remain cautious. US tech giant Microsoft also voted down similar proposals in December 2024.
Meta’s failed Bitcoin proposal, rejected by an overwhelming majority, raises questions about institutional readiness to adopt crypto.
Bitcoin’s volatility weakens its treasury asset case
This could all just be a misunderstanding. Crypto partisans may have failed to realize that corporate treasuries are more like emergency funds: to be used in the event of natural disasters or pandemics or to support day-to-day business operations, but not as a platform for speculative investing.
 June 10, 2025 at 11:21 am #26050
In reply to: Forex Forum
Trade Views Marginally Lift Wall Street Pre-Bell; Asia Choppy, Europe Off
Wall Street futures pointed marginally higher pre-bell Tuesday as investors awaited developments in China-US trade talks underway in London, amid a general lack of fresh market catalysts.
In the futures, the S&P 500 rose 0.1%, the Nasdaq inclined 0.1% and the Dow Jones was flat.
Asian exchanges traded unevenly higher overnight, while European bourses inched lower midday on the continent.
Casey’s General Stores (CASY) rose 10.6% pre-bell after the US midwest- and southern states-based convenience store chain posted solid fiscal Q4 results and issued upbeat guidance late Monday.
On the economic calendar, the National Federation of Independent Business (NFIB) Small Business Optimism Index rose to 98.8 in May from 95.8 in April, but still struck below the 100-mark that separates optimism from pessimism.
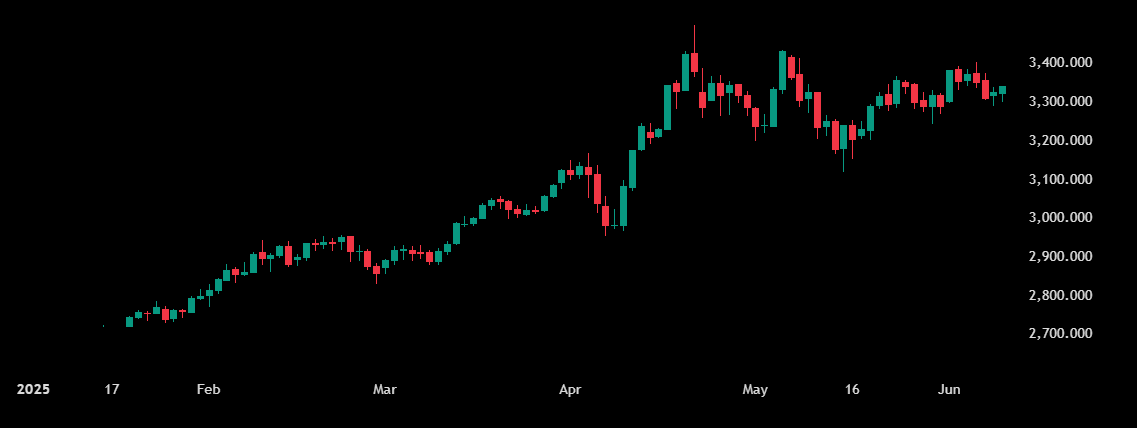
In premarket action, Bitcoin traded at $109,418, West Texas Intermediate crude oil traded higher at $65.62, and 10-year US Treasuries offered 4.45%. Spot gold traded for $3,334 an ounce.
Gold
 June 9, 2025 at 2:53 pm #26013
In reply to: Forex Forum
Strategy adds 1,045 Bitcoin for $110M in latest purchase
Strategy has acquired $110.2 million worth of Bitcoin as the price trades near its all-time high level.
According to a Monday US Securities and Exchange (SEC) filing, Strategy acquired 1,045 Bitcoin (BTC) at an average price of $105,426 per coin. The company now holds 582,000 BTC acquired for about $40.8 billion at an average price of around $70,086 per BTC.
The announcement follows Strategy co-founder and executive chairman Michael Saylor hinting at the purchase on June 8. The buy marks the ninth consecutive week that Strategy has acquired Bitcoin.
News of the latest purchase comes as Bitcoin approaches its all-time high. According to CoinMarketCap, Bitcoin traded at $107,640 at the time of writing, just 3.9% lower than the all-time high of about $112,000 reported in May.
 June 8, 2025 at 3:22 pm #25981
In reply to: Forex Forum
BTCUSD (BITCOIN)
Momentum: Pointing up BUT
Needs solid break of 106031 to confirm shift in risk to the upside
Above 106850 (use 107000 as well) would put 110718-111333 on the radar
On the downside, keeps a bid while above 103954-105000
Below 103954 would break the momentum and shift risk the other5 way.
BTCUSD (BITCOIN) 4 HOUR CHART
 June 8, 2025 at 2:11 pm #25980
In reply to: Forex Forum
BTCUSD
There are lots of talks around the net about Bitcoin surge in last 3 days:
– “Is this a Bear Trap?”
– “BTC reclaimed 105K – start of the new rally”
– “Once over 106K it will fly”…
But what we really have here right now – let’s talk about what we see and not what we wish for.
There is a downward channel starting at 21.05. and there is a “hypothetical “ upward channel trend line…
Resistance comes at 106.985 for tomorrow – both lines intersecting at that level, which gives it a special strength and meaning.
If BTC manages above it, we will talk about possible start of the new rally.
However if it fails there, BTC is going to dive below 100K and road to 95K would be wide open.
So this move up might be just a confirmation of a downtrend resistance line after all….
 June 8, 2025 at 1:55 pm #25979
In reply to: Forex Forum
This Week’s Biggest Gainers and Losers as BTC Price Reclaims $105K
Bitcoin’s gradual ascent continued in the past 24 hours, as the asset managed to bounce above $105,000 and even challenged $106,000 briefly.
Since most altcoins are quite sluggish on a daily scale, we will examine in more detail their weekly performances, where TAO and CRO stand in one corner, while HYPE, LEO, ICP, and TRX are in the other.BTC Above $105K
The world’s largest cryptocurrency tried to break out at the beginning of the business week from its consolidation range but was stopped at $106,000 and $106,500 on Monday and Tuesday. The following rejections drove it south to the lower boundary, but the bulls went on the offensive once again on Thursday.
However, bitcoin was stopped once again at $106,000, but this time, the correction was a lot more violent. Perhaps influenced by theongoing spatbetween US President Trump and Tesla CEO Musk, BTC’s price tumbled hard and went to a multi-week low of $100,400 (on Bitstamp).
As it came close to a breakdown below the coveted $100,000 level, the situation reversed and bitcoin started to recover some ground. By Friday noon, it had rebounded to around $105,000. Slightly more volatility followed, but BTC was ultimately stopped at $106,000 yesterday and now trades around $500 lower.
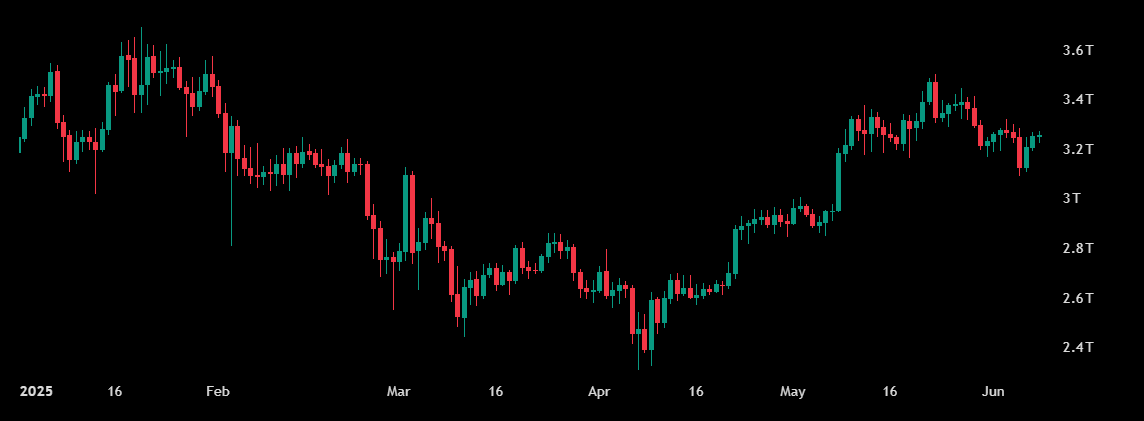
Its market capitalization has risen to just shy of $2.1 trillion, while its dominance over the alts stands tall at 61.5%.Alts Up and Down
The weekly scale shows that HYPE has emerged as the top gainer, having surged by almost 9%. As a result, the high-flyer now sits above $35, just less than $5 away from its recent peak. ICP follows suit with an 8% weekly increase, while LEO, TRX, and AAVE are next.
On the opposite scale are TAO (-11%), GT (-5.3%), and CRO (-5.2%). SOL, DOGE, ADA, AVAX, and SHIB are also about to close the weekly candle in the red.
Total Crypto market cap
 June 7, 2025 at 2:21 pm #25969
In reply to: Forex Forum
Is a Bitcoin price rally to $150K possible by year’s end?
Key takeaways:
· A 2021-style bearish divergence on the weekly chart points to a potential 50%+ correction toward $64,000.
· Bitcoin must reclaim its parabolic trendline soon or risk ending its bull cycle before reaching the $150,000 target.
Bitcoin’s BTCUSD surge to a record $112,000 sparked renewed hopes for a $150,000 target by year-end, but its swift correction below $105,000 is testing that bullish narrative.
Is Bitcoin painting a bearish reversal setup?
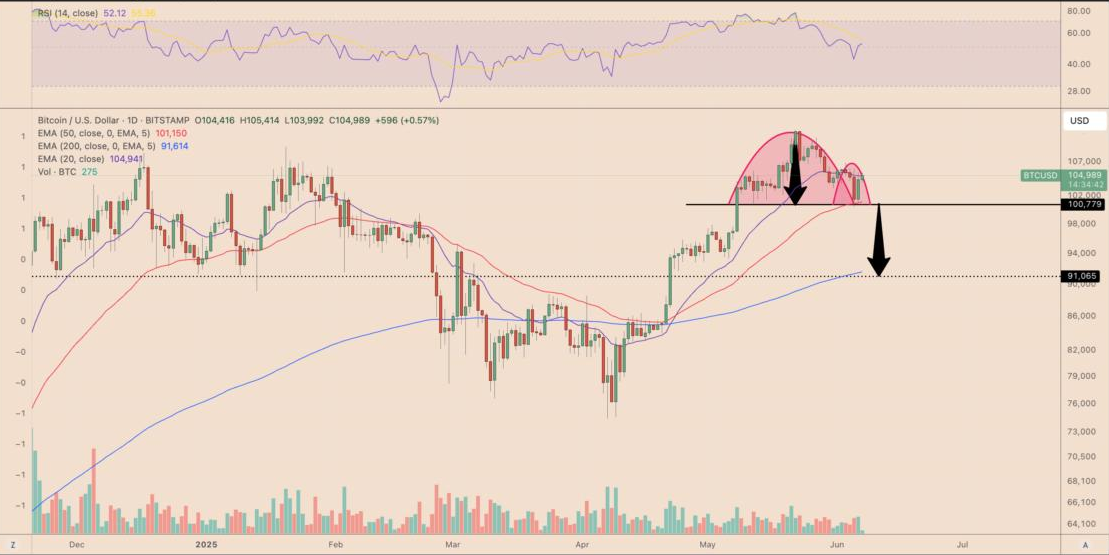
Bitcoin is painting what appears to be an inverse cup-and-handle pattern, with its neckline near $100,800 acting as current support. As of June 7, the price has entered the handle-formation stage, eyeing a breakdown below the neckline.
2021 fractal suggests BTC won’t hit $150,000 in 2025
At a broader timescale, Bitcoin’s weekly chart is flashing a familiar warning.
A bearish divergence has formed between price and RSI, mirroring the 2021 cycle top, when RSI trended lower despite higher price highs. That divergence preceded a 61% correction toward its 200-week EMA (the blue wave) and below.
A similar structure is now visible, with a divergence forming just below the $112,000 high and a projected pullback target near the 200-week EMA at around $64,000, marking a potential 52% decline.
This historical setup casts doubt on Bitcoin reaching the widely discussed $150,000 target by the end of 2025, especially if the divergence confirms a broader market top similar to past cycles.
 June 6, 2025 at 4:11 pm #25950
In reply to: Forex Forum
Bitcoin rebounds to $105K, but is a ‘bull trap’ underway?
Key takeaways:
· Leveraged bets and a bull trap setup drove Bitcoin’s drop to $100K.
· Recession fears and custody doubts keep Bitcoin from reclaiming $110K.
Bitcoin BTCUSD climbed toward $105,000 on June 6 after plunging to its lowest level in four weeks the previous day.
Traders questioned whether the sharp decline had been coordinated, especially following reports that US President Trump and Chinese President Xi Jinping had resumed discussions over import tariffs.
The reasons behind Bitcoin’s sudden drop on June 5 might never be fully clarified. Still, several contributing factors emerged, including fears of a potential economic recession, continued uncertainty surrounding the US Strategic Bitcoin Reserves, and speculation that custodians might be engaging in re-hypothecation practices.
If these concerns are valid, a quick return to the $110,000 level appears unlikely.
According to some analysts, the drop to $100,430 on June 5 was mainly triggered by excessive bullish leverage from “degenerate” traders. These leveraged bets followed the liquidation of a large position held by the so-called Hyperliquid whale near $104,000.
While the public feud between Elon Musk and US President Donald Trump has drawn considerable attention, linking the dispute directly to Bitcoin’s decline is difficult. The S&P 500 closed down just 0.55% on June 5, a modest move that doesn’t suggest widespread market distress.
 June 6, 2025 at 8:27 am #25920
In reply to: Forex Forum
BTCUSD – Bitcoin
BTC bounced back from the support at around 100.500 ( with BTC it is never really exact one as range is way too big for some serious precision )
Resistances: 104.000, 104.700 & 105.300
Supports: 102.200, 100.500 & 98.000
Failure to overcome 104.700 would signal another push down on its way.
 June 5, 2025 at 5:38 pm #25896
In reply to: Forex Forum
BTCUSD – Bitcoin
And here we go – BTC is going into full correction, unless somehow 103.125 provides a support.
Below that one we have following supports:
101.350, 100.500 & 98.000
Resistances: 103.650, 104.400 & 105.265
I would like to see BTC take out today 103.125 to confirm Down move tomorrow – as right now this might be tricky
 June 5, 2025 at 12:51 pm #25874
In reply to: Forex Forum
Bitcoin supply shock? Percentage of BTC on exchanges nears 2018 levels
Key takeaways:
· Bitcoin’s percent supply on exchanges has dropped below 11% for the first time since 2018.
· Institutional adoption is accelerating BTC withdrawals from public exchanges.
· Trust in centralized platforms is shaky post-FTX.
Bitcoin’s BTCUSD percent supply on exchanges has dropped to near seven-year lows, falling below 11% for the first time since March 2018, according to Glassnode data.
The peak occurred around March 2020, when over 17.2% of the BTC supply was held on exchanges. Since then, over 6% of the total supply, or roughly 1.26 million BTC, has been withdrawn from exchange wallets.
Bitcoin’s Holding rises to a two-year high
Bitcoin investors are holding onto their coins at the highest level in over two years, according to the latest Exchange Flows to Network Activity Ratio chart by CryptoQuant.
The ratio, measuring the volume of BTC flowing to exchanges relative to on chain network activity, has fallen to its lowest reading since early 2023, signalling subdued exchange deposits despite rising prices.
Historically, such low levels have marked periods of strong conviction among long-term Bitcoin holders, with investors preferring cold storage to trading.
This reduces available supply, with fewer coins potentially up for sale even as Bitcoin nears all-time highs.
Institutional custodians replacing crypto exchanges
The rise of institutional custody solutions is another major factor behind Bitcoin’s decreasing supply across exchanges.
Instead of public exchanges, large financial institutions like BlackRock, Fidelity, and Franklin Templeton prefer third-party custody platforms.
Coinbase Prime, for example, reported over $212 billion in assets under custody in Q1 2025, driven by “inflows from ETF issuers, corporations, and high net worth individuals.”
 June 5, 2025 at 12:14 pm #25865
In reply to: Forex Forum
June 4, 2025 at 7:27 pm #25841In reply to: Forex Forum
June 4, 2025 at 3:13 pm #25831In reply to: Forex Forum
June 4, 2025 at 2:03 pm #25827In reply to: Forex Forum
June 4, 2025 at 11:30 am #25810In reply to: Forex Forum
Ether poised for ‘significant breakout’ as ETH price strengthens vs BTC
Key takeaways:
Ether’s price is up 46% in 30 days.
ETH/BTC is up 30% in the past month, signalling stronger demand for Ether.
Spot Ethereum ETFs see 12 consecutive days of inflows.
Ether’s price is up by 7% over the last three days, leading to optimism among traders that the biggest altcoin is ready for a breakout. Interestingly, the ETH/BTC trading pair has also increased, boosting Ether’s recovery prospects in the coming days.
Ether’s ETHUSD price trading at $2,630, up 46% over the last 30 days.
Ethereum is trying to reclaim $2,500 as support and solidify it as the new range low of the $2,500-$4,000 macro range
Altseason coming? Ether gains on Bitcoin
The ETH/BTC pair is also up 30% over the last month, reaching a 10-week high of 0.02618 on May 14. ETH/BTC trades at around 0.02503, up 48% from the multi-year low of 0.01766 reached on April 22.
If you want to track how altcoins are likely to perform relative to $BTC, one of the main factors will be the $ETH/BTC chart strength.
Spot Ether ETF inflows continue
The rise in the ETH/BTC ratio indicates increased demand for Ether, with institutional investors opting for ETH over BTC in the past few days.
US spot Ethereum ETFs have witnessed net inflows for twelve consecutive days.
 June 3, 2025 at 3:10 pm #25770
In reply to: Forex Forum
What’s Hot and What’s Not?

What’s hot?
Stocks… reversing early losses
Dollar higher… in order of currency strength
CAD (firmest vs USD)
GBP
AUD
EUR
NZD
CHF
JPY (Weaskest vs USD)US bonds: More lukewarm with yields dipping slightly despite risk on
BITCOIN: Correlating with risk on
Crude Oil: Up but facing resistance
What’s Not
Currencies vs. the dollar (led by JPY and CHF)
GOLD: Backing off after breakout yesterday
June 3, 2025 at 12:03 pm #25754In reply to: Forex Forum
June 2, 2025 at 7:46 pm #25740In reply to: Forex Forum
June 2, 2025 at 7:41 pm #25738In reply to: Forex Forum
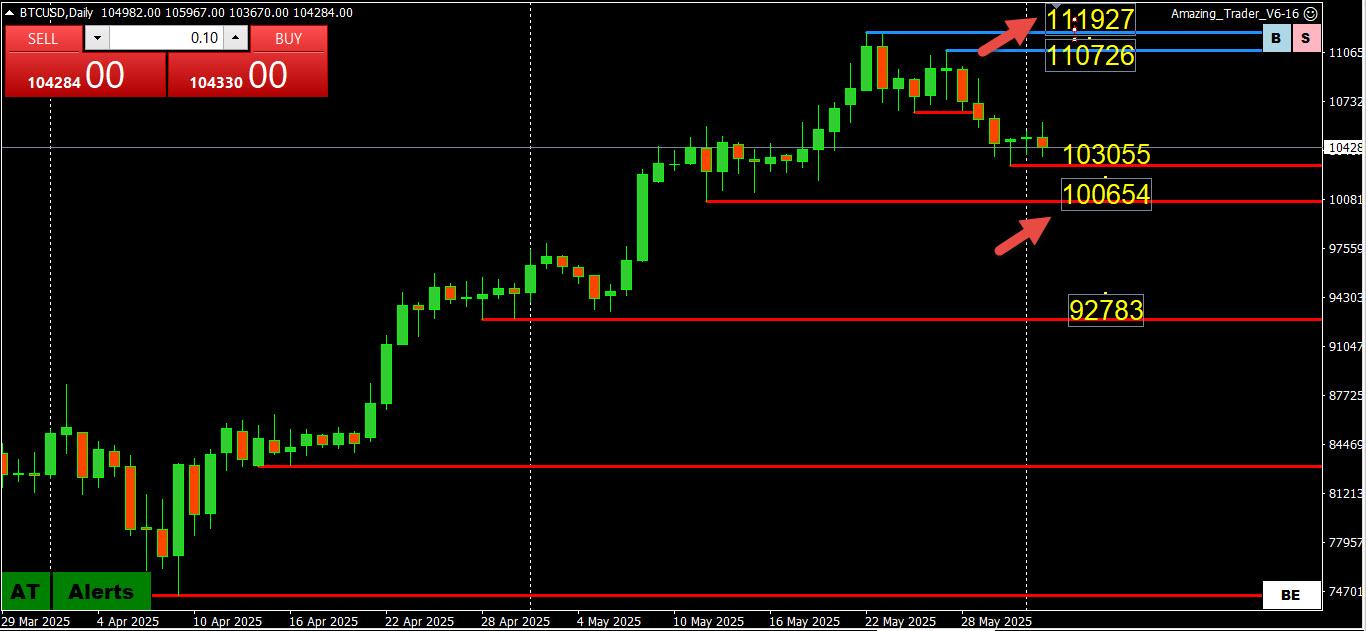
BTCUSD (BITCOIN)
Two blue AT lines drawn off the 111927 (record) high indicated a potential change in direction that has played out.
Only a break of 100659 would suggest a greter downside risk
Otherwise, still just a retracement with support as long as it trades above 100659
BTCUSD (BITCOIN) DAILY CHART
-
AuthorSearch Results

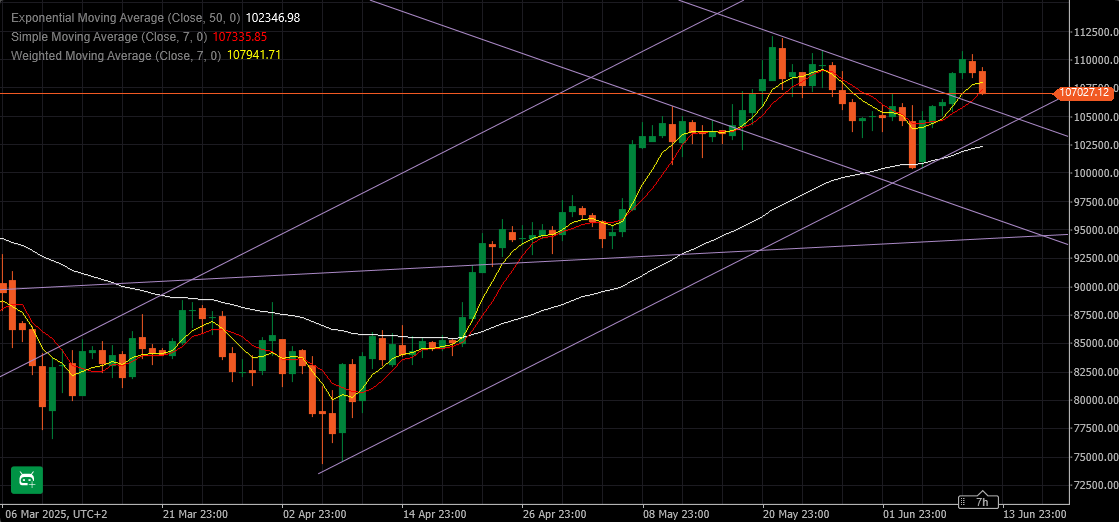
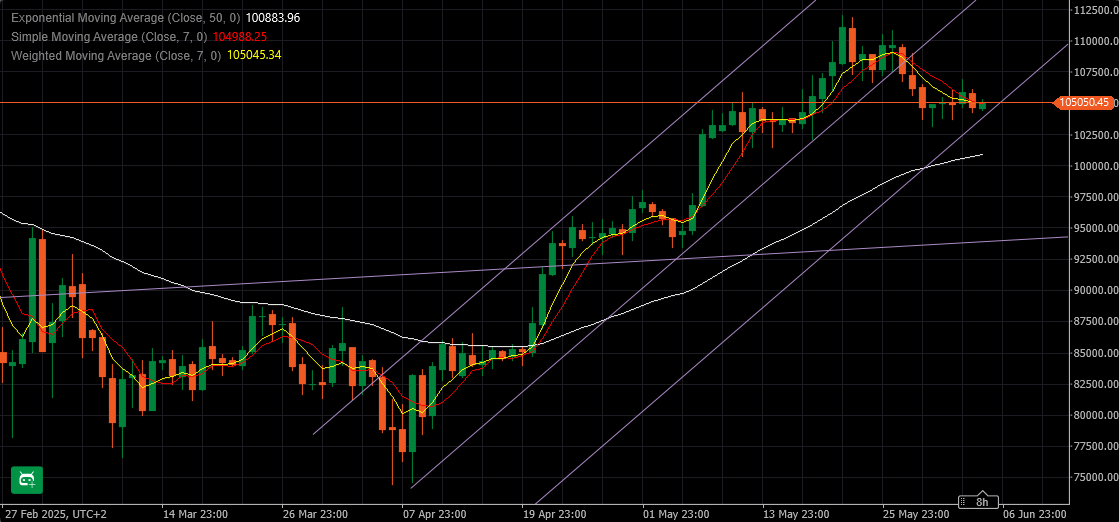
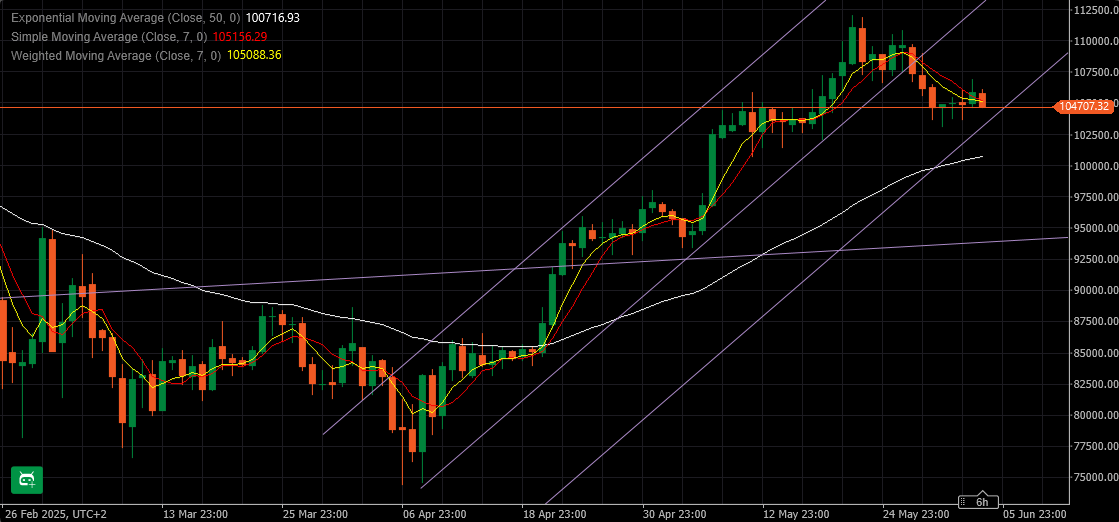
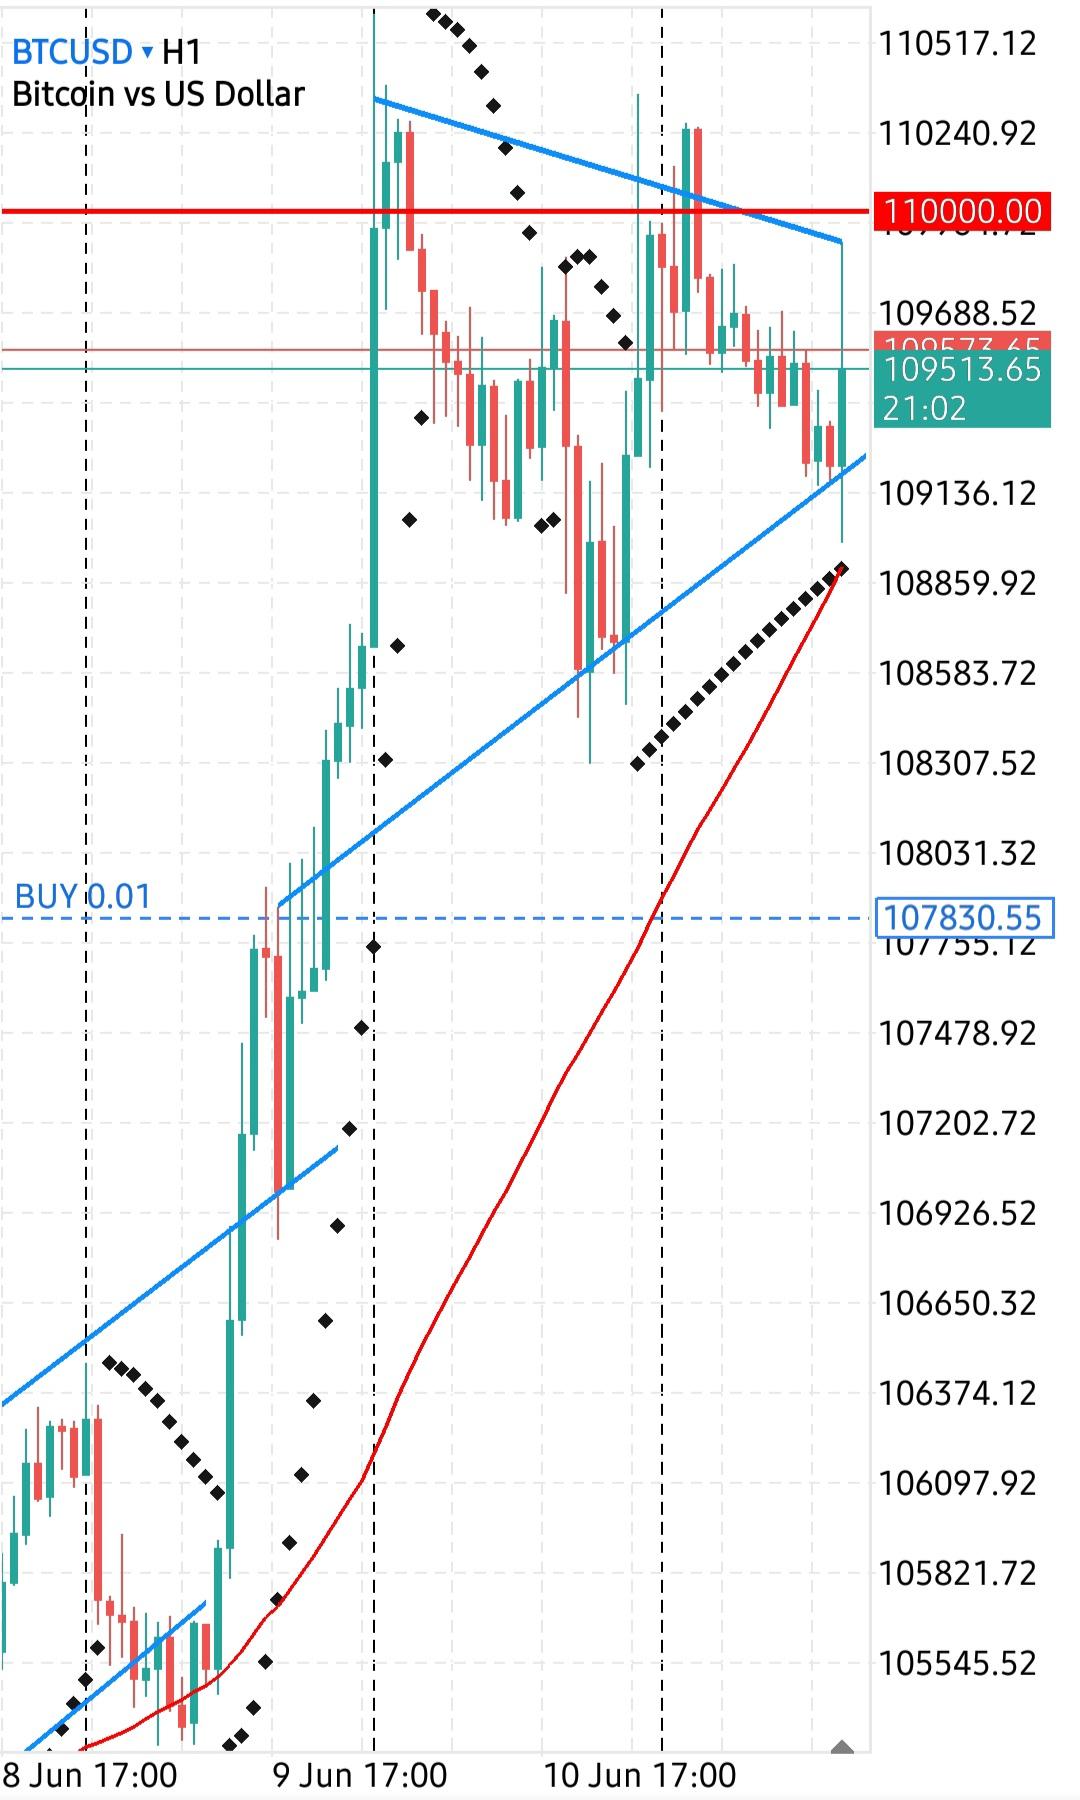 can some1 help me with bitcoin should I buy & aim for 120000.00


Search
© 2024 Global View