
- This topic has 27,778 replies, 54 voices, and was last updated 18 hours, 11 minutes ago by GVI Forex 2.
-
AuthorPosts
-
June 2, 2025 at 11:14 am #25705
This article explains some of EURUSD’s strength this year
Why the EURO Is considered the Anti-Dollar
 June 2, 2025 at 11:08 am #25703June 2, 2025 at 10:22 am #25698
EUR/USD: Euro Grabs Pips Against Dollar as Jam-Packed Week Seeks to Rattle Forex Markets
Key points:
· Euro rides five months of gains
· EU currency perks up above $1.14
· Key data to follow this week
Bloc’s currency was making progress early Monday, looking to break out above the mid-term resistance. It’s almost there.
Euro Takes Early Lead
· The EURUSD pair nudged higher in early Monday trading, reaching for the $1.14 handle as traders leaned into the euro’s momentum. This comes after a volatile May and some relative cooling in US dollar strength.
· Technical traders have their eyes locked on $1.14 — a key resistance level that’s capped upward movement since April. A breakout above could mark a fresh bullish phase and bring about some angry bears.
· With dollar sentiment on edge after Trump’s tariff U-turns, the euro is finding buyers eager to ride the macro noise into opportunity. That said, the euro just secured its fifth straight month of gains against the greenback.
Data-Heavy Week Incoming
· Markets are bracing for a flurry of US data — ISM manufacturing, jobless claims, and Friday’s big-ticket item: non-farm payrolls. All could send the dollar flying or flailing.
· Any signs of softening US labor market figures or a miss on inflation expectations might fuel euro bulls and drag the dollar lower.
· On the European side, calm around ECB policy — an expected rate cut is on the table for Thursday — and steady inflation numbers (eurozone CPI data coming Tuesday) are creating a quietly confident tone for the single currency to move higher.
Trade Tensions Take a Backseat
· With Trump’s tariff threat on the EU now delayed to July 9, relief has rippled through forex desks. The euro is basking in that calm.
· Eurozone exporters are breathing easier, at least for now, reducing some of the downside pressure on the bloc’s economy and currency.
· Traders now see even more space for the euro to pump up after being utterly successful in the first half of the year — if this calm holds and incoming data favors the euro, the FX crowd could press further into long positions.
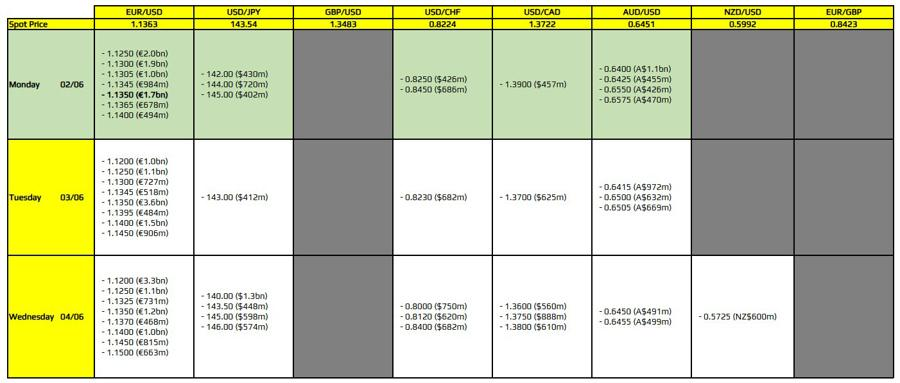
June 2, 2025 at 10:17 am #25697FX option expiries for 2 June 10am New York cut
There is just one to take note of on the day, as highlighted in bold.
That being for EUR/USD at the 1.1350 level, with large ones seen thereabouts as well for the days ahead. The expiries today might offer a bit of a floor for price action, alongside the 100 and 200-hour moving averages at 1.1330-35 nearby. That as the dollar is a little on the weaker side with markets continuing to digest what’s next on the trade front as Trump tariffs are temporarily reinstated again. Meanwhile, there is some pessimism with regards to China talks now. Surprise, surprise. Not!
 June 2, 2025 at 10:16 am #25696June 2, 2025 at 10:11 am #25695June 2, 2025 at 10:04 am #25694June 2, 2025 at 10:04 am #25693
EURO 1.1420
–
ECB faces surging euro conundrumLONDON, June 2 (Reuters) – While the European Central Bank keeps cutting interest rates, the euro keeps rising, as a transatlantic capital reversal upends relative rate shifts and threatens to force the ECB into further easing.
What’s remarkable is that after eight consecutive ECB cuts and with the prospect of zero or even negative real rates ahead, the euro has surged more than 10% against the dollar in just four months and 5% against a trade-weighted currency basket of the euro zone’s major trading partners. – as much as I hate verbs of insight in past tense 🙂
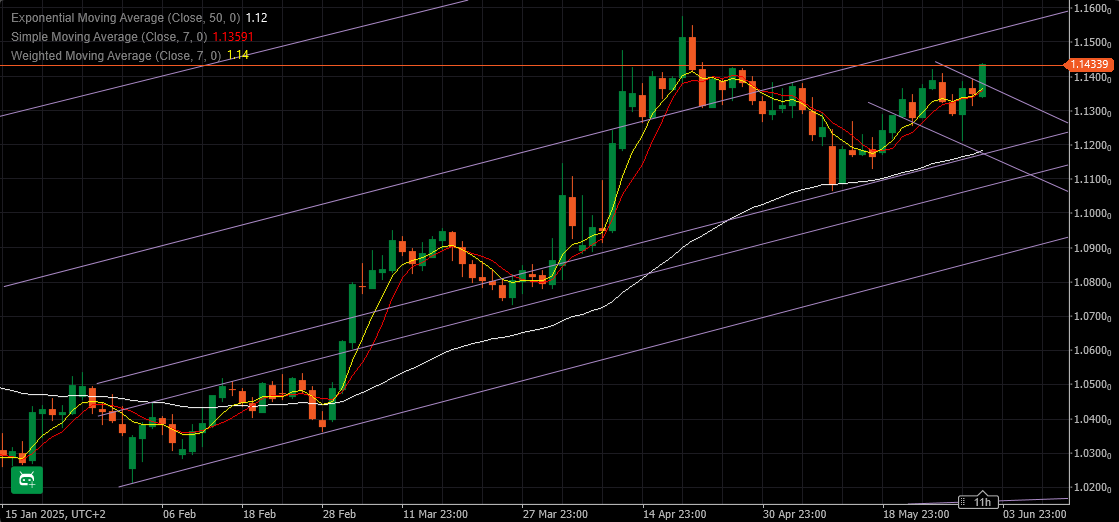
June 2, 2025 at 10:01 am #25692June 2, 2025 at 9:49 am #25691June 2, 2025 at 9:36 am #25690June 2, 2025 at 9:27 am #25689June 2, 2025 at 9:26 am #25688EURUSD
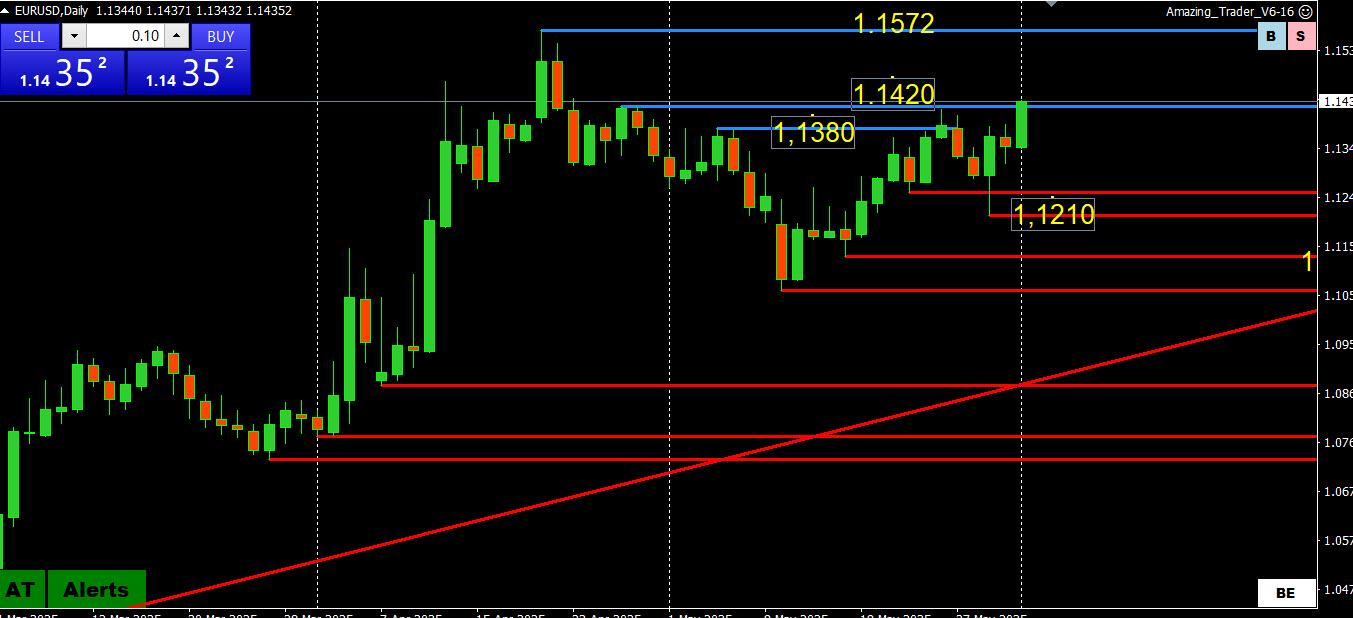
Classic example of needing a washout in one direction (low 1.1210) to setup a new high in the direction of the broader trend where market has less capacity to absorb fresh buying.
Key level: 1.1420… puts the 1.1572 high on the radar while above it,
Otherwise, support zone 1.1380-1.1420.
Below 1.1350 would indicate a false start.
EURUSD DAILY CHART
 June 2, 2025 at 9:16 am #25687
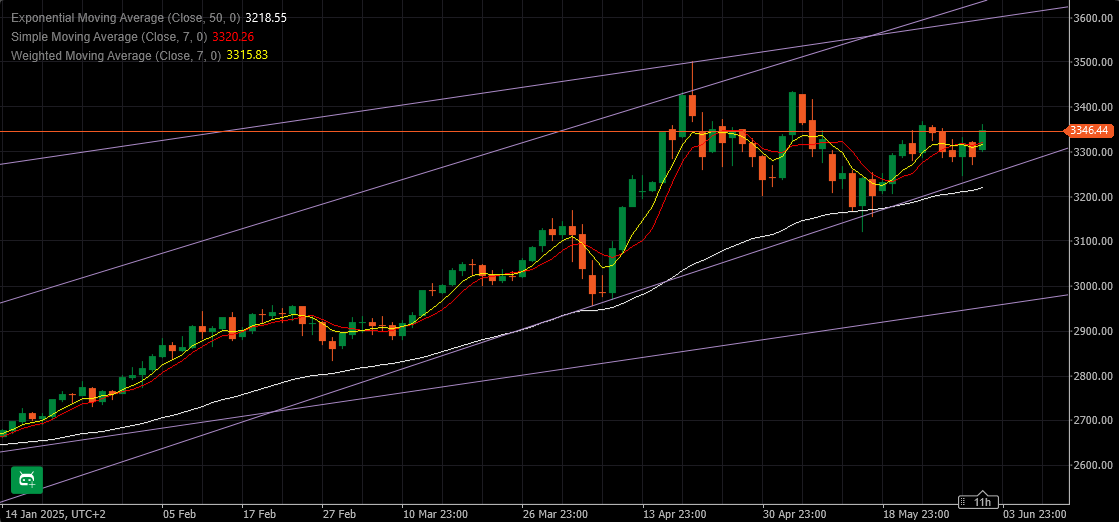
XAUUSD (GOLD)
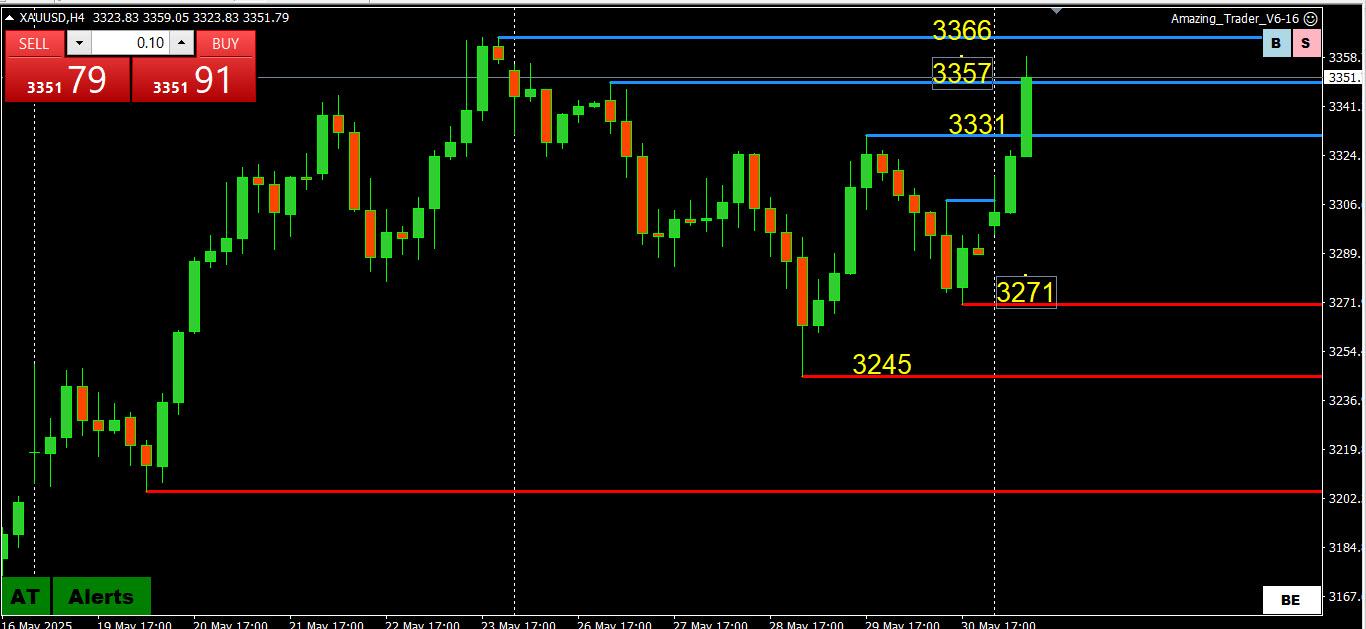
Move above 3331 (and 3335 = daily trendline) confirms low is in at 3245 and shift in risk to the upside
One key hurdle remains at 3366-69… above would expose 3438, the obstacle to the record 3500 high
Otherwise, keeps a bid while above 3330-35 and stronger bid at 3295
XAUUSD (GOLD) 4 HOUR CHART
 June 2, 2025 at 9:05 am #25686June 2, 2025 at 7:01 am #25685June 2, 2025 at 12:54 am #25684June 1, 2025 at 11:43 pm #25681
THIS WEEK’S MARKET-MOVING EVENTS (all days local)
Looking ahead to the week of June 2, global markets will be closely monitoring economic data releases that could shape monetary policy decisions and offer insight into trade and labor conditions. In Europe, the spotlight will be on trade data from Germany and France—the first full month reflecting newly implemented tariffs. These figures, along with retail sales data from Italy and Switzerland, will help clarify whether consumer demand and exports are showing resilience or faltering. The European Central Bank meets Thursday and is widely expected to implement a 25 basis point rate cut, responding to subdued inflation and rising concerns over weakening growth and escalating trade friction with the U.S.
In the United States, the focus turns sharply to the labor market. Key reports—including the JOLTS survey, ADP private payrolls, jobless claims, and Friday’s official employment report—will give the Federal Reserve critical insight ahead of its June 17–18 meeting. Job growth is forecast to slow to 129,000 in May, with unemployment holding at 4.2%. While layoffs may be easing, hiring remains cautious across many sectors, particularly in retail and tech. On the manufacturing side, factory orders and ISM data are expected to reflect continued softening. Globally, markets will also watch Asian PMI data for signs of recovery and India’s central bank decision, where another rate cut is anticipated amid declining inflation and stable domestic momentum…Econoday
June 1, 2025 at 9:44 pm #25680Never …
SEC. BESSENT: Well, first of all, Margaret, I will say the United States of America is never going to default. That is never going to happen. That- we are on the warning track and we will never hit the wall.
June 1, 2025 / 1:22 PM EDT / CBS News Face the Nation
June 1, 2025 at 8:46 pm #25679June 1, 2025 at 3:51 pm #25678June 1, 2025 at 3:17 pm #25677BTCUSD Daily
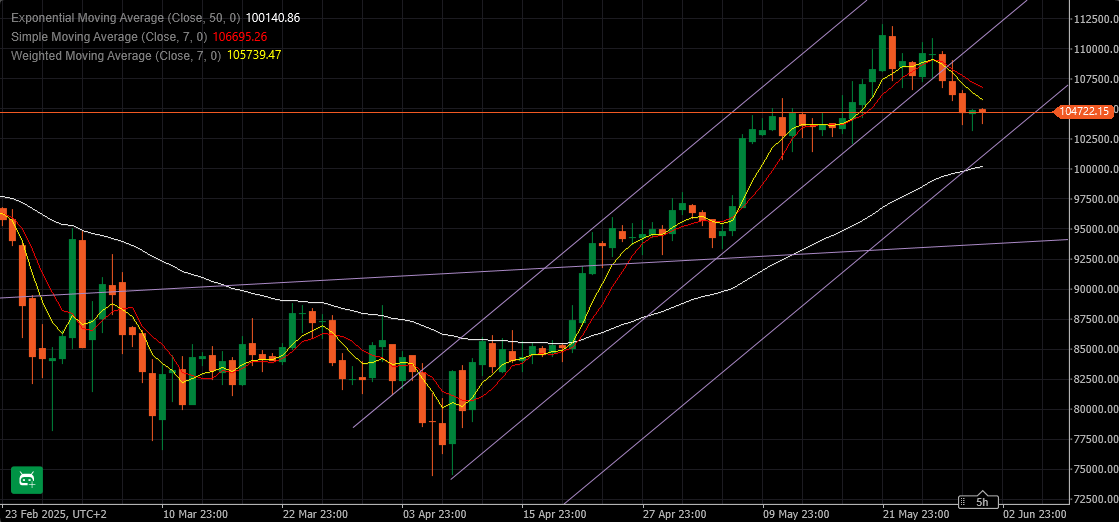
Question of a Trillion dollars is where this correction might end.
There are no proven methods that can determine exact point, but we can use some more speculative ones…
To start with, we have to assume that BTC is destined to continue Upwards for some foreseeable future
And as long as it stays above 90K that is about right.
Kind of dogma…I know 😀
Now when we have a stance about it, we can use Historical trend lines copied from BTC past – these lines are pretty exact, and based on the angle that any given pair is following once in a trend.
So here I did exactly that and placed it to have approximately the same width of the channel as previous one – and it is similar to the level of EMA 50.
It is at about 101.200
I expect to see some serious reaction there – so we’ll see 😀
BTC should reach it in a day or two and in that case it will be at 102.500
 June 1, 2025 at 3:15 pm #25676
BTCUSD (BITCOIN)
Trying to fine tune technical levels in a crypto that can move 5% in a blink of the eye seems pointless so let’s take a look at what an AT (The Amazing Trader) chart is showing going strictly by the book
Two blue AT lines drawn off the high indicated a potential change in direction that has played out.
Below 100659 would confirm a top and end of the last leg up with a target at 92783.
Otherwise, still just a retracement with support as long as it trades above 100659
BTCUSD DAILY CHART
 June 1, 2025 at 11:31 am #25673
OPEC+ oil producers stick to their guns with another big hike for July
Key points:
· Eight OPEC+ members met online
· OPEC+ cites steady economic outlook, healthy fundamentals
· Started unwinding output cuts in April
· The world’s largest group of oil producers, OPEC+, stuck to its guns on Saturday with another big increase of 411,000 barrels per day for July as it looks to wrestle back market share and punish over-producers.
· Having spent years curbing production – more than 5 million barrels a day (bpd) or 5% of world demand – eight OPEC+ countries made an modest output increase in April before tripling it for May, June and now July.
· They are spurring production despite the extra supply weighing on crude prices as group leaders Saudi Arabia and Russia seek to win back market share as well as punish over-producing allies such as Iraq and Kazakhstan.
· In a statement OPEC+ cited a “steady global economic outlook and current healthy market fundamentals, as reflected in the low oil inventories” as its reasoning for the July increase.
· OPEC+ pumps about half of the world’s oil and includes OPEC members and allies such as Russia.
· Its increased supply is weighing on crude prices, squeezing all producers, but some more than others, including a key group of rivals – U.S. shale producers, analysts say.
· Oil prices BRN1! fell to a four-year low in April, slipping below $60 per barrel after OPEC+ said it was tripling its output hike in May and as U.S. President Donald Trump’s tariffs raised concerns about global economic weakness. Prices closed just below $63 on Friday.
· Global oil demand is expected to grow by an average of 775,000 bpd in 2025, according to a Reuters poll of analysts published on Friday, while the International Energy Agency in its latest outlook saw an increase of 740,000 bpd.
· Besides the 2.2 million bpd cut that the eight members started to unwind in April, OPEC+ has two other layers of cuts that are expected to remain in place until the end of 2026.
“The oil market remains tight indicating it can absorb additional barrels, as the effective increase should be smaller as several of the eight countries are overproducing, and demand is seasonally rising,” said Giovanni Staunovo, analyst at UBS.
 June 1, 2025 at 11:23 am #25672
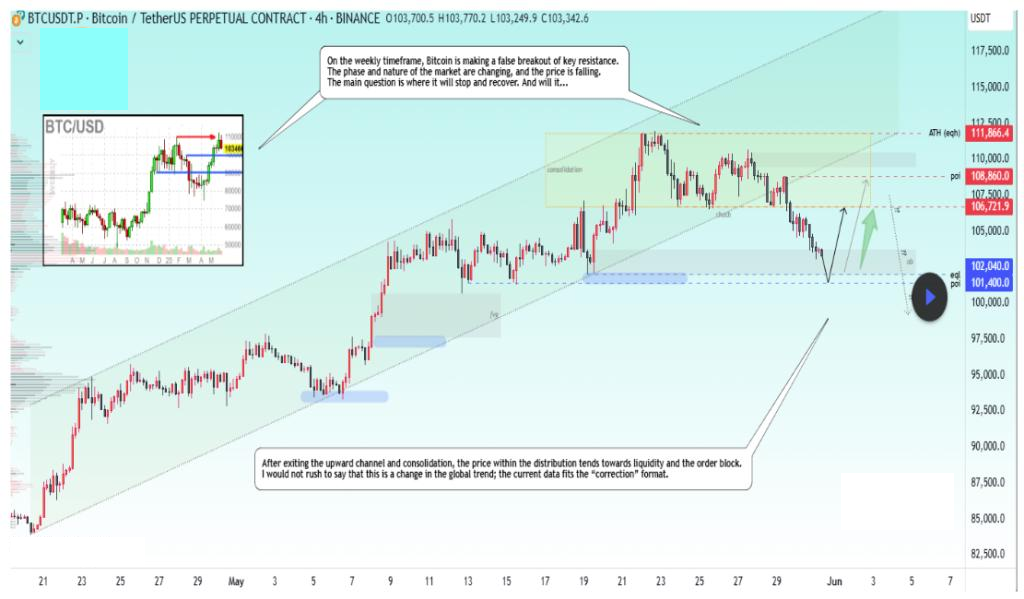
$202 Million In Long Liquidations Rock Bitcoin Market — What’s Next For BTC Price?
Over the weekend, Bitcoin’s price extended its disappointing performance, falling to around $103,000 in the early hours of Saturday, May 31st. While the premier cryptocurrency seems to have recovered fine in the past day, its price is still more than 6% away from the recently achieved all-time high of $111,814. Interestingly, the latest on-chain data suggests that the Bitcoin price could resume its upward trajectory anytime from now.
Mass Long Liquidations Could Mean Sustained Upward Trend For BTC
The latest event — involving $202 million worth of BTC long positions — is the third-largest in the past month, trailing only two larger liquidations in May: $211 million on May 12 and $277 million on May 23. This series of high-value liquidations reflects the increased speculative activity in the Bitcoin market over the past few weeks.
While the investors who suffered this liquidation may feel hard done by the market, these mass liquidations could be positive for the flagship cryptocurrency — a healthy reset for what is starting to feel like an overheated market. By removing excessive leverage, the Bitcoin market can re-establish a more stable foundation for price discovery and a continued upward trend.
Bitcoin Funding Rates Still Very Low
Bitcoin funding rates are still at extremely low levels. This trend signals the unwillingness and hesitation of traders to open new long positions
Typically, when Bitcoin breaks above its previous all-time high, we tend to see a surge in funding rates, signalling that euphoria and risk appetite are back. But that’s not what we’re seeing right now, investors need more clarity before jumping in with conviction.
This cautious stance of investors could be positive for the Bitcoin price and the upward trend. Moreover, the lack of euphoria reflects a market that is yet to be overheated, with room for further upside growth.
 May 31, 2025 at 7:32 pm #25670
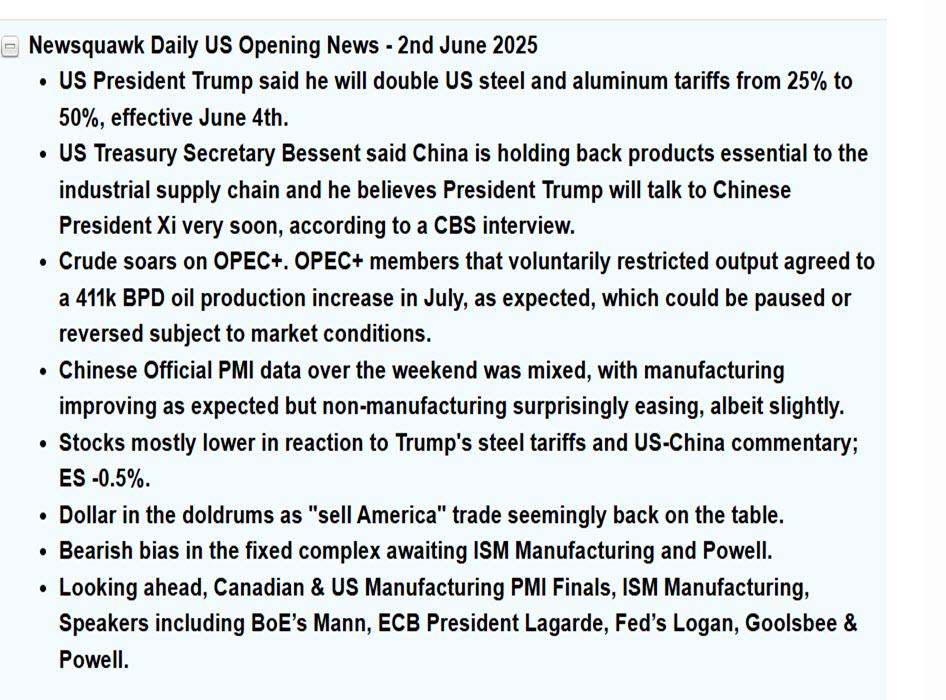
EU ‘prepared to impose countermeasures’ after Trump doubles steel tariffs to 50%
and one breath later
Germany’s new chancellor to meet Trump in Washington on Thursday
May 31, 2025 at 1:57 pm #25666May 31, 2025 at 1:28 pm #25665huff n puff OR 23:55 ?
U.S. Defense Secretary Pete Hegseth urged Asian allies to strengthen military coordination, accusing Beijing of destabilizing the region.
The Pentagon chief urged political and defense leaders in the audience to ramp up defense spending.
The absence of China’s top military official has cast doubt over whether there will still be a bilateral meeting between Chinese and the U.S. defense officials.
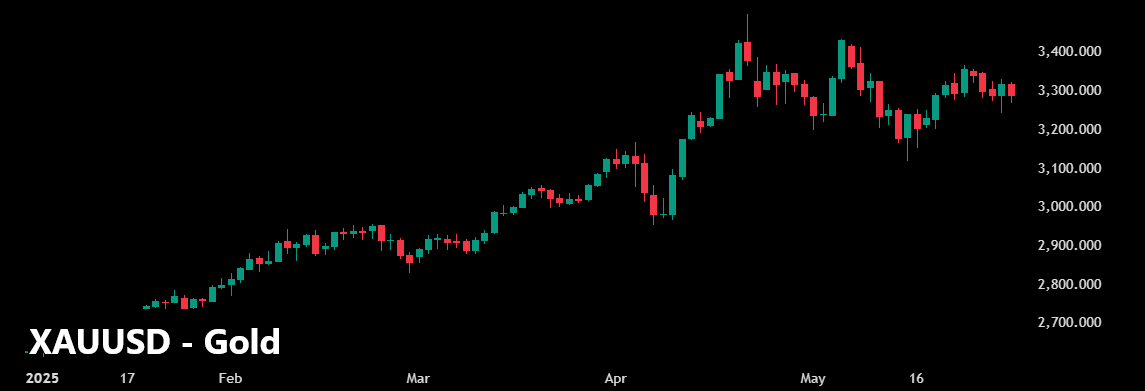
May 31, 2025 at 12:50 pm #25664Gold Saga continues – and here is an interesting approach to it: Options — The Striking Price: Miss the Gold Rally? Here’s a Safer Way In.
President Donald Trump loves gold. He uses it to adorn his properties. So it is perhaps fitting that gold is experiencing a tremendous bull run during his second term.
The SPDR Gold Shares exchange-traded fund GLD is up about 28% this year, compared with a 0.15% decline for the S&P 500 index. A day seldom passes without bullish news for the precious metal.
Unfortunately, gold is popular for reasons that likely annoy the president. As the preeminent feel-good asset in times of economic distress — and paranoia — its allure is stronger now as investors struggle to understand Trump’s master plan for remaking the U.S. and global economy.
Gold’s extraordinary price performance suggests that investors are undecided about Trump’s bold idea to use tariffs against trading partners to enrich the U.S. and liberate Americans from income taxes.
Much remains unsettled. Trump’s “big, beautiful bill” passed the House and now awaits the Senate. If approved, it would increase the deficit to about 125% of the economy’s output, which would, according to traditional thinking, hobble America with economic problems and financial risks if the tariff plan fails to produce.
To a real estate tycoon like Trump, who has often used debt as a tool to unlock asset values, deficits probably aren’t as concerning as to those who consider massive government debt to be the economic equivalent of the Covid virus.
If the president is right, the world will pay to access American consumers — perhaps the world’s greatest purchasing force — and the deficit and income taxes will cease to be problematic.
Trump’s approach is revolutionary, and potentially catastrophic, which should support gold’s continued advance. Goldman Sachs has told clients that it sees gold rising to $3,700 a troy ounce by the end of 2025, up from $3,326 on May 23.
In this case, gold’s price momentum can be harnessed with a so-called bull spread using call options, which limits money at risk while still allowing for potentially astronomical returns.
Aggressive investors who are intrigued could buy the gold ETF’s September $310 call and sell the September $330 call. This spread cost about $6.35 when GLD was at $304.50. One hundred shares of the ETF would cost about $30,450, much more than the options that control the same number of shares.
The spread’s maximum profit is $13.65 if GLD is at $330 at expiration. During the past 52 weeks, the ETF has ranged from $211.54 to $317.63.
The Fed is expected to lower interest rates in September. Until then, any hint of economic weakness should prompt more investors to buy gold and flee stocks — and maybe even bonds.
Though gold’s pre-eminence in chaotic times is assured, recent trading activity reveals increasingly volatile intraday price swings. This suggests investors are actively arguing about the sustainability of gold’s price.
 May 31, 2025 at 12:37 pm #25663
JPMorgan CEO: We shouldn’t be stockpiling bitcoin, we should be stockpiling bullets – most every msm
At the Reagan National Economic Forum, JPMorgan CEO Jamie Dimon warned the U.S. should stockpile military supplies—not Bitcoin.
-
AuthorPosts




- You must be logged in to reply to this topic.
Search
© 2024 Global View