
-
AuthorSearch Results
-
May 15, 2024 at 4:59 pm #6341
In reply to: Forex Forum
May 13, 2024 at 1:50 pm #6157In reply to: Forex Forum
AUDUSD 4 HOUR CHART – TESTING RESISTANCE

As I noted yesterday (scroll to prior pages for a broader view) .6600 would likely set its tone.
This has seen a test of .6624 resistance, its significance is that it guards the key .6648 level as seen on this chart.
Supports and trendline are below .6600, so keep the focus on this level to set the trading bias.
May 12, 2024 at 1:49 pm #6116In reply to: Forex Forum
AUDUSD DAILY CHART – WILL CONSULTATION BE BROKEN?
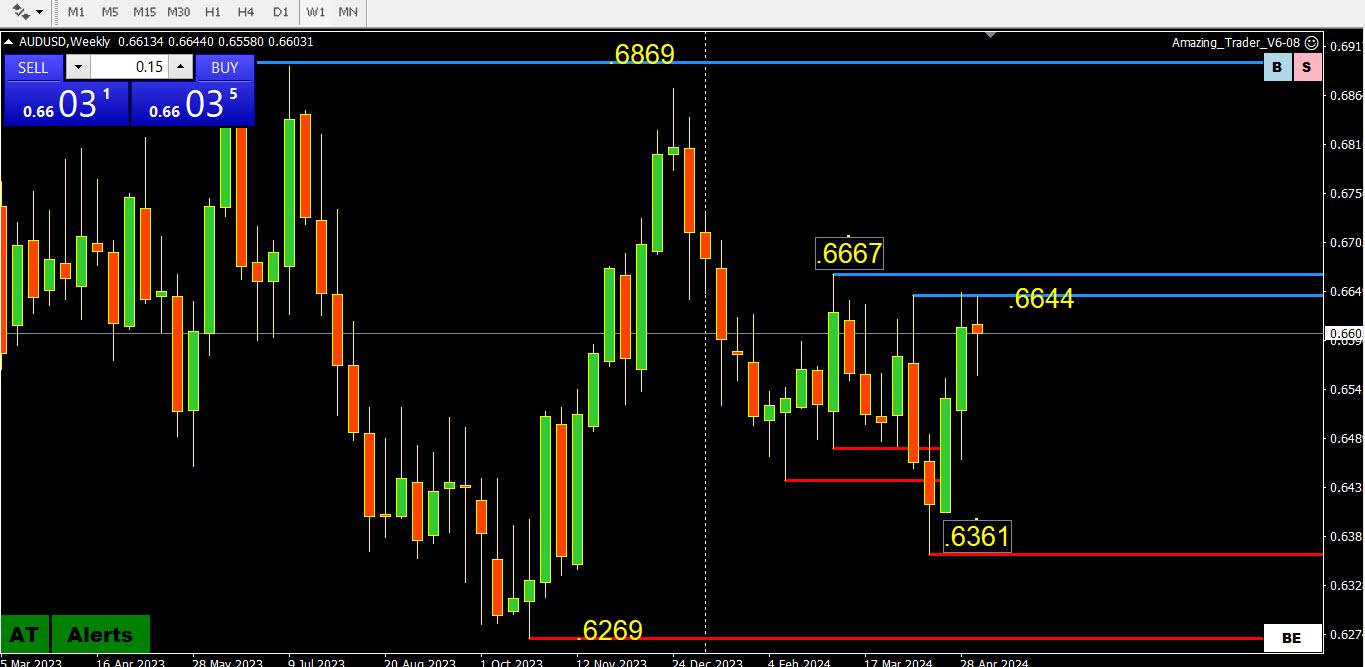
if you take a step back and a deep breath you will see that the AUSUSD has been consolidating within the broad .6269-.6869 range for the whole year-to-date
The range has been narrowed to .6361-.6667, so you can see why .6600 has become pivotal as a break of .6667 would out the .6869 level in play.
Looking at a 4-hour chart, there is a double top around .6644 and a key support at .6558
May 9, 2024 at 11:03 pm #6030In reply to: Forex Forum
May 8, 2024 at 2:47 pm #5947In reply to: Forex Forum
AUDUSD 5 MINUTE CHART – AT LADDER PATTERN

AUDUSD bouncing off its low as commodity currencies get a lift.
I am using this 5-minute chart to show how The Amazing Trader works with all instruments in all time frames.
We prefer using 15 or 30-minute charts for directional indicator patterns but in a quiet day like today, the 5-minute gave an early sign of a potential change in direction (as long as the low stayed intact).
Note the rising red lines are called an AT Ladder pattern.
May 8, 2024 at 1:00 pm #5938In reply to: Forex Forum
In the bigger picture AudUsd has just begun a sell side bias and is nowhere close to my parameters for finishing. That does not mean a bounce around current levels. I’m on the sell side until 6600 is firmly compromised including on an intra-day basis, were patience simply applies during any bid bias occurring. I don’t like calling tops and bottoms. I’ve seen it empty the accounts of many, many would be and professional traders alike.
What matters is that you don’t miss.
May 8, 2024 at 9:48 am #5928In reply to: Forex Forum
AUDUSD 4 HOUR CHART – Make or break level
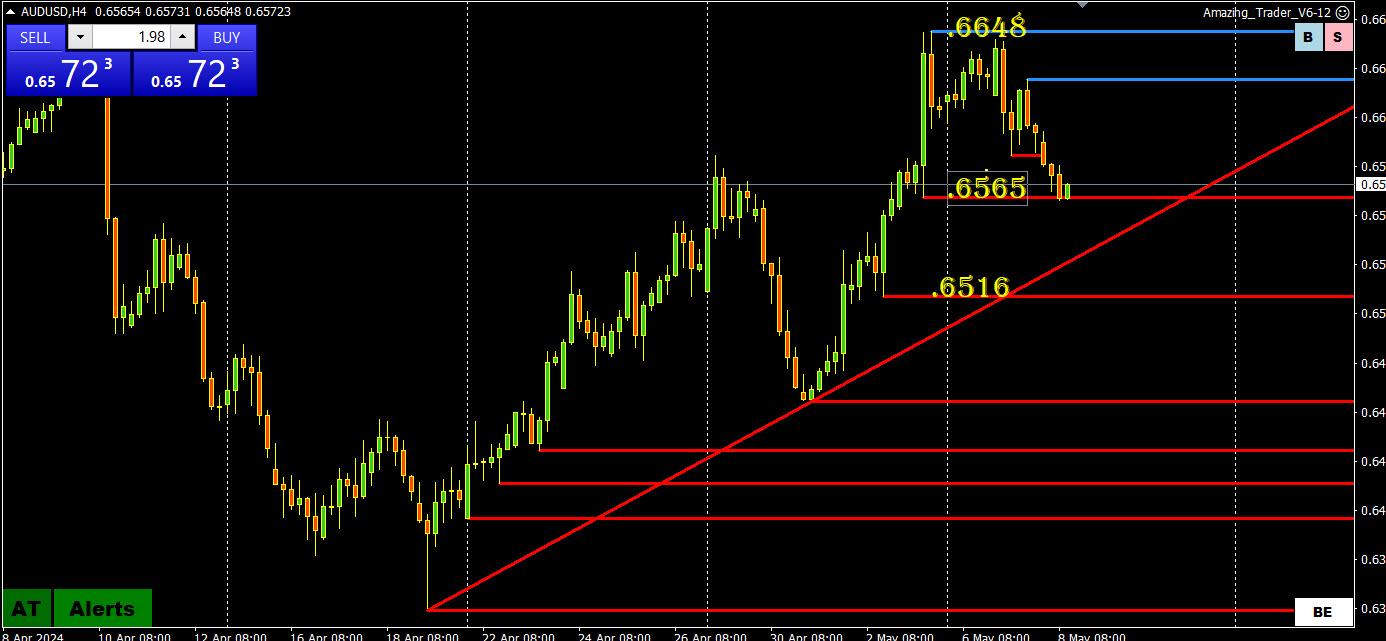
AUDUSD performing technically, with the 2 blue AT LINES POINTING TO A CHANGE IN DIRECTIONAL RISK THAT HAS SEEN A TEST OF THE KEY .6565 LEVEL (CITED HERE YESTERDAY).
This puts AUDUSD at a crossroads as .6565 is a make or break level. If it holds, then expect a bounce. If it is broken, then look for a test of the trendline or lower.
So far, it has held the first test of this level.
May 7, 2024 at 3:38 pm #5888In reply to: Forex Forum
AUDUSD 4 HOUR CHART – CONSOLIDATING
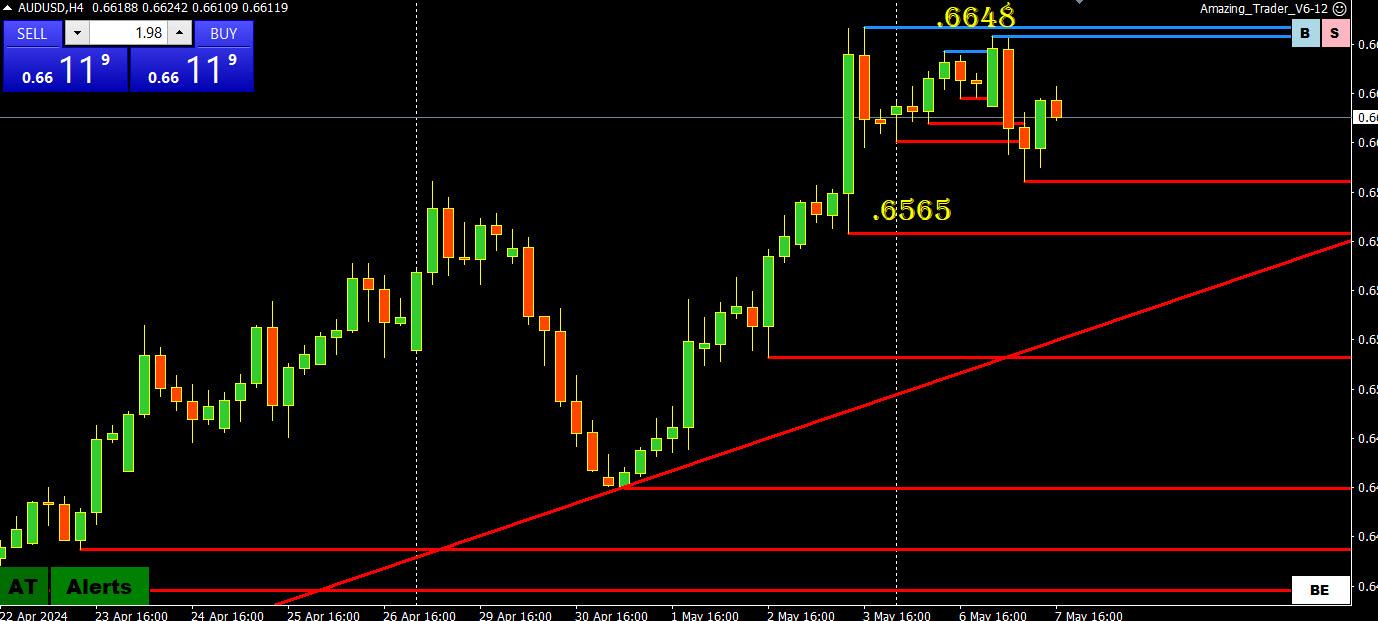
Similar to other pairs AUDUSD is trading below highs set after Friday’; US jobs report.
What I like about this type of chart is that the key levels are clear, which gives a framework to trade with shorter time frames.
In this regard, ,6565 needs to hold to keep the .6648 high on the radar while the upside is limited unless the high is taken out,
May 6, 2024 at 4:29 pm #5849In reply to: Forex Forum
For novices – there is a nice trendline from last weeks low in AudUsd that value is resting on at around 6620, and since Aud has good fundamental one might argue it would move higher. You must pay attention to the bigger picture though. If you look at larger time frames of analysis, 6660 could end up being a solid resistance area for bulls. AND it has the mark of the beast on it!
May 5, 2024 at 3:48 pm #5800In reply to: Forex Forum
AUDUSD DAILY CHART – WAITING FOR THE RBA
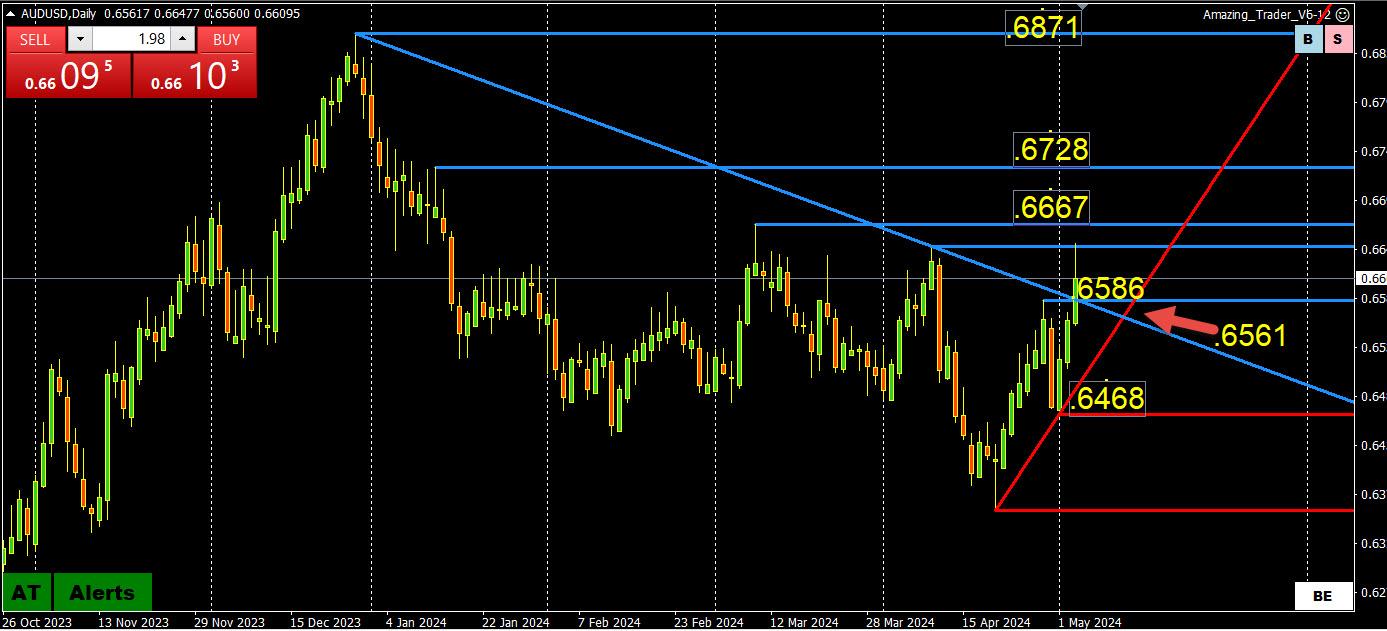
AUDUSD will likely see a cautious start after the strong move up and ahead of the RBA decision on Tuesday (see preview)
Looking at this chart, expect support as long as .6586 holds but the key level is .6561, where the up and broken downtrend lines intersect in the coming days.
May 2, 2024 at 8:51 pm #5640In reply to: Forex Forum
April 30, 2024 at 4:30 pm #5487In reply to: Forex Forum
April 30, 2024 at 3:54 pm #5483In reply to: Forex Forum
April 30, 2024 at 2:29 pm #5475In reply to: Forex Forum
April 30, 2024 at 1:23 pm #5457In reply to: Forex Forum
I believe AudUsd should pull back up in coming hours to around 6525 where there is a good R/R to short and hold if you missed it for a few days if it sticks. Overall Aud is a nice buy especially against crosses so my preference is to be long those crosses. Usd has rate dominance overall so if it is selling it is just smaller cycle.
April 29, 2024 at 5:07 pm #5414In reply to: Forex Forum
Covered calls are bid for stocks as well as some other facets, but some internals are not solid so it appears to me that the bid in stocks in moderately on the apprehensive side but bid so far. Dxy withstood the overnight selling but has to clear 106.05 and hold to accelerate in my view, otherwise the 105 area might be seen. I’m looking to sell GbpUsd around 2600 but am biased long overall until the tune changes. Staying on the bid in AudUsd and crosses on pullbacks and believe it might temporarily stall around 6600 in both spot and futures.
April 25, 2024 at 7:22 pm #5214In reply to: Forex Forum
April 24, 2024 at 8:22 am #5101In reply to: Forex Forum
AUDJPY 4 HOUR CHART – TRYING FOR A BREAKOUT
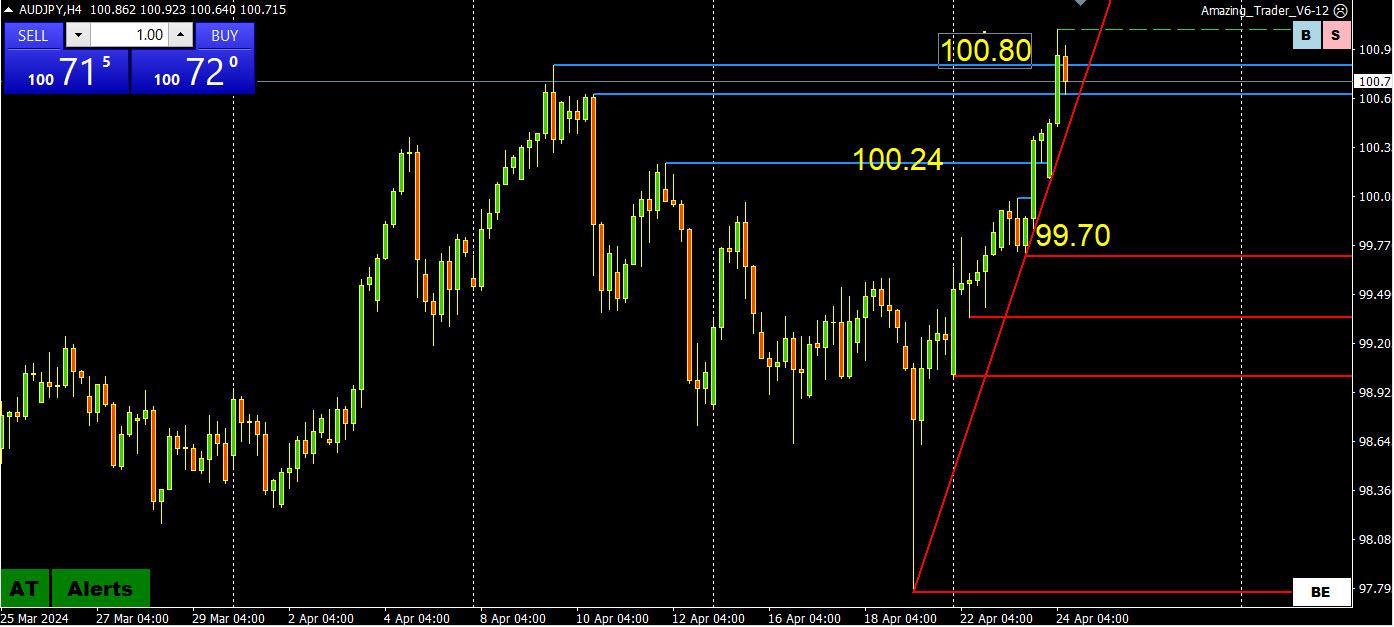
AUDUSD OUTPERFORMING AFTER CPI DATA WHILE USDJPY REMAINS POISED JUST BELOW 155 DESPITE MARKET ON INTERVENTION WATCH
AS FOR THIS CROSS, THE KEY LEVEL IS 100.80, SO FAR ONLY BRIEFLY TRADING ABOVE AND NEEDING TO BECOME SUPPORT TO BUILD MOMENTUM INTO UNCHARTERED WATERS (I.E. NO CLEAR RESISTANCE OTHER THAN THE MOST RECENT HIGH = 101.01 SET EARLIER).
April 23, 2024 at 11:03 pm #5094In reply to: Forex Forum
AUDUSD 4 HOUR CHART – CPI LOOMS
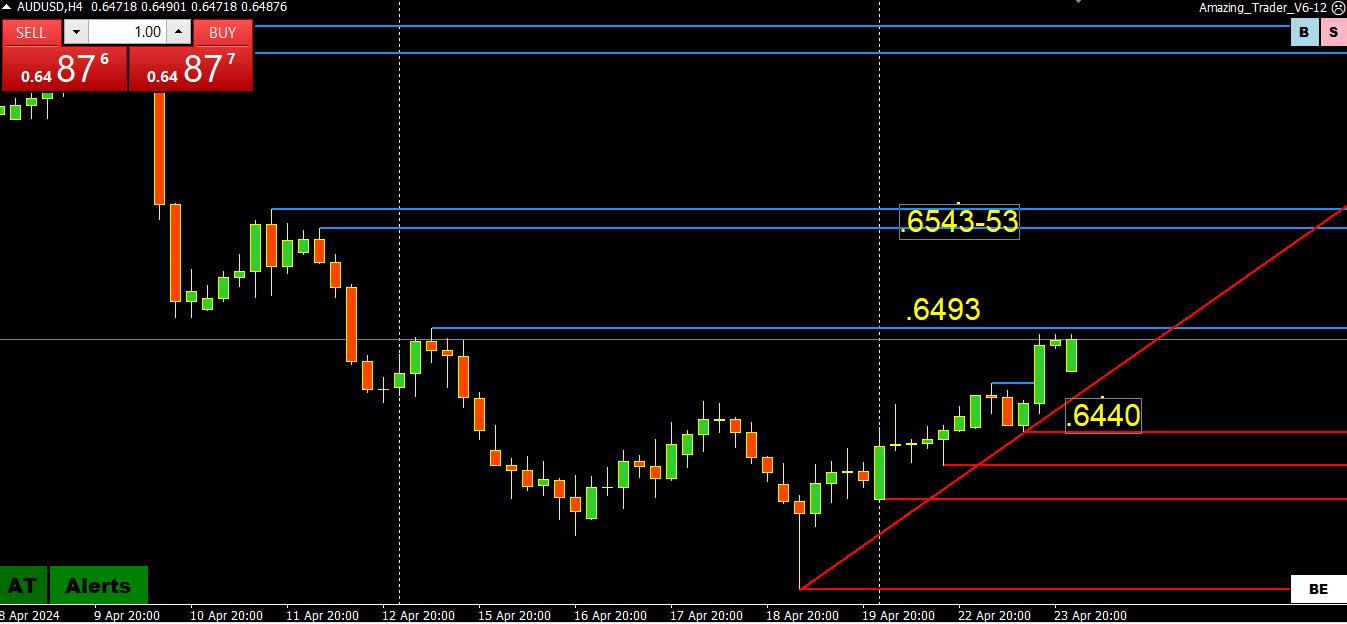
AUDUSD staging a nice rally that would need to get through .6493 (tested) and .6500 to put .6543-53 on the radar.
A test comes in a few hours when AUST CPI comes out… see our Economic Calendar
April 23, 2024 at 11:08 am #5055In reply to: Forex Forum
You have seen me post one of my favorite blog articles. The Power of 50. Look at current rates
GBPUSD 1.2350
EURUSD 1.0655
AUDUSD .6450 April 22, 2024 at 5:52 pm #5017
In reply to: Forex Forum
AUDJPY 4 HOUR CHART —
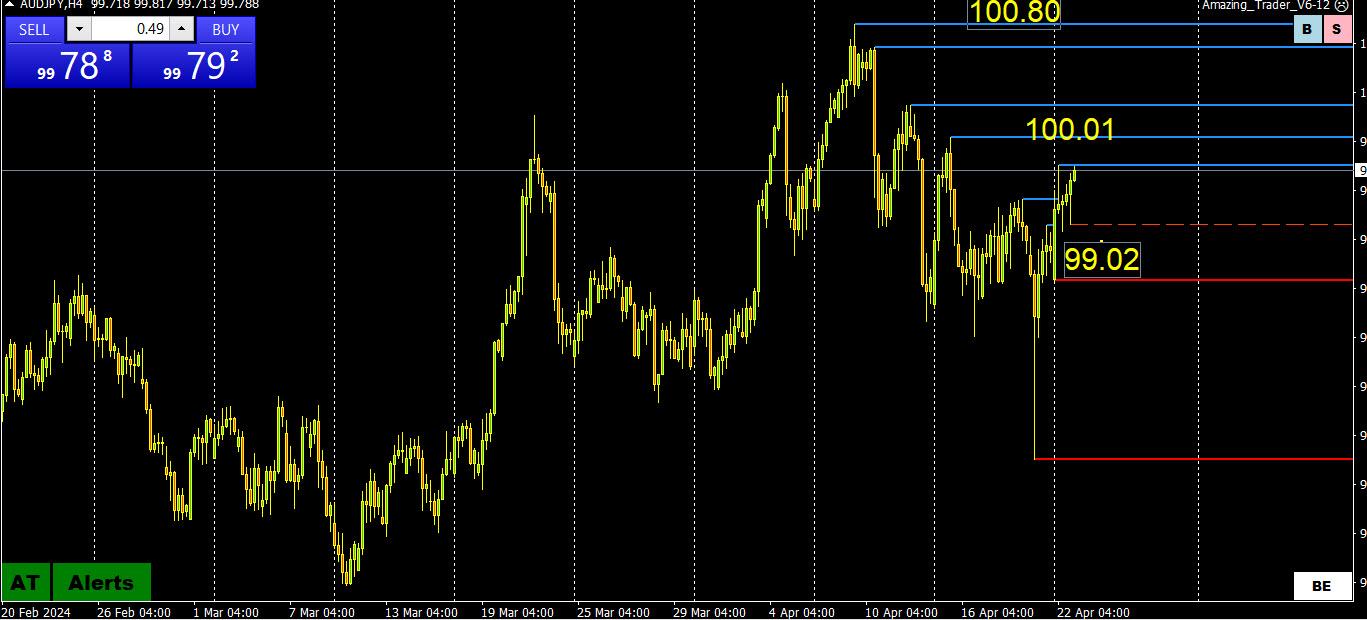
AUDJOY is back in familiar territory after last week’s phantom spike to the downside.
On this chart, expect support as long as it trades above .99.00 but would need to clear 100.01 to put the key 100.80 resistance in play.
Note AUDJPY has moved up mainly on the bounce in AUDUSD while USDJPY has barely moved.
This is an e3xmaple pof using crosses to trade spot and following the path of least resistance with USDJOY still reluctant to challenge 155.
April 19, 2024 at 12:15 am #4856In reply to: Forex Forum
AUDUSD 4 HOIR CHART – MODEST RETRACEMENT
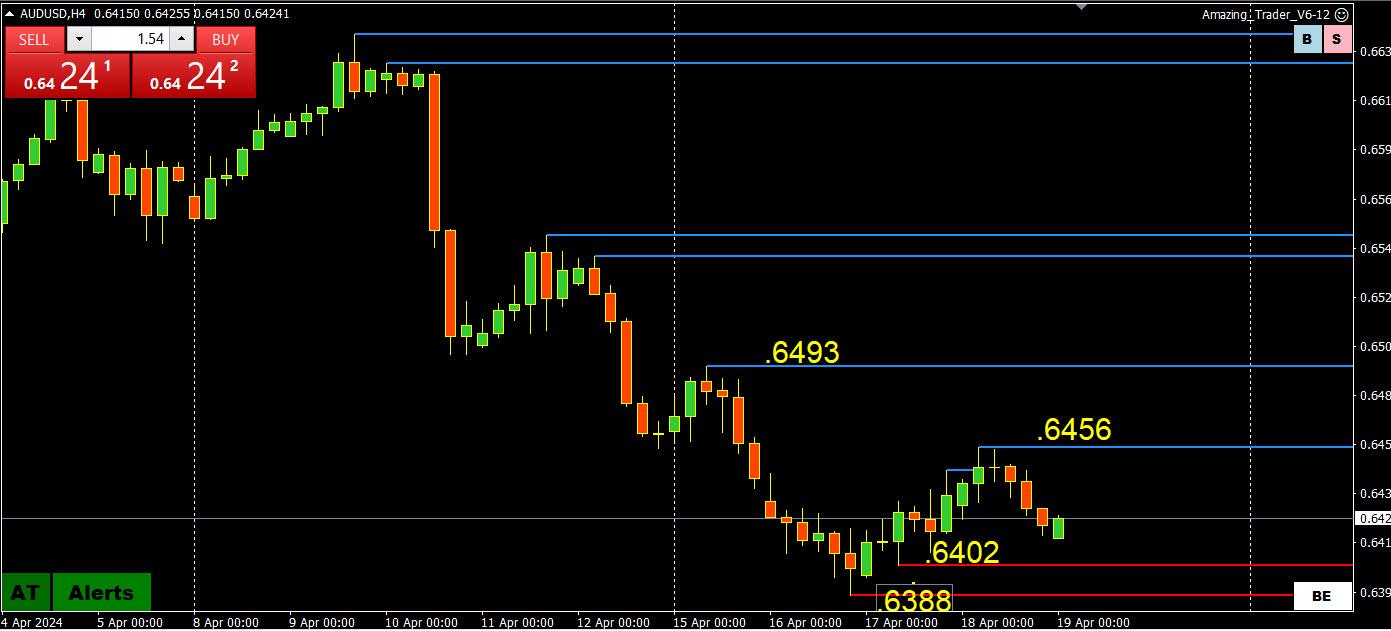
2 RED aT LINES DRAWN OFF THE LOW SIGNALED A CGNAGE IN DIRECTIONAL RISK AND THIS WAS FOLLOWED BY A MODEST RETRACEMENT.
kEY LEVELS ARE AT .6388 AND .6493
WHAT AT SAYS:
FOR,6456 TO BECOME THE KEY RESISTANCE LEVEL, THERE WOULD NEED TO BE A KEY LOW.
TO SUGGEST A BIGGER RETRACMENT.A THIRD AT RED LINE WOULD NEED TO BE FORMED FOLLOWED BY A .6456 BREAK.
BOTTOM LINE, THE TREND IS STILL YOUR FRIEND UNLESS .6456 IS BROKEN.
April 4, 2024 at 10:05 am #4007In reply to: Forex Forum
AUDUSD 4 HOUR CHART – THE OUTPERFORMER
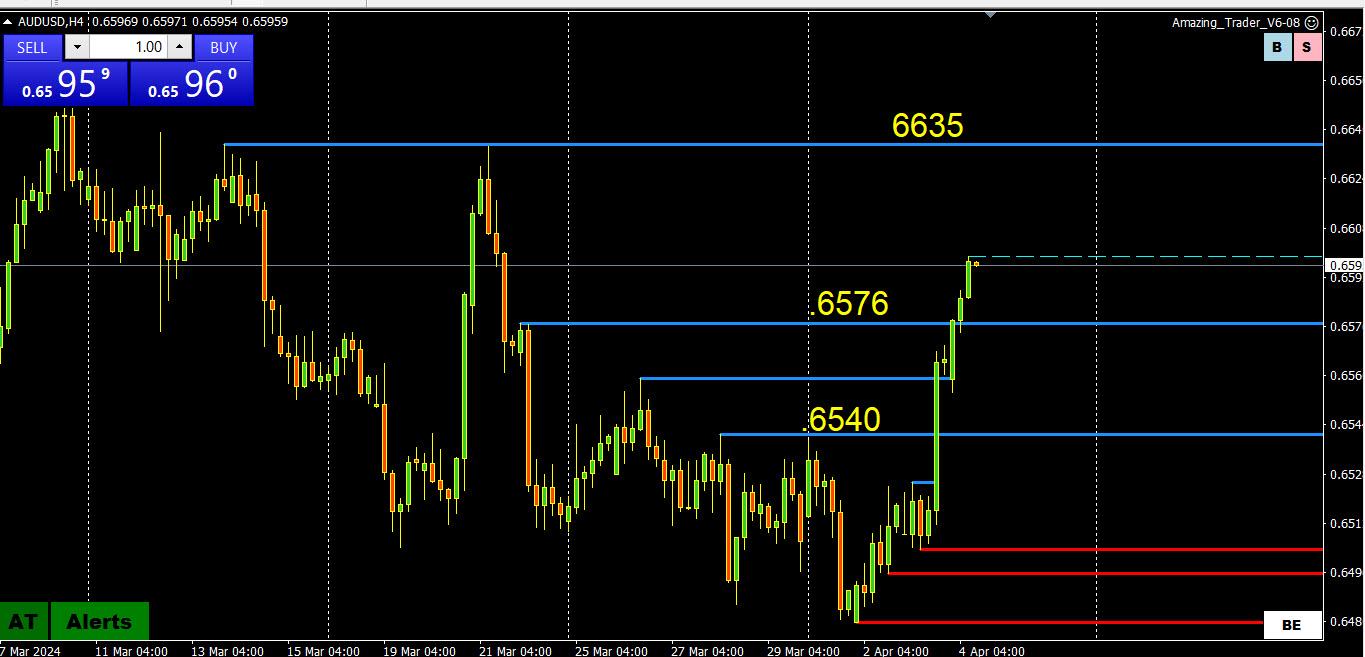
Note, my posts yesterday about following the oath of least resistance.
AUDUSD has so far been the outperformer today as flows from the JPY continue to keep USDJPY in sight of 152 but reluctant to challenge the BoJ while the USD trades soft elsewhere, helped by offsets from JOPY crosses.
I had to go to a 4-hour chart to find the key resistance, which is not until .6635 so damage so far has not been fatal.
In the absence of nearby support, look at former resistance for the first levels. of support or revert to shorter time frames.
April 4, 2024 at 12:56 am #4003In reply to: Forex Forum
March 25, 2024 at 9:57 pm #3605In reply to: Forex Forum
AUDUSD 4-HOUR CHART – Consolidation or Correction?
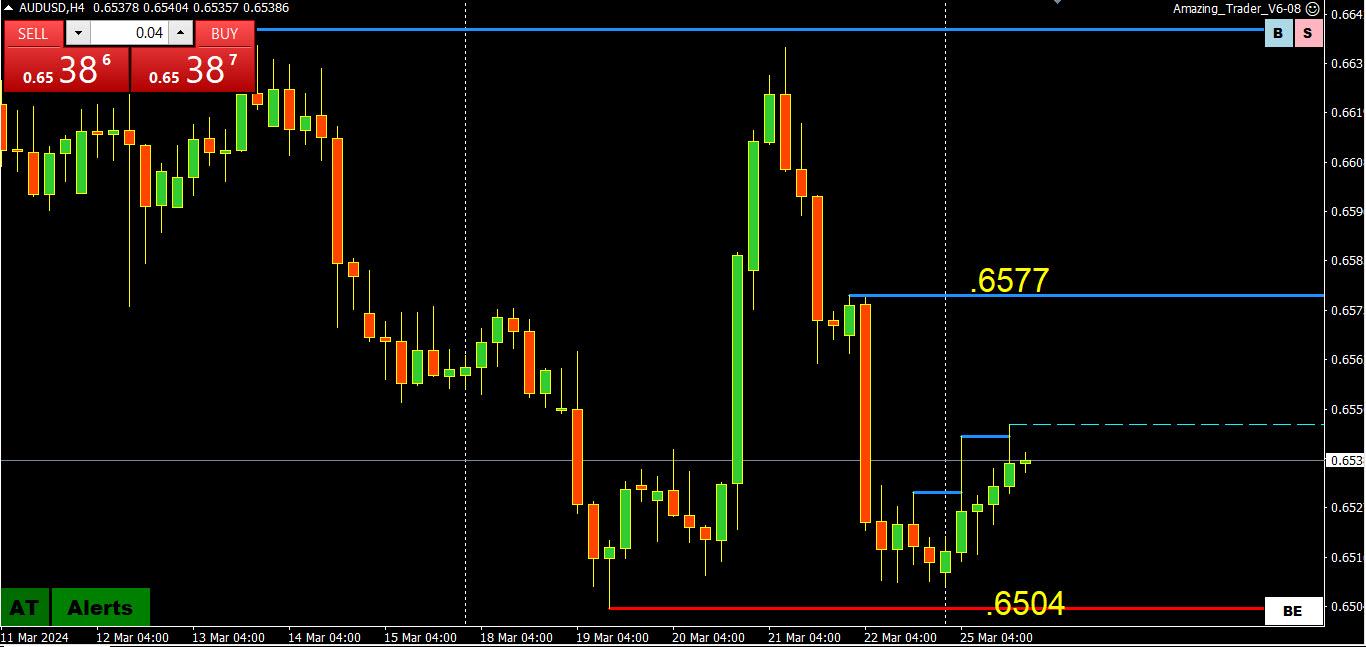
The market has started out in typical pre-Easter week fashion with some position adjustments dominating.
AUDUSD failure to test .6500 has seen a modest retracement that would need to take out .6577 to give it some legs.
Otherwise, expect some choppy consolidation trading while within .6599094 and .6577.
March 18, 2024 at 4:03 am #3149In reply to: Forex Forum
AUDUSD Analysis: Breakdown and Potential Downside Movement
AUDUSD has recently broken below the 0.6584 support level, signaling that the upward movement from 0.6477 may have concluded at 0.6667.
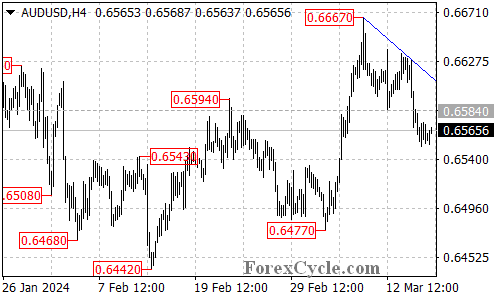
Further decline is still possible in the upcoming days, with the next target set around 0.6535. If the price manages to break below this level, the focus could shift towards the 0.6500 area.
The initial resistance level to monitor is at 0.6585. A successful breakout above this level could potentially bring the price back towards the falling trend line on the 4-hour chart.
A breakthrough of the trend line resistance would suggest that the downward movement from 0.6667 may have concluded, with another rise towards the previous high at 0.6667 potentially in the cards.
March 13, 2024 at 8:26 am #2921In reply to: Forex Forum
AUDUSD Analysis: Uptrend Continuation and Key Levels
AUDUSD continues its upward trajectory from 0.6477, with the recent retracement from 0.6667 likely representing a period of consolidation within the uptrend.
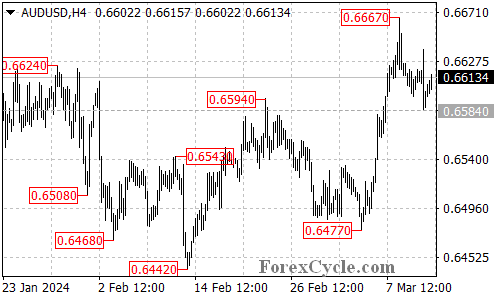
As long as the support at 0.6584 remains intact, the uptrend is anticipated to resume, potentially leading to a further ascent towards the 0.6750 region.
The initial resistance level to monitor is at 0.6640. A successful breakout above this level could propel the price towards testing the 0.6667 resistance. Subsequent breakthrough above 0.6667 would set the stage for a push towards 0.6750.
Conversely, a breakdown below the 0.6584 support level would signal a potential completion of the upward movement at 0.6667, potentially resulting in a decline towards the 0.6500 level.
March 11, 2024 at 5:30 pm #2847In reply to: Forex Forum
Read earlier that Claude Erb, a former commodities portfolio manager at TCW Group, plots bitcoin’s actual price over the past decade along with Erb’s application of Metcalfe’s Law with the result being a fair value of $35,000 for Bitcoin.
Side note, some ideas for orders I tried to post earlier but it would not post for some reason – buy side AudChf 5790 – Buy side AudCad 8900 – Sell side GbpChf 1260 – GbpUsd Buy side 2812 or lower – AudUsd buy side 6594 or lower – UsdJpy sell side 147.10 or higher –
March 10, 2024 at 2:03 pm #2750In reply to: Forex Forum
AUDUSD Daily Chart – Focus on the breakout level
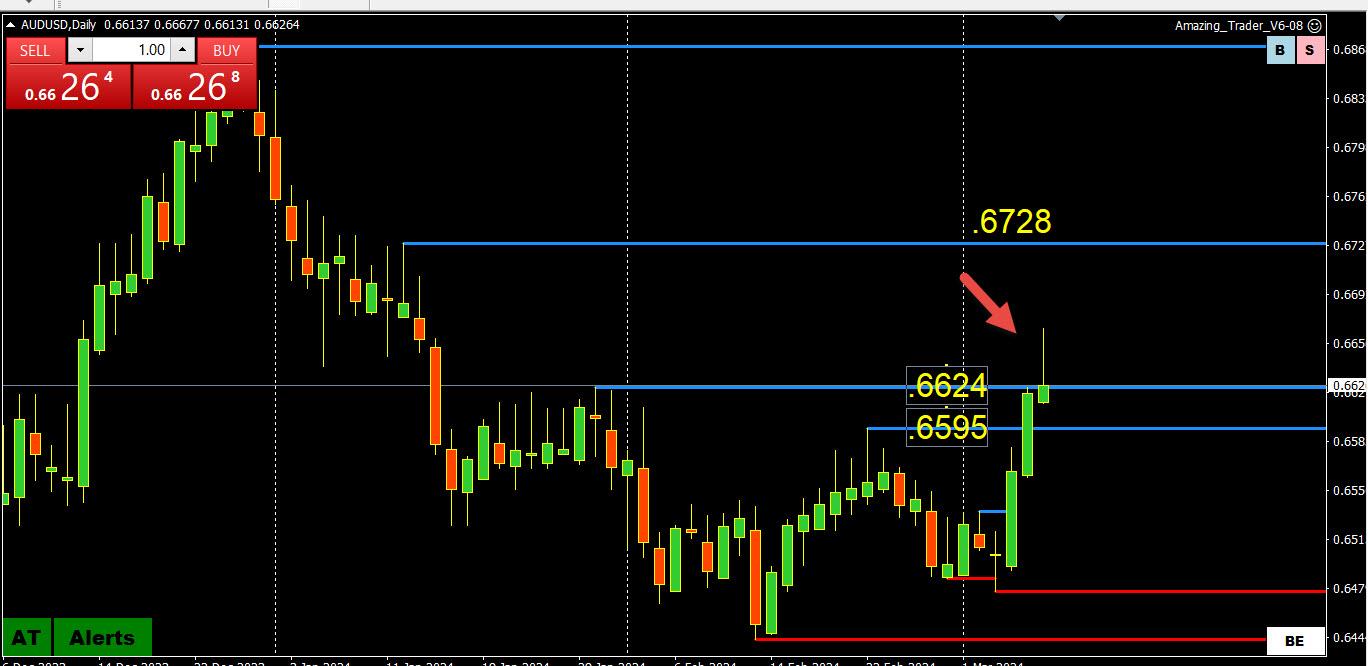
Breakout above .6624 and then retreat towards it. A large wick at the high suggests the possibility of a pause but only if AUDUSD moves back below.6624.
Only below .6595 would put it back into its old range, making .6595-6624 a support zone.
The 4-hour chart shows .6613 as a local support.
March 9, 2024 at 10:05 pm #2744In reply to: Forex Forum
-
AuthorSearch Results

Search
© 2024 Global View