
-
AuthorSearch Results
-
April 4, 2024 at 10:05 am #4007
In reply to: Forex Forum
AUDUSD 4 HOUR CHART – THE OUTPERFORMER
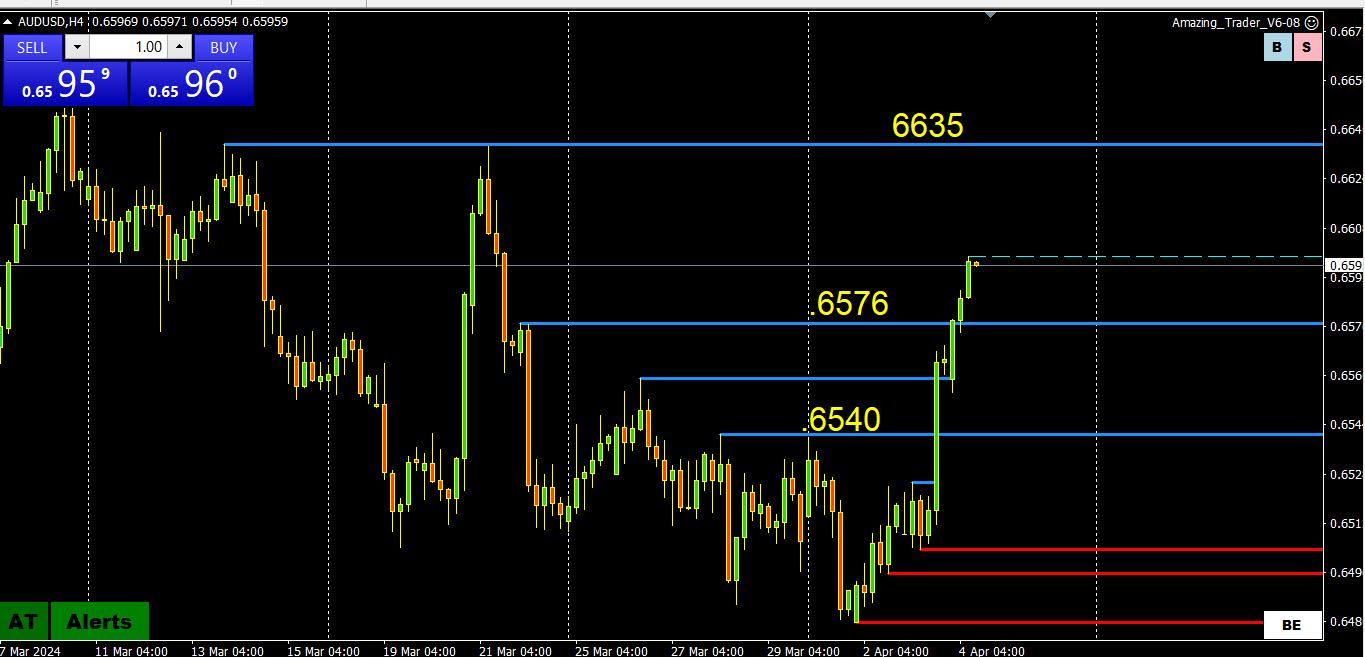
Note, my posts yesterday about following the oath of least resistance.
AUDUSD has so far been the outperformer today as flows from the JPY continue to keep USDJPY in sight of 152 but reluctant to challenge the BoJ while the USD trades soft elsewhere, helped by offsets from JOPY crosses.
I had to go to a 4-hour chart to find the key resistance, which is not until .6635 so damage so far has not been fatal.
In the absence of nearby support, look at former resistance for the first levels. of support or revert to shorter time frames.
April 4, 2024 at 12:56 am #4003In reply to: Forex Forum
March 25, 2024 at 9:57 pm #3605In reply to: Forex Forum
AUDUSD 4-HOUR CHART – Consolidation or Correction?
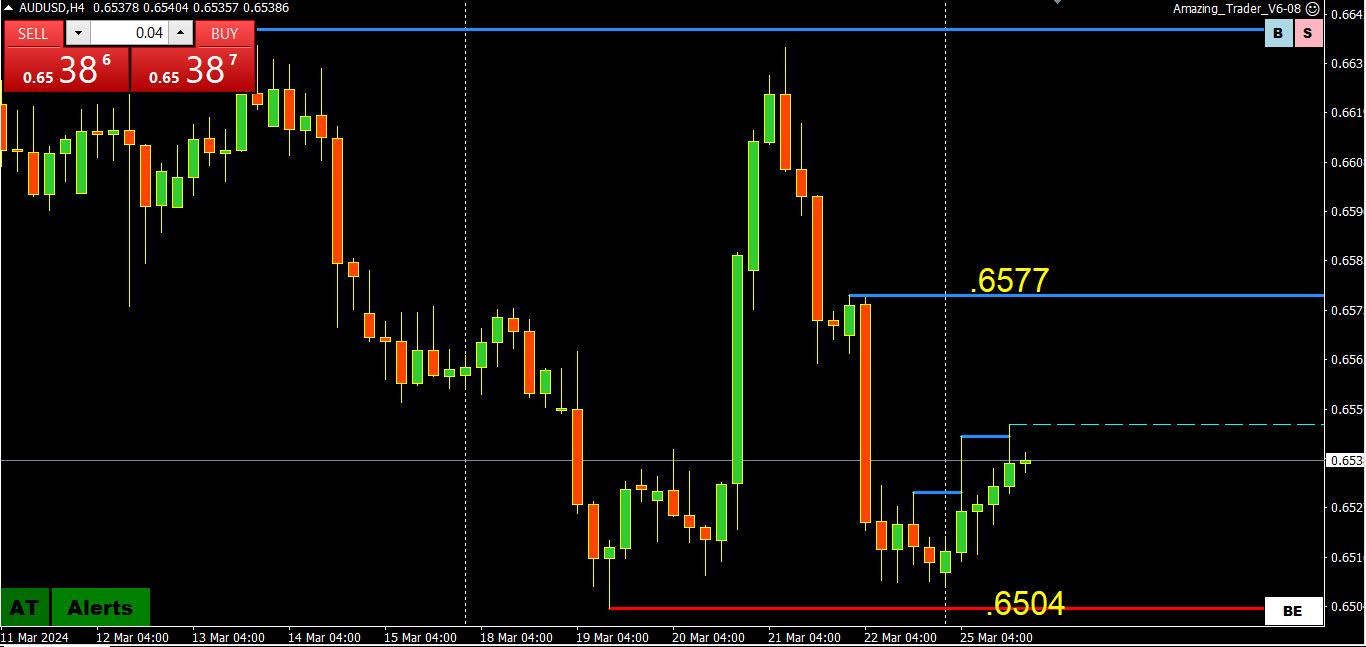
The market has started out in typical pre-Easter week fashion with some position adjustments dominating.
AUDUSD failure to test .6500 has seen a modest retracement that would need to take out .6577 to give it some legs.
Otherwise, expect some choppy consolidation trading while within .6599094 and .6577.
March 18, 2024 at 4:03 am #3149In reply to: Forex Forum
AUDUSD Analysis: Breakdown and Potential Downside Movement
AUDUSD has recently broken below the 0.6584 support level, signaling that the upward movement from 0.6477 may have concluded at 0.6667.
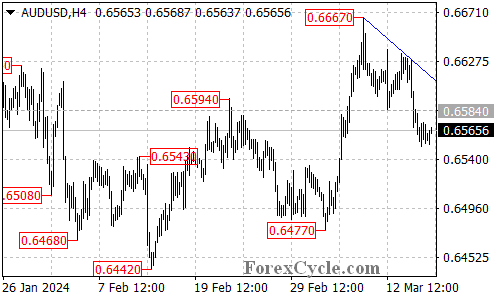
Further decline is still possible in the upcoming days, with the next target set around 0.6535. If the price manages to break below this level, the focus could shift towards the 0.6500 area.
The initial resistance level to monitor is at 0.6585. A successful breakout above this level could potentially bring the price back towards the falling trend line on the 4-hour chart.
A breakthrough of the trend line resistance would suggest that the downward movement from 0.6667 may have concluded, with another rise towards the previous high at 0.6667 potentially in the cards.
March 13, 2024 at 8:26 am #2921In reply to: Forex Forum
AUDUSD Analysis: Uptrend Continuation and Key Levels
AUDUSD continues its upward trajectory from 0.6477, with the recent retracement from 0.6667 likely representing a period of consolidation within the uptrend.
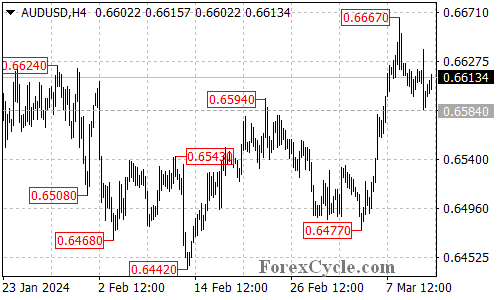
As long as the support at 0.6584 remains intact, the uptrend is anticipated to resume, potentially leading to a further ascent towards the 0.6750 region.
The initial resistance level to monitor is at 0.6640. A successful breakout above this level could propel the price towards testing the 0.6667 resistance. Subsequent breakthrough above 0.6667 would set the stage for a push towards 0.6750.
Conversely, a breakdown below the 0.6584 support level would signal a potential completion of the upward movement at 0.6667, potentially resulting in a decline towards the 0.6500 level.
March 11, 2024 at 5:30 pm #2847In reply to: Forex Forum
Read earlier that Claude Erb, a former commodities portfolio manager at TCW Group, plots bitcoin’s actual price over the past decade along with Erb’s application of Metcalfe’s Law with the result being a fair value of $35,000 for Bitcoin.
Side note, some ideas for orders I tried to post earlier but it would not post for some reason – buy side AudChf 5790 – Buy side AudCad 8900 – Sell side GbpChf 1260 – GbpUsd Buy side 2812 or lower – AudUsd buy side 6594 or lower – UsdJpy sell side 147.10 or higher –
March 10, 2024 at 2:03 pm #2750In reply to: Forex Forum
AUDUSD Daily Chart – Focus on the breakout level
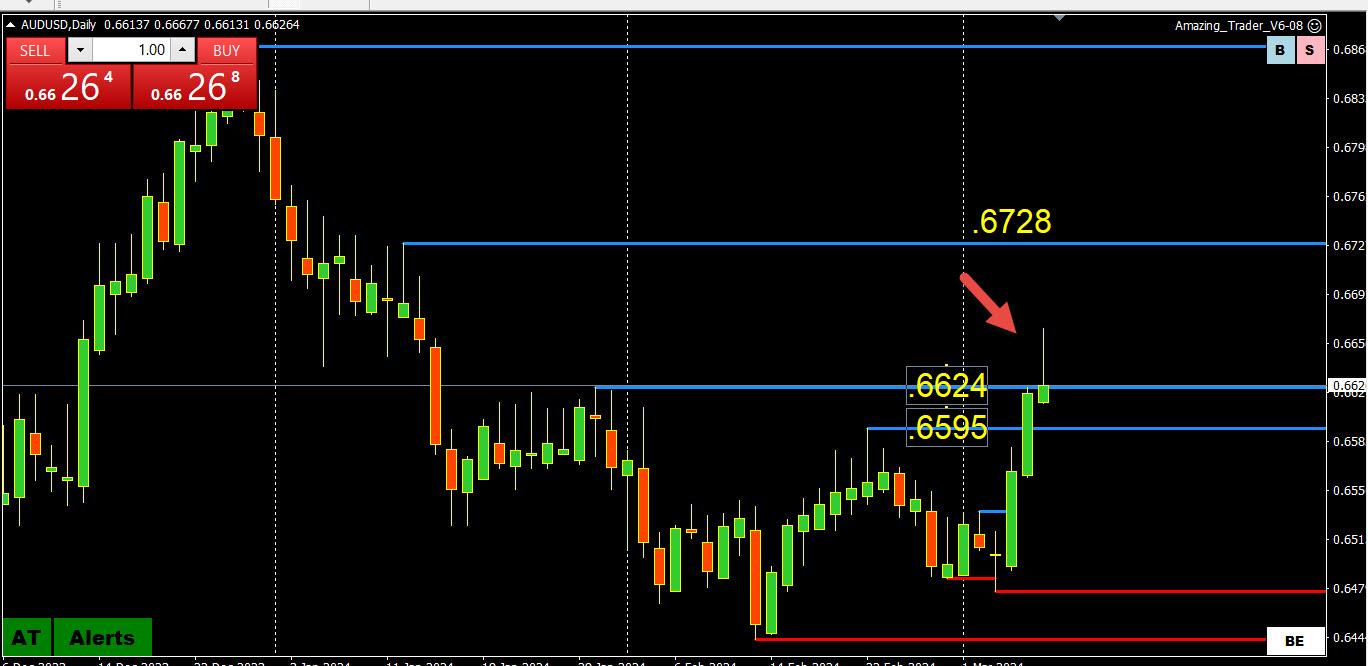
Breakout above .6624 and then retreat towards it. A large wick at the high suggests the possibility of a pause but only if AUDUSD moves back below.6624.
Only below .6595 would put it back into its old range, making .6595-6624 a support zone.
The 4-hour chart shows .6613 as a local support.
March 9, 2024 at 10:05 pm #2744In reply to: Forex Forum
March 7, 2024 at 8:03 pm #2681In reply to: Forex Forum
March 7, 2024 at 3:48 pm #2657In reply to: Forex Forum
March 7, 2024 at 12:08 pm #2628In reply to: Forex Forum
March 6, 2024 at 7:53 pm #2595In reply to: Forex Forum
AUDUSD 4-HOUR CHART: AUDUSD the outperformer in a weak USD day

Note the 2 red lines drawn off the low. It is our Directional Indicator indicating a potential shift in risk to the upside that has played out.
.6595 = key res, .6581 res so far holding ahead of it.
The way I look at charts .6535 needs to hold to keep the risk pointed up.
March 5, 2024 at 12:34 pm #2439In reply to: Forex Forum
AUDUSD 4-Hour Chart

Similar to USDCAD, AUDUSD had a head fake after the break of .6487 STOPPED DEAD ON AT AMAZING TRADER .6477 SUPPORT
What matters now is how AUDUSD trades vs, .6500 as only back above would neutralize the downside risk.
‘
The trendline and,6535 are key levels on top.Why is the AUDUSD trading soft? China economic concerns?
March 3, 2024 at 10:33 pm #2366In reply to: Forex Forum
February 28, 2024 at 5:48 pm #2197In reply to: Forex Forum
February 28, 2024 at 3:31 pm #2183In reply to: Forex Forum
February 28, 2024 at 9:57 am #2153In reply to: Forex Forum
February 28, 2024 at 9:34 am #2150In reply to: Forex Forum
February 27, 2024 at 5:12 am #2089In reply to: Forex Forum
AUDUSD Analysis: Sideways Move Continues, Resistance and Support Levels
The AUDUSD pair has been moving sideways within a trading range between 0.6521 and 0.6594.

As long as the 0.6521 support level holds, the pullback from 0.6594 could be seen as corrective consolidation for the uptrend from 0.6442. Another rise is still possible after the consolidation.
The initial resistance level is located at 0.6555. A breakthrough of this level could trigger another rise to test the 0.6594 resistance level. A breakthrough of this level would aim for the 0.6624 resistance level.
On the downside, a breakdown below the 0.6521 support level would indicate that the upside move has already completed at 0.6594. In this case, another fall towards the 0.6442 previous low could be seen.
February 26, 2024 at 8:48 pm #2087In reply to: Forex Forum
NZDUSD 1-hour chart

Blue lines dominate, indicating risk on the downside.
Key support is clear at .6156-61, which needs to hold to prevent a further push to the downside. Should the support zone give way then .6150 (psychological) and .6128 are next.
On the upside, .6200 is the key resistance, minor at .6185 ahead of it.
Underperformers
NZDUSD and AUDUSD were the underperformers today,
February 25, 2024 at 11:21 pm #2031In reply to: Forex Forum
February 23, 2024 at 5:21 am #1971In reply to: Forex Forum
AUDUSD Breaks Free: Uptrend Resumption or False Dawn?
AUDUSD has clawed its way back from recent lows, breaking above the confines of the falling price channel on the 4-hour chart. This bullish breakout raises questions: Has the downtrend truly ended, or is this just a temporary reprieve?

Uptrend Resumed: Channel Breakout as Confirmation?
Channel Breach: The break above the falling channel, established from the 0.6870 high, signifies a potential shift in momentum. This suggests a possible end to the downtrend and the start of a new uptrend from the recent low of 0.6442.
Potential for Continued Rally:
Resistance Levels: If the uptrend continues, the next target for AUDUSD could be the 0.6624 resistance level. Surpassing this hurdle would open the door for further gains towards 0.6700, solidifying the bullish momentum.
Support Levels to Watch for Pullbacks:
Initial Support: The initial support to watch is at 0.6532. A breakdown below this level could indicate a loss of momentum and a potential pullback towards the 0.6500 area.
Key Support: A further breach below 0.6500 could trigger a decline towards the previous low of 0.6442, potentially signaling a resumption of the downtrend.Overall Sentiment:
The technical picture offers a mixed outlook for AUDUSD. The breakout from the channel suggests a potential trend reversal, but confirmation will come from holding above the 0.6532 support and pushing towards the 0.6624 resistance. Monitoring the price action around these key levels will be crucial in determining the pair’s next move.
Disclaimer: This analysis is for informational purposes only and should not be considered as investment advice. Please conduct your own research before making any trading decisions.
February 21, 2024 at 3:04 am #1834In reply to: Forex Forum
AUDUSD Bounces, But Can It Break the Downtrend?
AUDUSD has staged a comeback from its recent low of 0.6442, but faces a stiff challenge at the upper boundary of the falling price channel on the 4-hour chart. This resistance zone will determine whether the current rally is a mere blip in the downtrend or a sign of a potential trend reversal.

Upside Potential: Can the Rally Extend?
- 0.6624 Resistance in Sight: If the bulls manage to push the price above the price channel resistance, it could signal a significant breakout and pave the way for further gains towards the next resistance level at 0.6624. This would indicate a shift in momentum and potentially mark the start of a new uptrend.
Support Levels to Watch for Downtrend Continuation
- 0.6520: Initial Hurdle: If the upside momentum fades and sellers regain control, a breakdown below the initial support level of 0.6520 could trigger another decline. This could lead to a retest of the 0.6442 support level that marked the recent low.
- Lower Support Levels: Further breakdown below 0.6442 would open the door for falls towards the 0.6400 area, solidifying the downtrend and suggesting the recent bounce was just a corrective move within the larger downward trend.
Overall Sentiment
The outcome of the price action around the 0.6520 support level and the price channel resistance will be crucial in determining AUDUSD’s next move. A breakout above the channel could indicate a potential trend reversal and upside potential towards 0.6624. Conversely, a breakdown below 0.6520 and subsequent breach of 0.6442 would reinforce the downtrend and suggest further decline towards 0.6400 or lower.
Disclaimer: This analysis is for informational purposes only and should not be considered as investment advice. Please conduct your own research before making any trading decisions.
-
AuthorSearch Results


Search
© 2024 Global View