
-
AuthorSearch Results
-
July 13, 2024 at 9:02 am #9094
In reply to: Forex Forum
July 12, 2024 at 10:22 am #9019In reply to: Forex Forum
July 12, 2024 at 10:22 am #9020In reply to: Forex Forum
July 12, 2024 at 6:58 am #9009In reply to: Forex Forum
July 11, 2024 at 9:20 pm #9002In reply to: Forex Forum
July 10, 2024 at 11:01 am #8857In reply to: Forex Forum
July 9, 2024 at 12:36 am #8768In reply to: Forex Forum
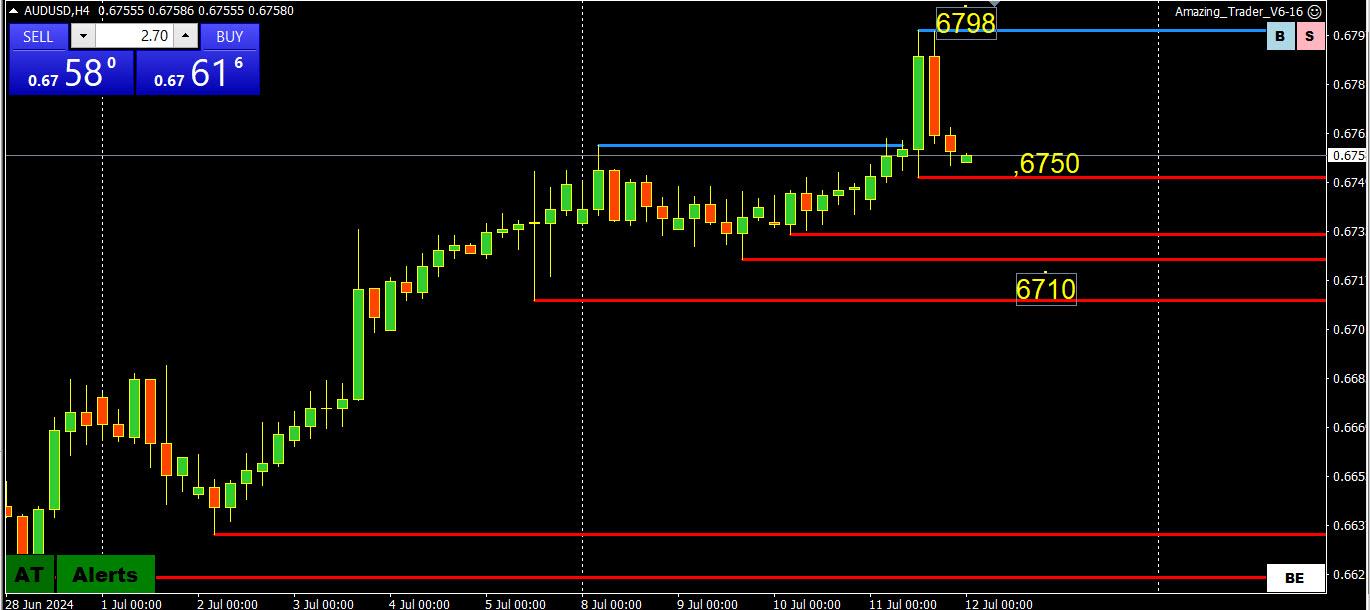
AUDUSD 4 HOUR CHART – AIMING FOR .68?
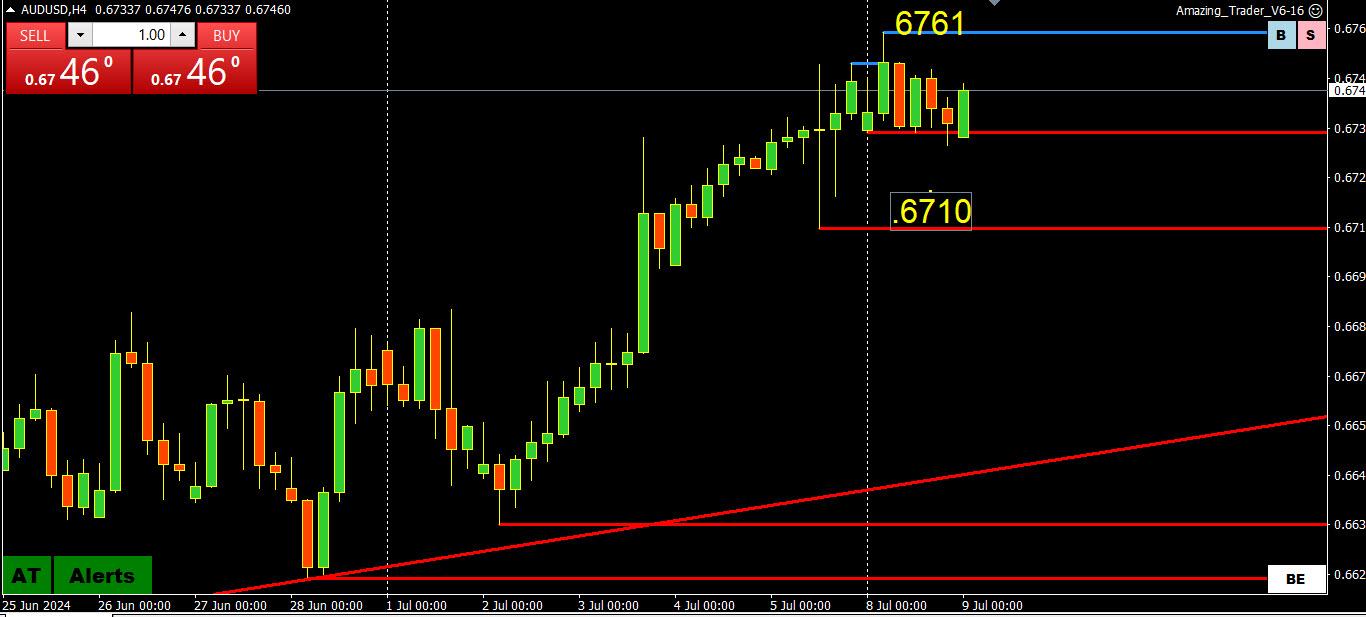
Key target is close to .69 with .6800 the next obstacle. To make a run at .68, .6750 would need to become support.
Minor range .6710-.6761
Split the range and .6735 is the midpoint… needs to hold to keep a bid.
CLICK BELOW TO LEARN ABOUT THE
GLOBAL-VIEW TRADING CLUB
 July 8, 2024 at 5:12 pm #8743
In reply to: Forex Forum
One of those Mondays…Here is my Power of 50 article as GBPUSD, EURUSD, AUDUSD and USDJPY all paused around or shy of respective 50 levels in what turned into a slow drip, paint drying session.
FWIW the softer GBPUSD tine appears toi be coning from EURGBP buying.
July 8, 2024 at 11:30 am #8716In reply to: Forex Forum
AnonymousAUDUSD 4 HOUR CHART – STILL BULLISH
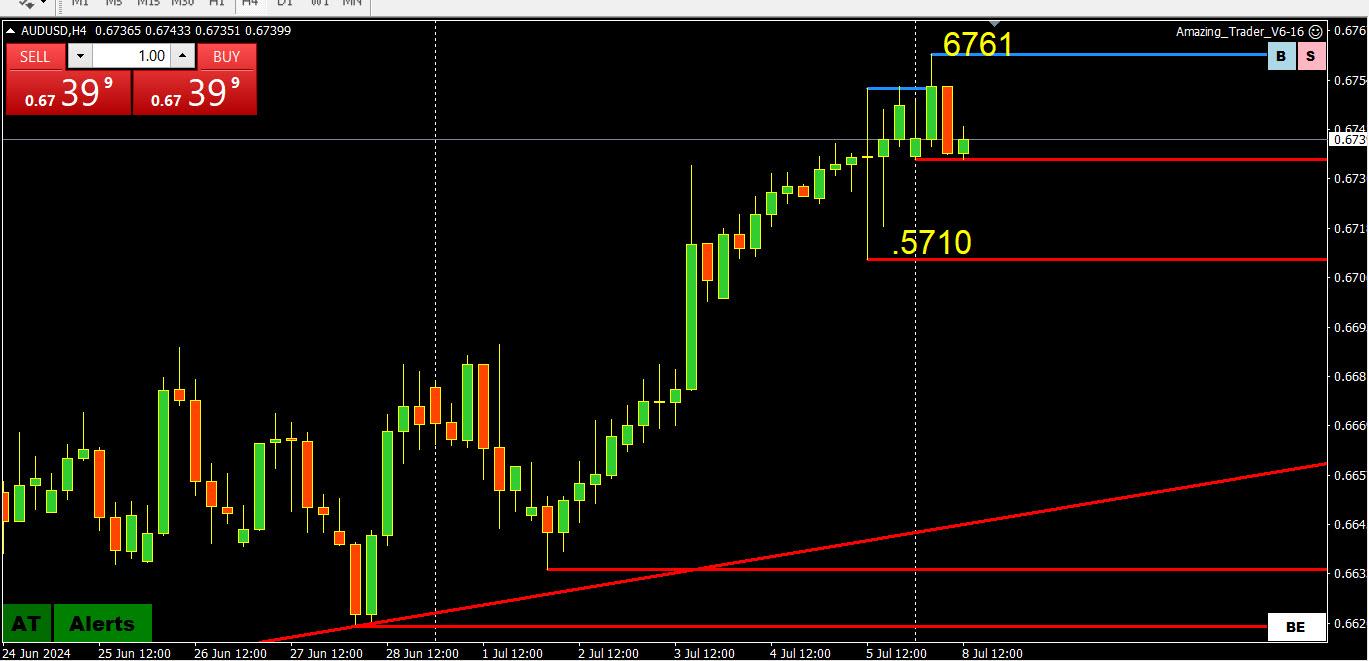
AUDUSD finds support by being the onky major CB with talk oif potential rate hikes rather than rate cuts.
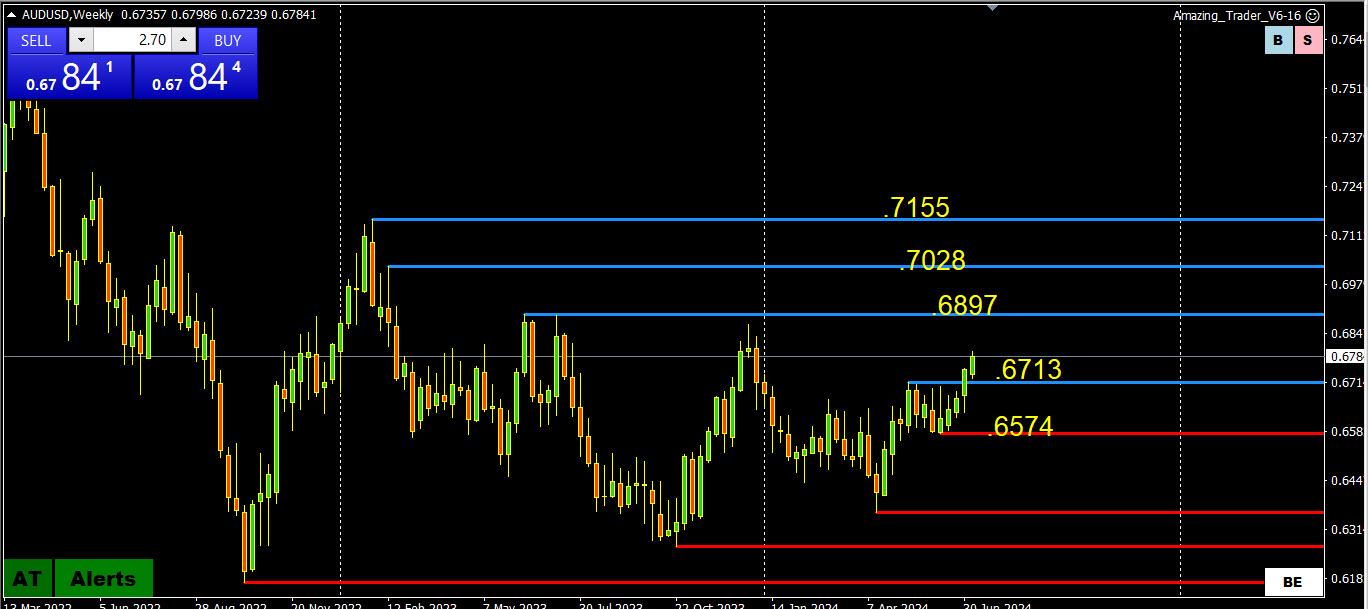
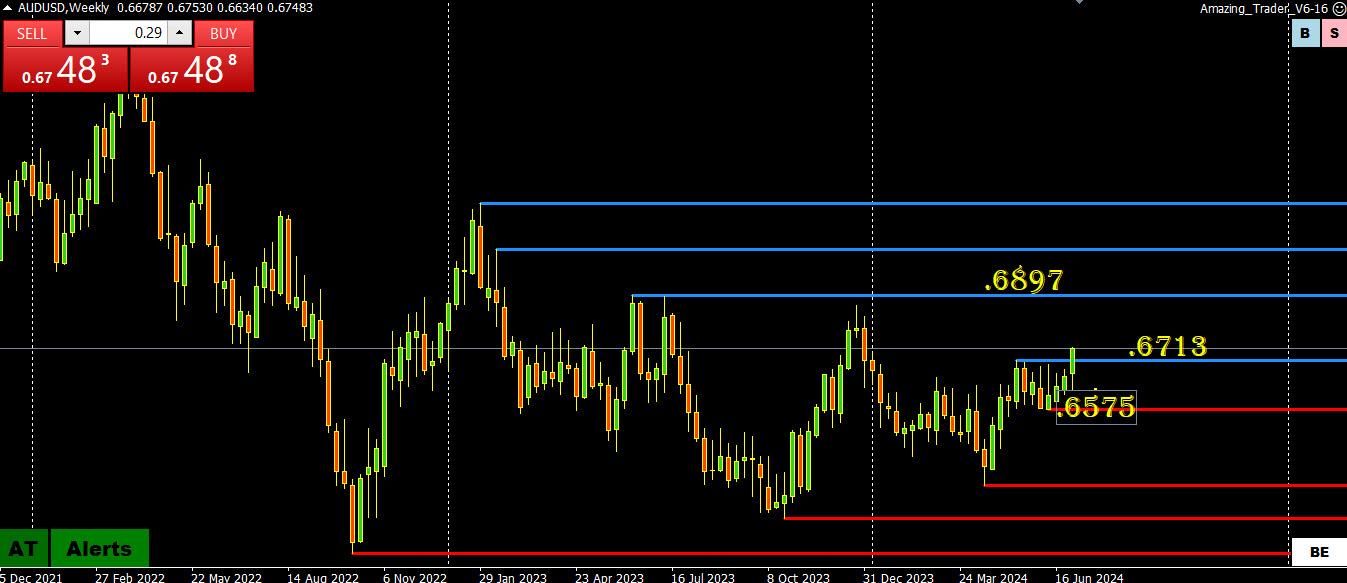
As I noited, I had to go to the weekly to find the next key target, which is not until nearly .6900.
In the sbsencde of key resistance, the new level to watch is .6761 high.
Expect support as long as it trades aboive .6710.
July 7, 2024 at 12:37 pm #8672In reply to: Forex Forum
July 7, 2024 at 12:31 pm #8671In reply to: Forex Forum
June 28, 2024 at 1:23 pm #8242In reply to: Forex Forum
June 26, 2024 at 7:37 pm #8140In reply to: Forex Forum
EURUSD DAILY CHART = PAUSE OR BREAKDOWN?
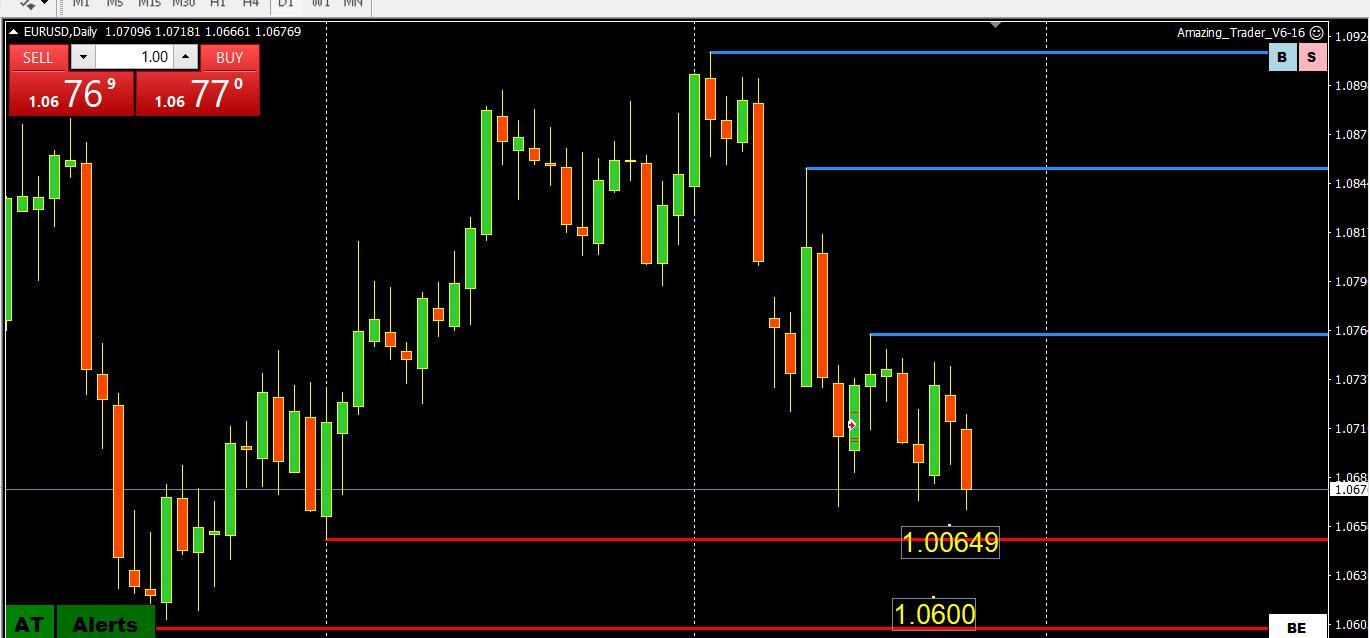
With the exception of the AUDUSD, which gave back its post-CPI gains, it has been a USD day with the highlight the USDJPY breakout SMASHING through 160.16.
EURUSD joined in the party and although the was low just 1 pip below 1.0667, it is probably only a pause unless 1.0700+ is renewed.
Should 1.0666-67 be firmly broken, 1.0649 and 1.0600 become the targets.
June 26, 2024 at 9:36 am #8114In reply to: Forex Forum
AUDNZD DAILY CHART – ANTHERTWINNER IS…
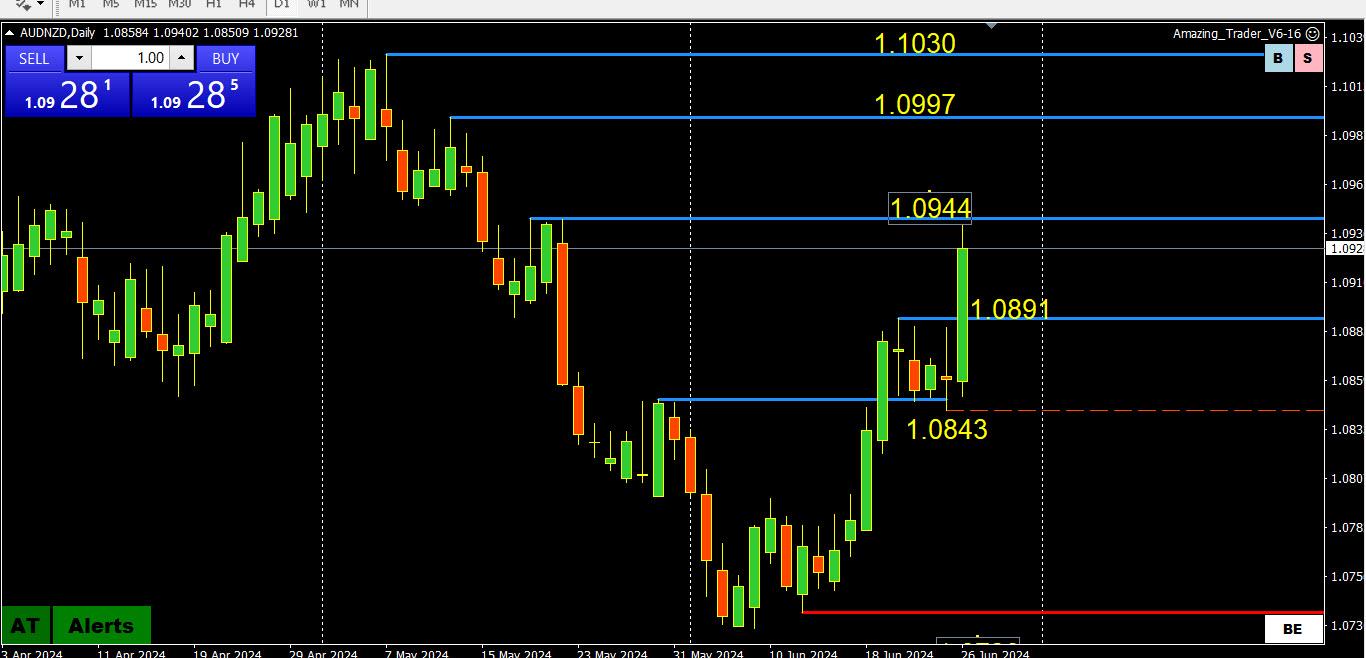
How do we know when a cross flow is driving the spot market?
One clue is when two related currencies move in opposite direction.
This is the case with the AUDUSD (higher) and NZDUSD (lower)
Key resistance next at 1.0944, blocks a move to the maor 1.0997-1.1030.
Expect support on dips while above 1.0840-90, stronger if above the top of this band.
June 26, 2024 at 9:26 am #8113In reply to: Forex Forum
AUDJPY DAILY CHART – A WINNER IS…
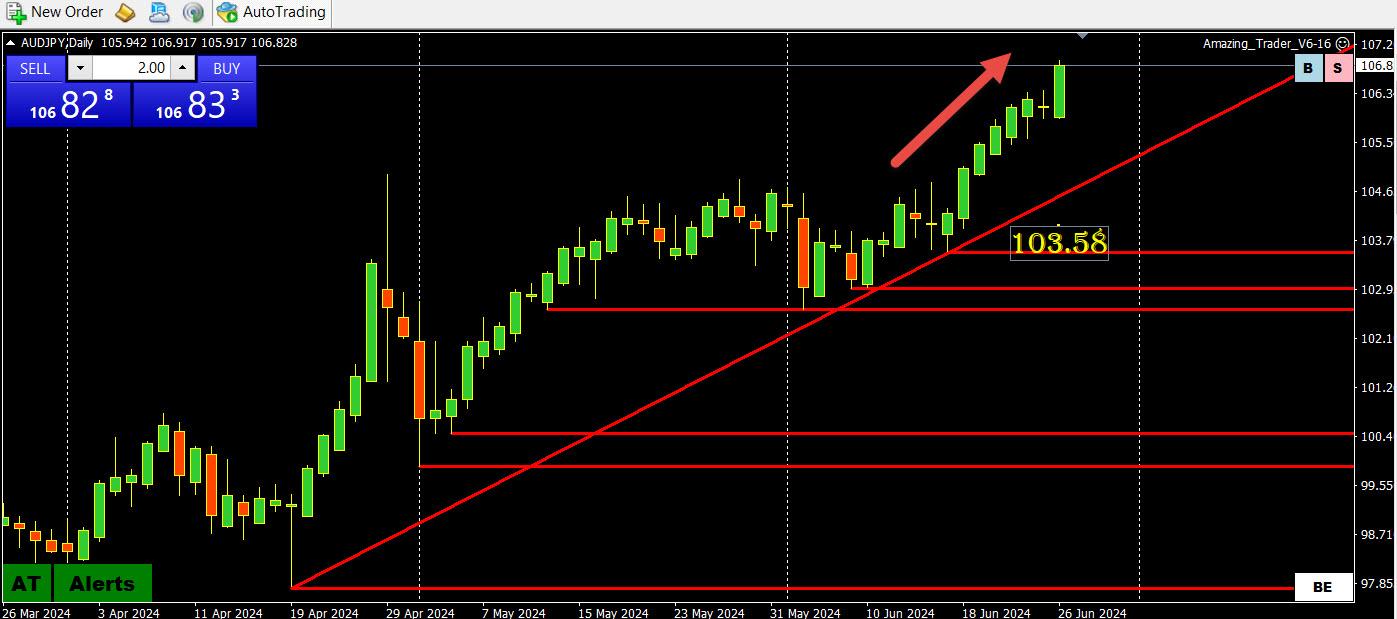
AUD up after hotter CPI (scroll down to see an AUDUSD chart posted pre-CPI).
AUDJPY has been a winner, extending its winnig streak to 9 days and trading in unchartered waters with no clear resistance other than the new high.
Cross offsets are one reason USDJPY is pressing towards 160.
Expect a buy the dip on any decent retracement unless 103.58 is broken..
June 25, 2024 at 9:48 pm #8106In reply to: Forex Forum
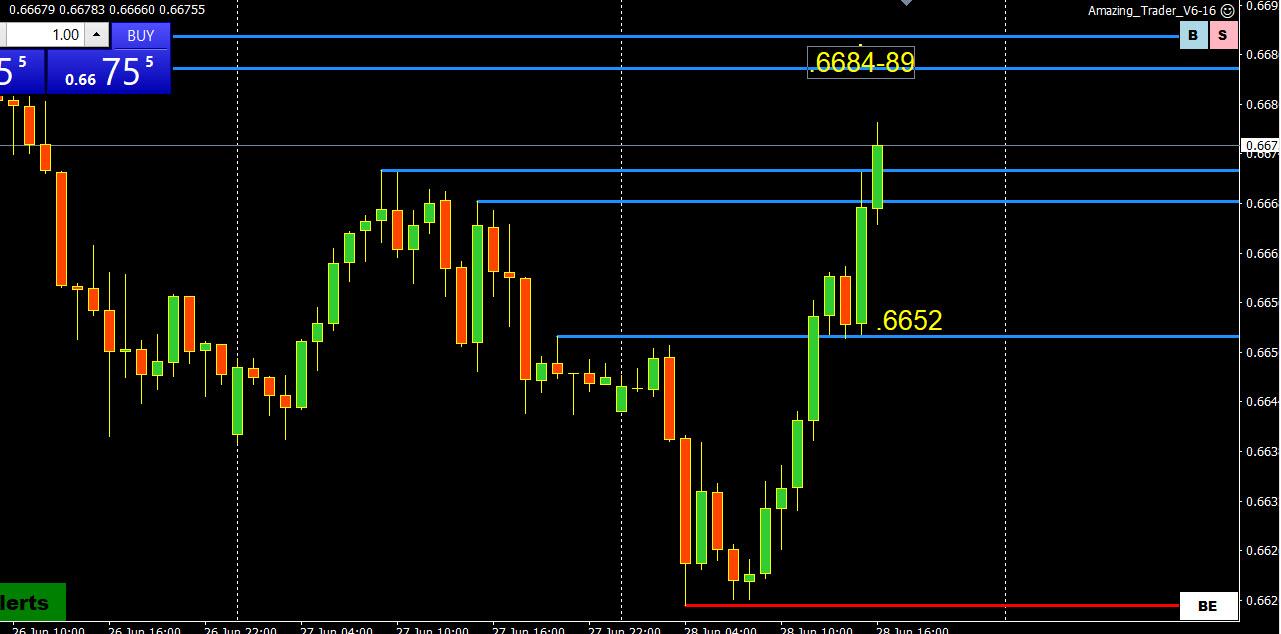
AUDUSD 4 HOUR CHART – WAITING FOR CPI
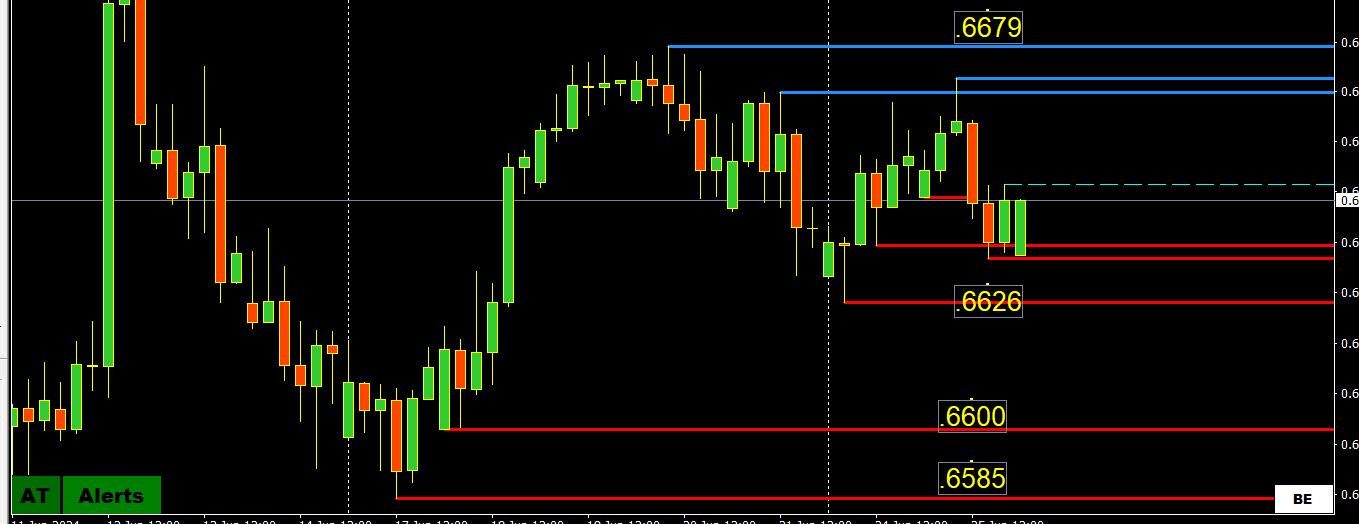
Chart shows key levels on both sides in a market that remains hyper sensitive to inflation data.
See a detail preview in Newsquawk’s Week Ahead
June 24, 2024 at 4:10 pm #8057In reply to: Forex Forum
June 21, 2024 at 12:04 pm #7927In reply to: Forex Forum
June 19, 2024 at 8:52 am #7862In reply to: Forex Forum
USDX 4 HOUR CHART – EURUSD PROXY (57.6% OF THE INDEX
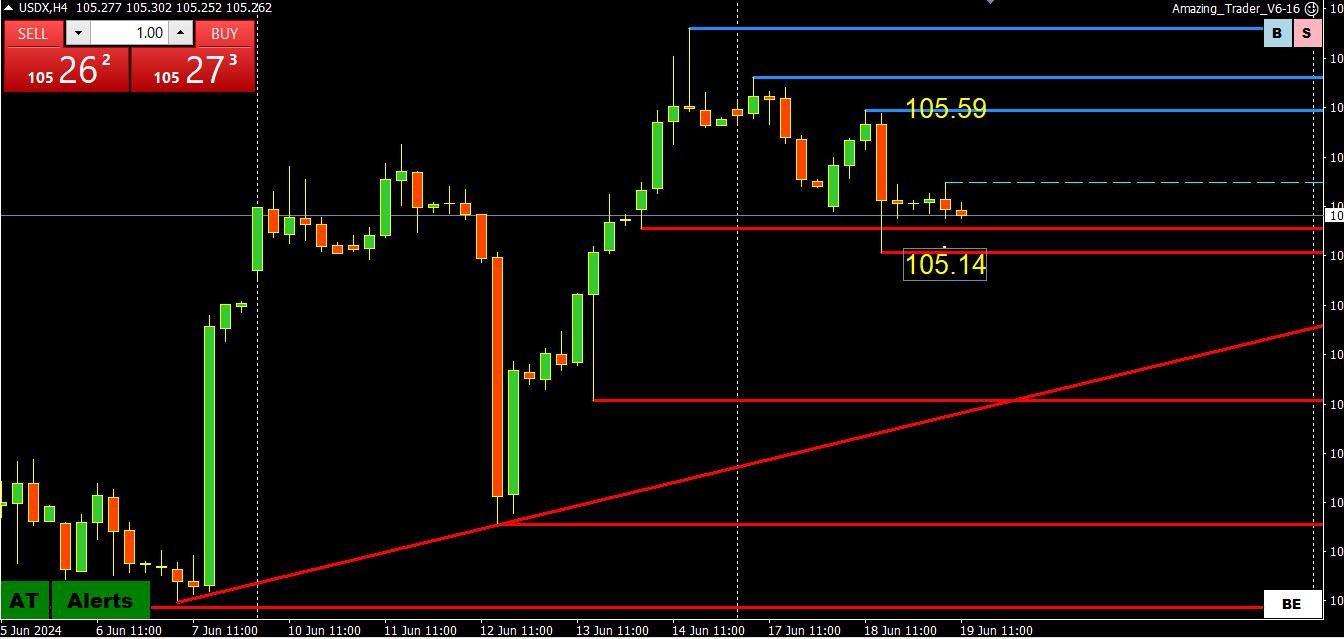
Let’s start the day by looking at the USD INdex, where momentum has TILTED to the downside.
However, using USDX as a EURUSD proxy suggests EURUSD would need to extablish above 1.0750 (AND THEN 1.0760-65) to Put pressure on the USDX downside where 105.14 is THE FIRST LEVEL OF support.
OTHER CURRENCIES VS. THE DOLLAR
AUDUSD BID BUT HELD A TEST OF .6675 – SCROLL DOWN TO SEE CHART
USDJPY HIGH YESTERDAY WAS 2 PIPS BELOW THE KEY 158.25 HIGH
EURUSD CAN’T MAKE UP ITS MIND. BUT FINDS SUYPPORT WHILE ABOVE 1.0720.. RANGE WIDENED TO A PALTRY 1.0725-1.0742 (WON’T LAST)
EURGBP A TOUCH LOWER WAITING FOR THE BOE TOMORROW
US holiday clearly dampening trading activity
June 18, 2024 at 9:01 pm #7853In reply to: Forex Forum
June 18, 2024 at 5:29 pm #7851In reply to: Forex Forum
June 13, 2024 at 7:10 am #7636In reply to: Forex Forum
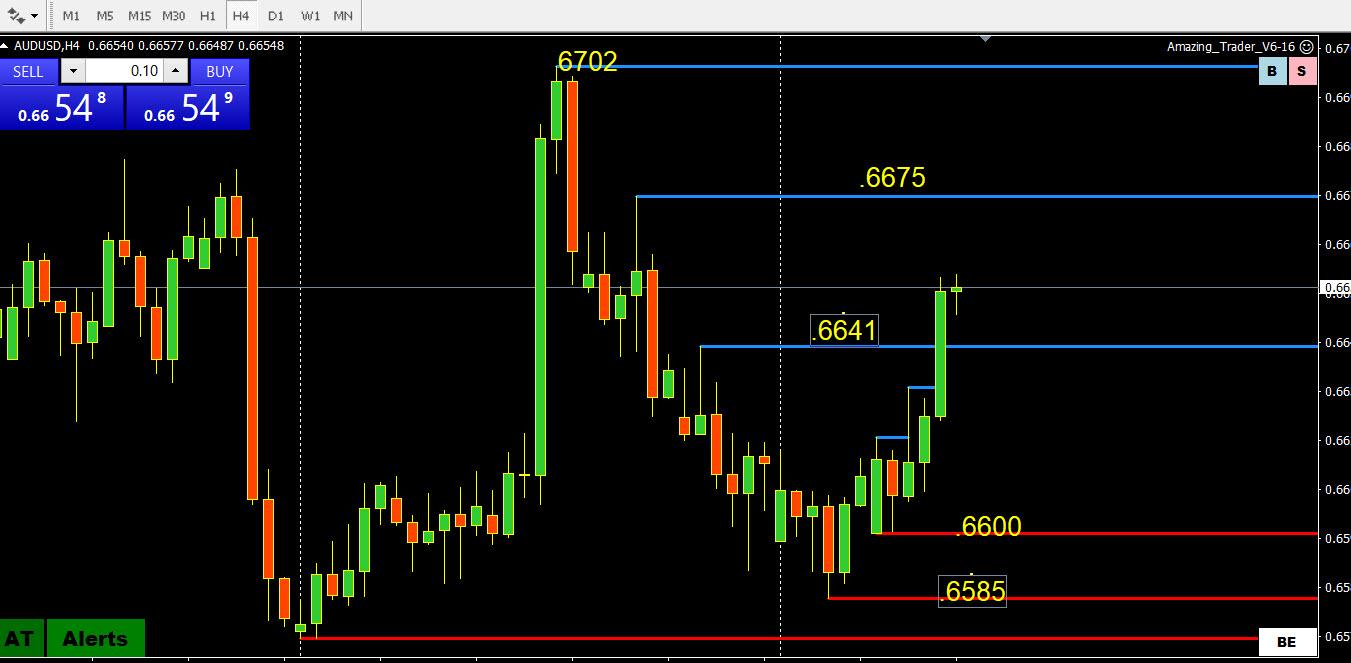
AUDUSD 4 HOUR CHART – Retracements or faikures?
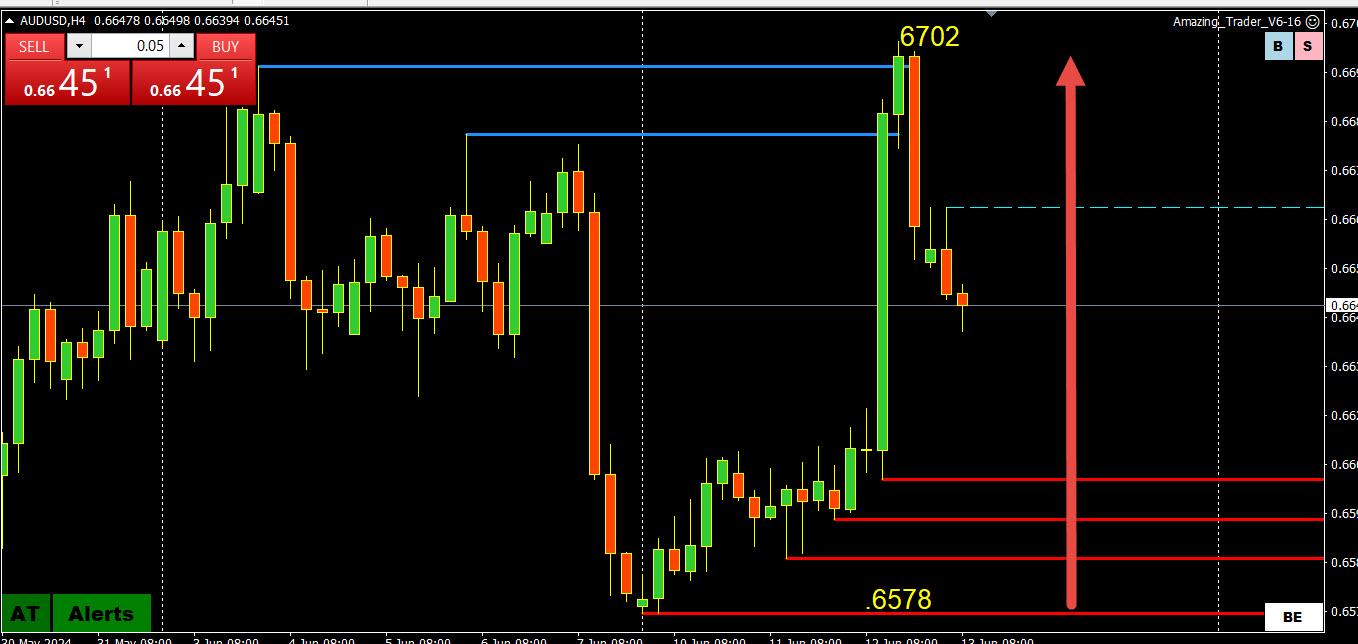
With the dollar recovering after yesterday’s stright line data driven moves that paused shy of recent dollar lows, look at FIBO levels if yiu do not see any nearby levels.(e.g. 50% of 6578-6702 = 6639)
June 12, 2024 at 9:50 pm #7632In reply to: Forex Forum
So I saw the same old thing yesterday pre-data, with the stalls and the contra-activity. If they are buying into data that heavy what do you think they are doing? Is big money confused? Is it a conspiracy? No. They are running 100k times what you do. They compete with other banks who don’t oblige to be on the same team. So, price discovery happens. Big guns win every time. Right now the market is dazed and waiting for the next conviction post-Fed. Something is going to break. My thought is maybe not the Fed. So unless something profound changes it is hgher for longer and they will price in mistakes. Dollar is bid, which is why I sold AudUsd this morning vs Euro because they are a little fluffy over there. The only thing that would make Aussie go higher is a gold run or war. From here.
June 9, 2024 at 10:50 am #7465In reply to: Forex Forum
AIUDUSD DAILY CHART – GAME CHANGER LEVEL
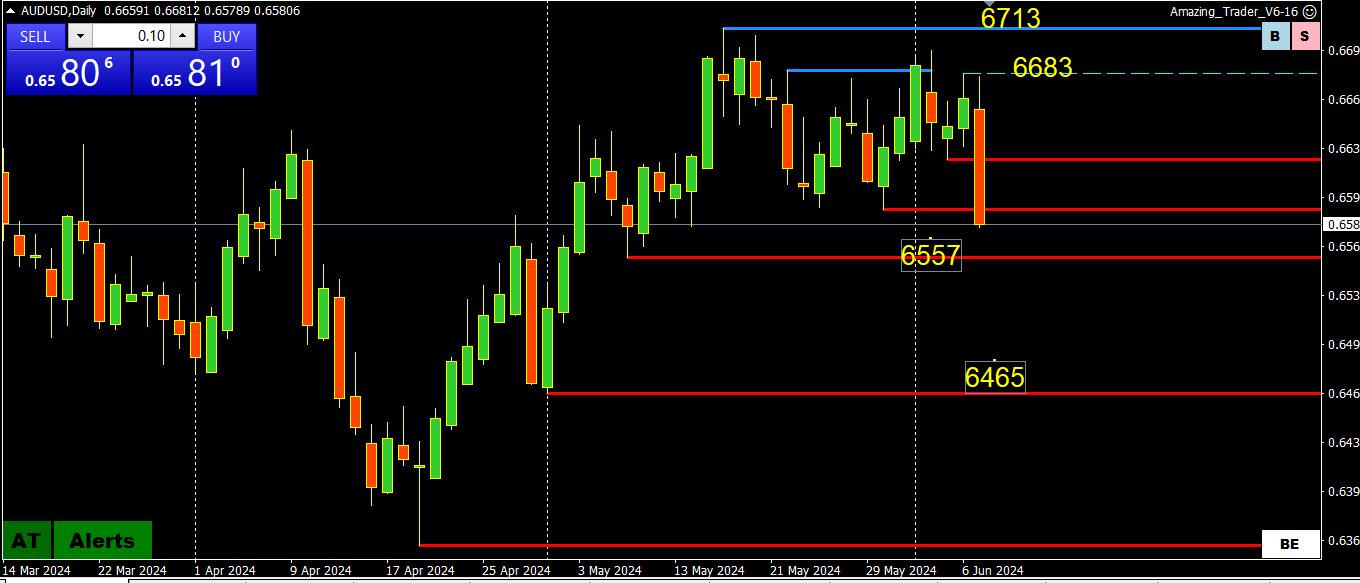
After setting a high at .6713, AUDUSD spent the next 3 weeks trying to retest it before falling off a cliff following the US jobs report on Friday.
I like to look at levels I call game changers, levels that if broken would shift the focus the other way.
The game changer level in AUDUSD is .6557 (use .6550 as well), so keep an eye on it should Friday’s moves be extebded.
June 4, 2024 at 10:27 am #7230In reply to: Forex Forum
June 2, 2024 at 9:42 am #7131In reply to: Forex Forum
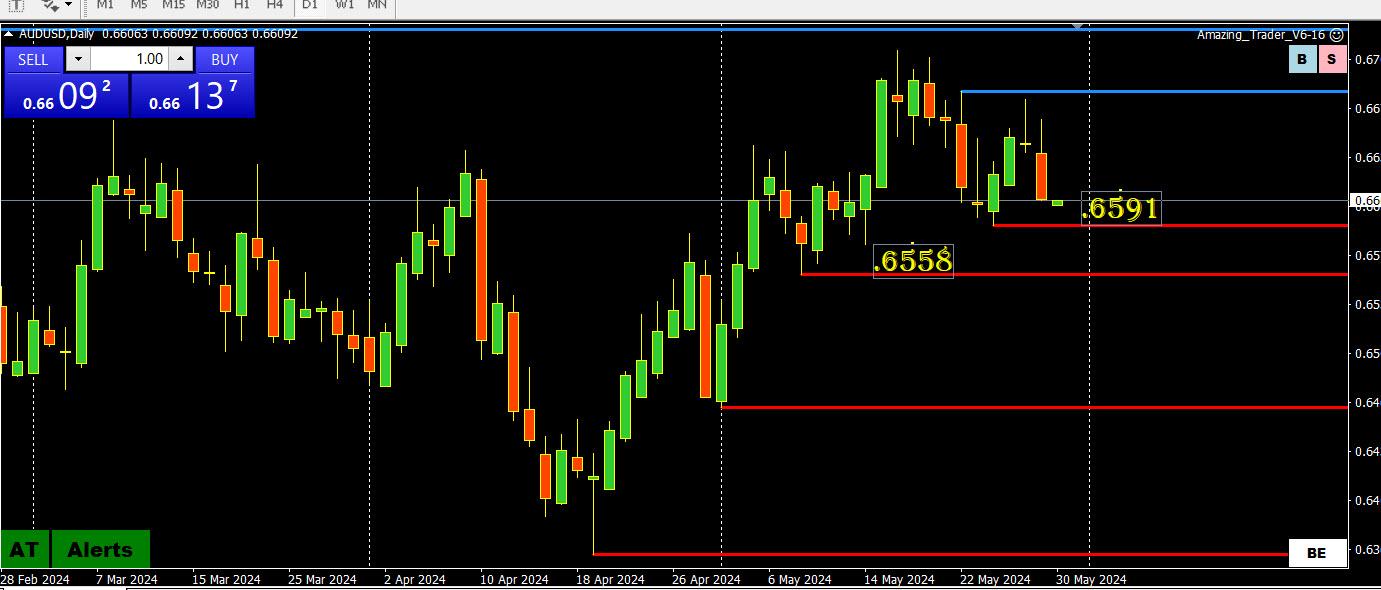
AUDUSD DAILY CHART – CONSOLIDATION AS WELL
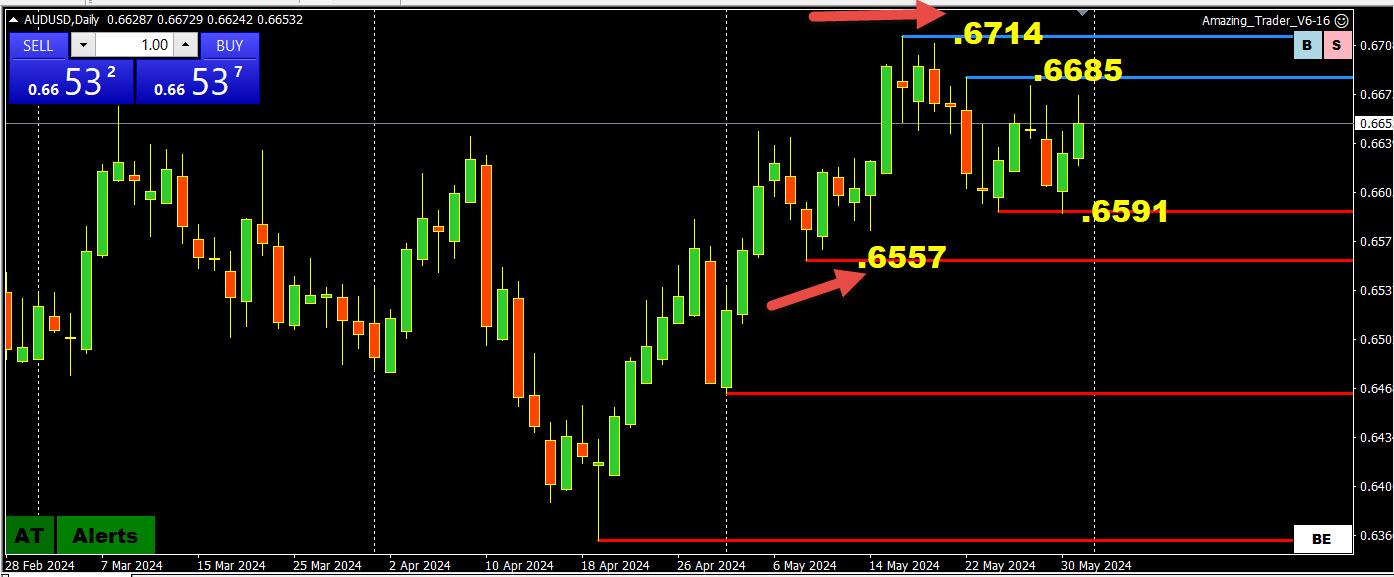
If you take a step back here as well you will see that the AUDUSD uptrend is still inatct but consolidating after setting a high at .6714 12 days ago.
Key levels are highlighted on the chartt: .6714 on top, .6557 on the downside. Only a break of ,6557 would confirm a break of the uptrend.
Consolidation range is also shown on this chart.
As we start a new month mark down the prior month’s range (.6454-.6714) as a reference.
May 31, 2024 at 3:17 pm #7089In reply to: Forex Forum
May 29, 2024 at 9:08 pm #6995In reply to: Forex Forum
May 23, 2024 at 9:22 pm #6782In reply to: Forex Forum
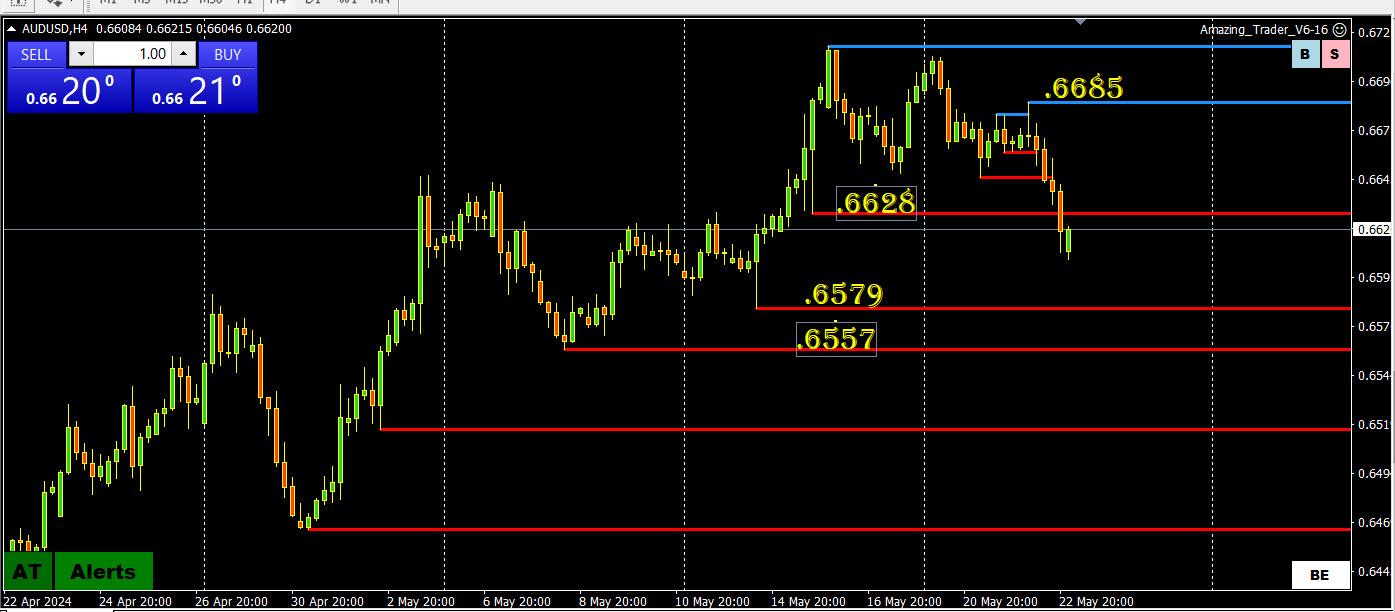
AUDUSD 4-HOUR CHART –
MEN
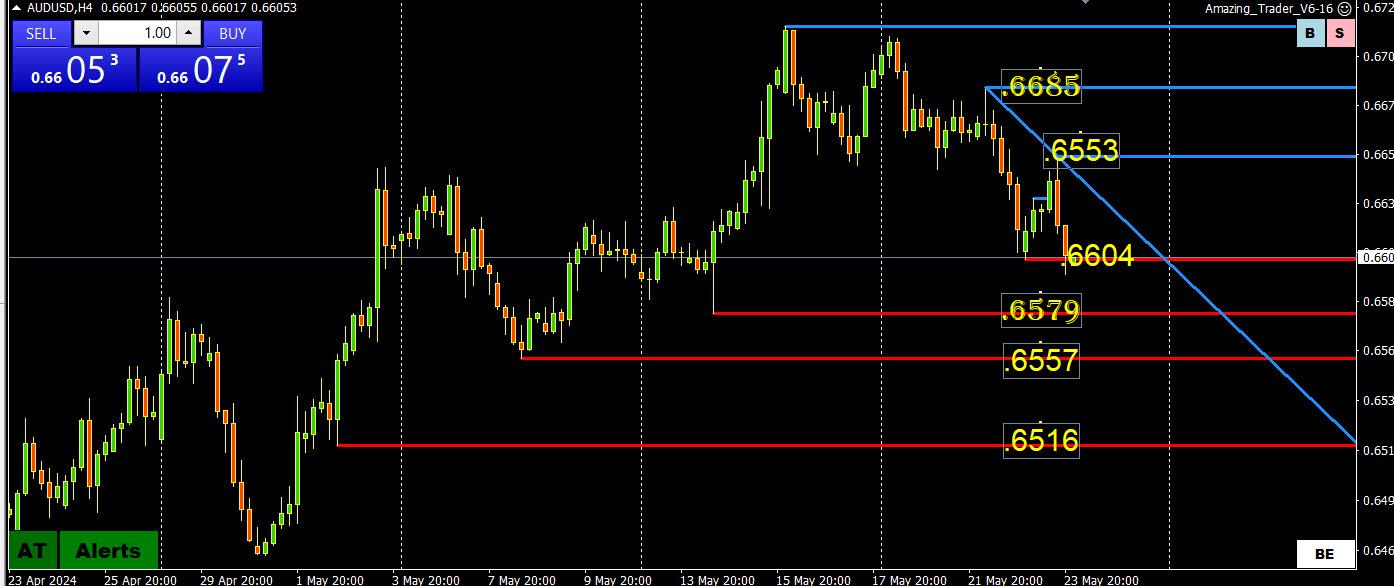
LOOK AT WHERE AUDUSD FAILED ON THE UPSIDE (ABOVE THE .6650 LEVEL), WHICH NOW BECOMES A KEY RESISTANCE.
ON THE DOWNSIDE, YOU CAN SEE ON THIS CHART WHERE KEY LEVELS IN THE .65XX LIE.
AUD SEEMS HOSTAGE TO RISK OFF AT THE MOMENT, SO HOW STOCKS TRADE NEED TO BE WATCHED FOR A CORRELATION.
CURRENT RISK IS TILTED DOWN. BUT TO KEEP IT SIMPLE, .6600 SEEMS PIVOTAL IN DETERMINING WHETHER AUD GOES FOR .6579 AND BELOW.
May 22, 2024 at 9:36 pm #6692In reply to: Forex Forum
-
AuthorSearch Results
 f

Search
© 2024 Global View