
-
AuthorSearch Results
-
May 8, 2025 at 8:03 pm #24408
In reply to: Forex Forum
May 8, 2025 at 1:11 pm #24287In reply to: Forex Forum
Quick update:
EURUSD PAUSED ABOVE 1.1265 BOTTOM OF RANGE SUPPORT
GBPUSD PAUSED ABOVE 1.3233 BOTTOM OF RANGE SUPPORT
USDJPY PAUSED BELOW 145
GOLD (XAUUSD) IS BACK TO 3360 AFTER RUNNING STOPS BELOW IT
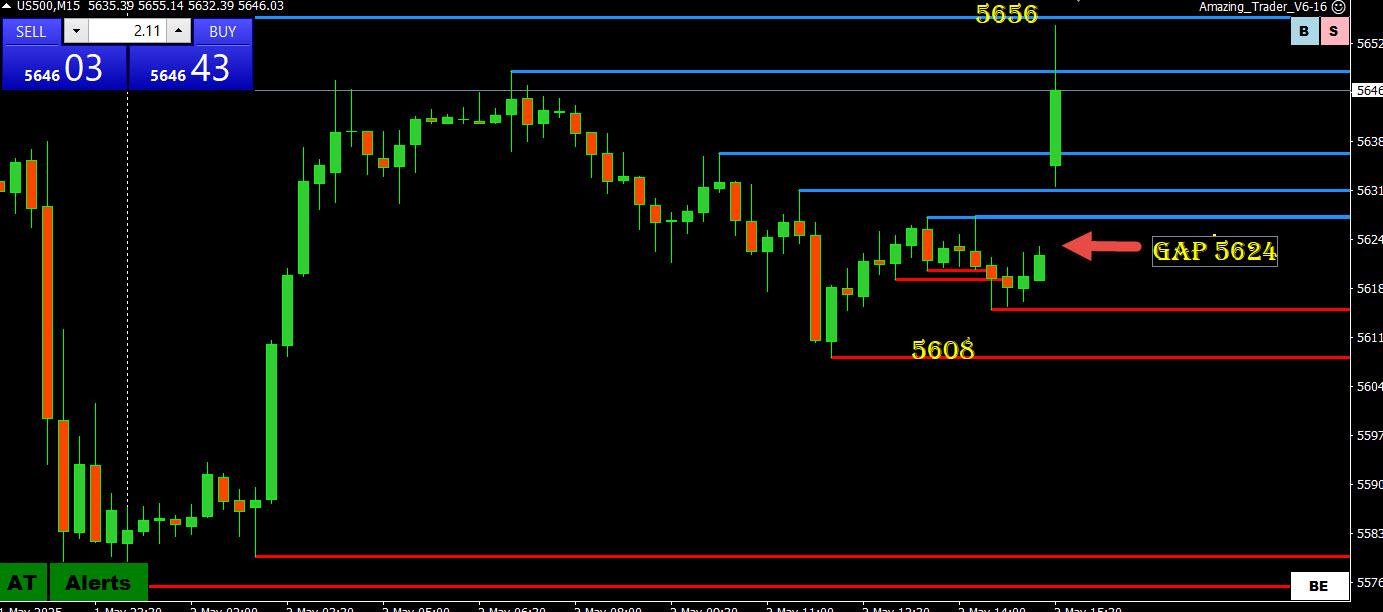
SP500 PAUSED BELOW 5700
NEXT FOCUS; TRUMP WILL TOUT UK TRADE DEAL… MARKET REACTION WILL BE MORE IMPORTANT THAN THE WORDS
May 8, 2025 at 9:41 am #24192In reply to: Forex Forum
US500 – SP500 4 HOUR CHART -What is AT showing

You have seen me use AT (The Amazing Trader) for my charts.. not only are its levels are amazing but the patterns they form are even more invaluable for trading. As I pointed out ahead of the fact ..
5575 = key support… bounced off it yesterday for a double bottom
5700 now at risk… above it would target 5727 and 5787 as next key levels
Keeps a bid while above 5645-65
Once again, reaction to news is more important than the news itself
AT = The Amazing Trader (see link is in the top menu bar for a 30 day trial)
May 7, 2025 at 8:01 pm #24179In reply to: Forex Forum
May 7, 2025 at 5:39 pm #24153In reply to: Forex Forum
US500 4 HOUR CHART -Will set risk tone

With stocks likely to set the risk on/off tone after the FOMC decision and Powell’s press conference after,let’s take a look at what a US500 chart shows.
Range is clear at 5575-5700
Only a firm break of either side SP500 would trigger a technical response.
With the Fed expected to stay pat and not send a strong signal either way, there should not be a surprise
This doesn’t mean markets won’t react but barring a surprise, expect more chop than follow through.
May 5, 2025 at 8:42 pm #23885In reply to: Forex Forum
US500 4 HOUR CHART – Crucial week

SP500
‘This is a key week with the Fed meeting and signs a trade deal could be announced soon.
How stocks react will dictate whether this move off the lows can have legs.
On the upside, 5700 is the obstacle with 5727-87 above it.
‘Only the downside, below 5575-05 would put 5500 back on the radar.
May 2, 2025 at 12:48 pm #23550In reply to: Forex Forum
May 1, 2025 at 7:49 pm #23513In reply to: Forex Forum
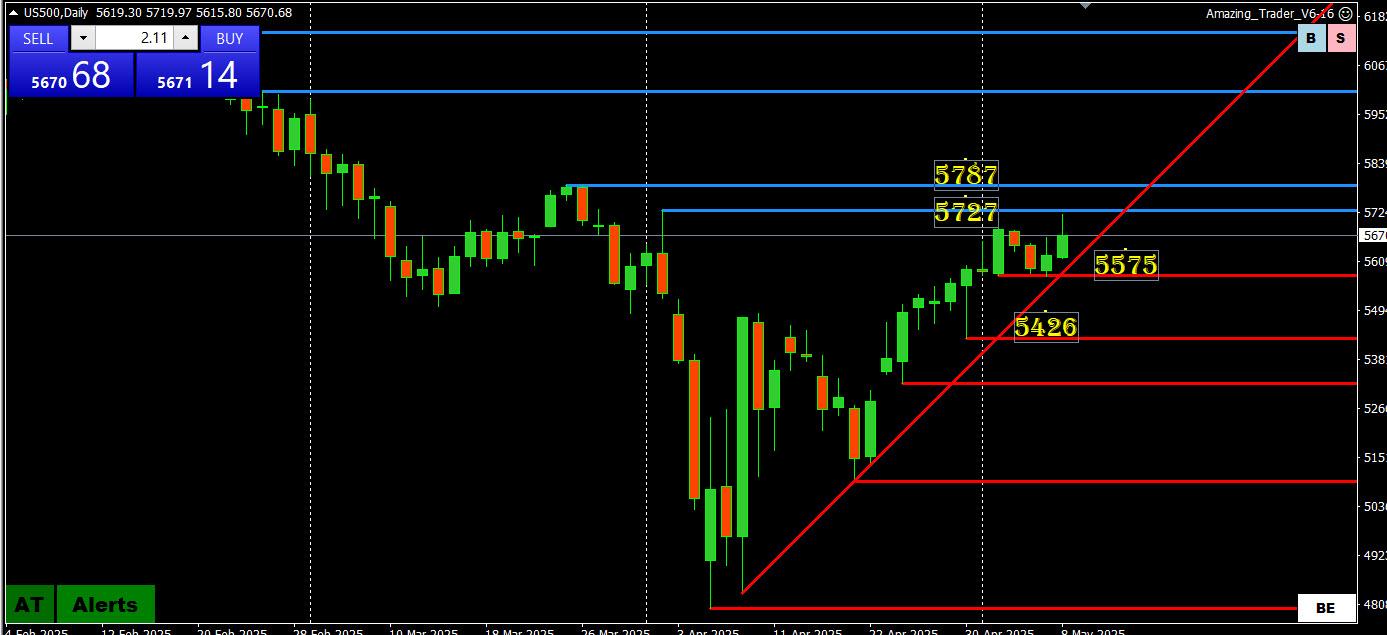
US500 DAILY CHART – Is there more to this rally?
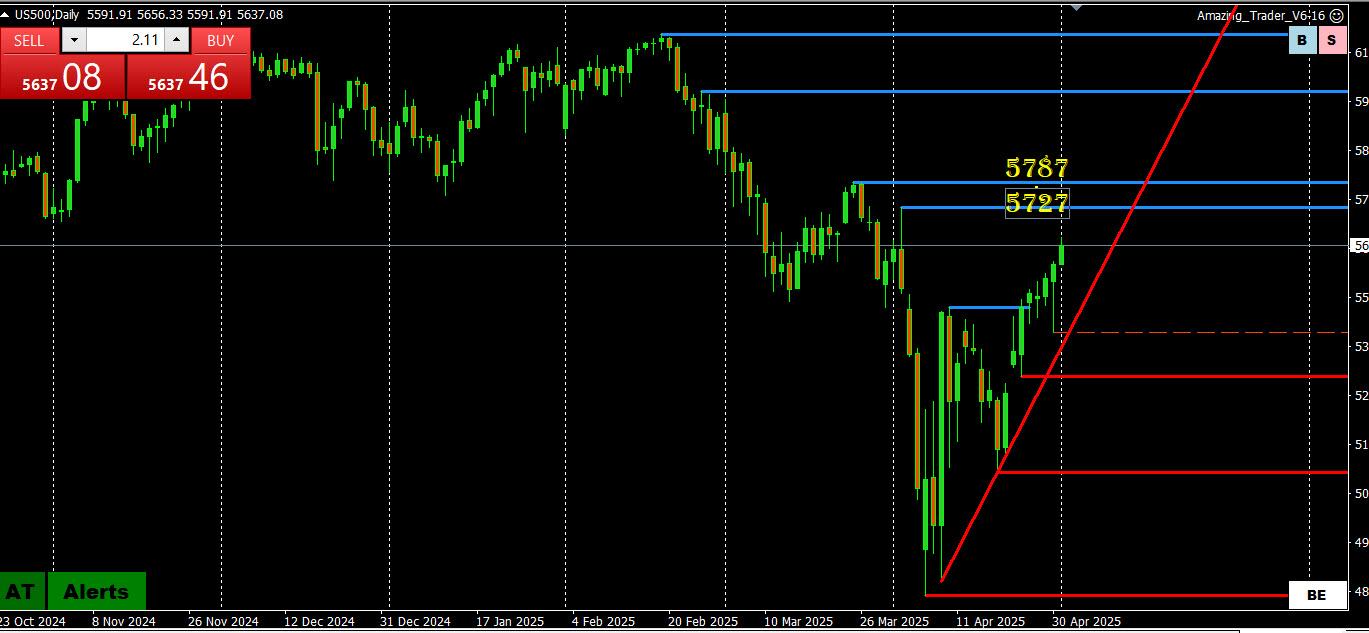
Are there more legs to this rally?
All I can say is that the bottom is in as long as SP500 trades above 5500.
On the upside, above 5727-5787 would be needed to suggest this is more than a retracement.
Watch US data… if there are to be surprises it will be on misses on downside (i.e. weaker data).
April 29, 2025 at 8:36 pm #23381In reply to: Forex Forum
SP500 4 HOUR CHART – 5500 still the key to watch
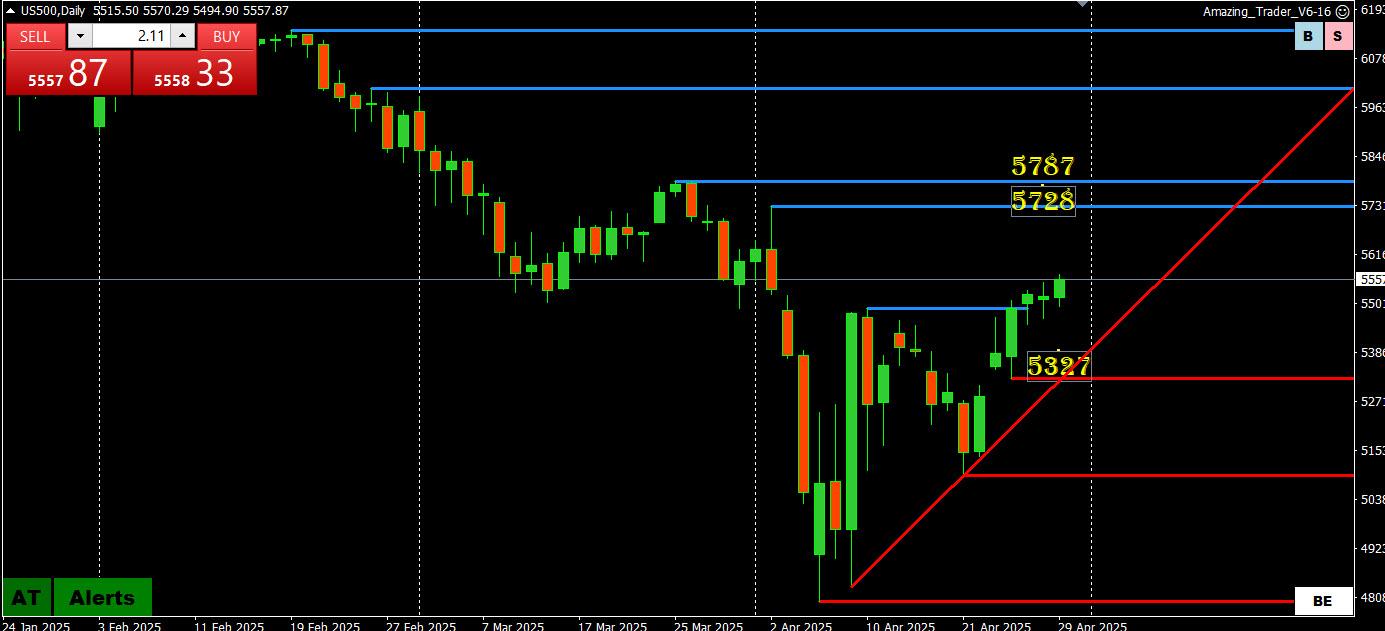
While chart shows a bottom is in for now a move through 5728 would be needed to fully negate the risk.
On the downside, 5450-00 (5500 being most important) will keep a bid while above it.
Watch the reaction to news, both economic and tariff, for a clue whether this SP500 rally has staying power.
April 29, 2025 at 2:55 pm #23361In reply to: Forex Forum
April 28, 2025 at 8:00 pm #23328In reply to: Forex Forum
April 28, 2025 at 2:11 pm #23310In reply to: Forex Forum
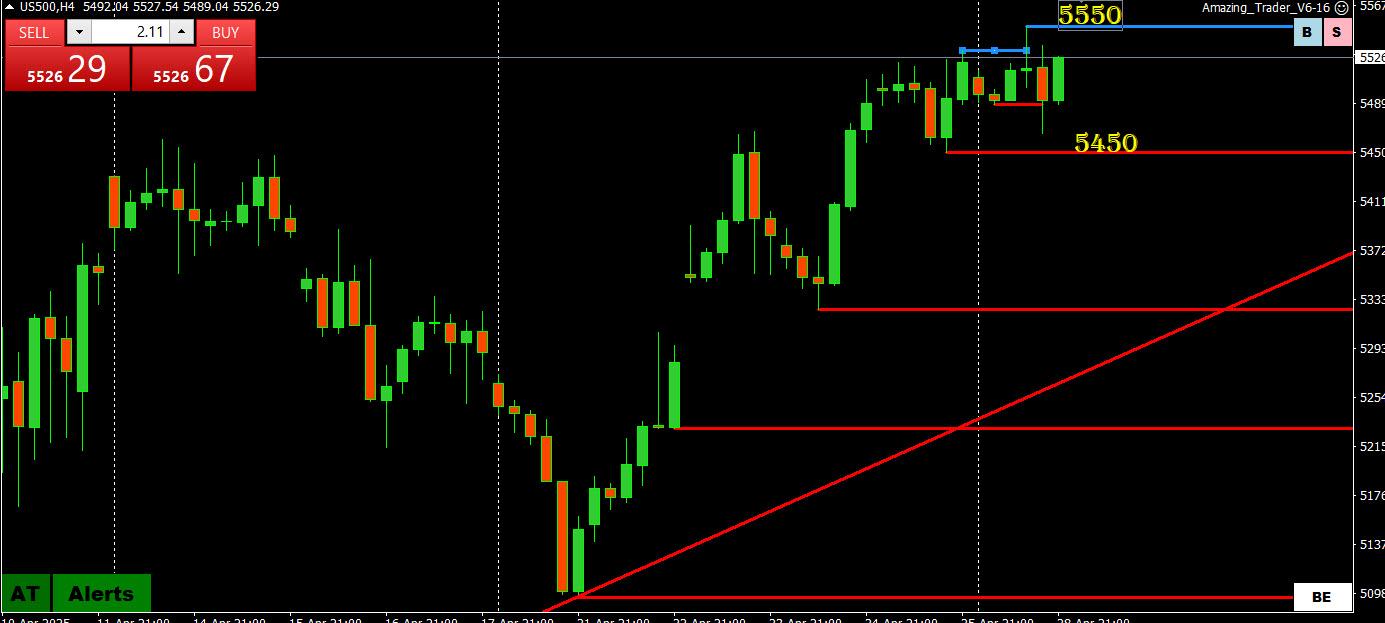
SP500 1 HOUR CHART – Watch 5500
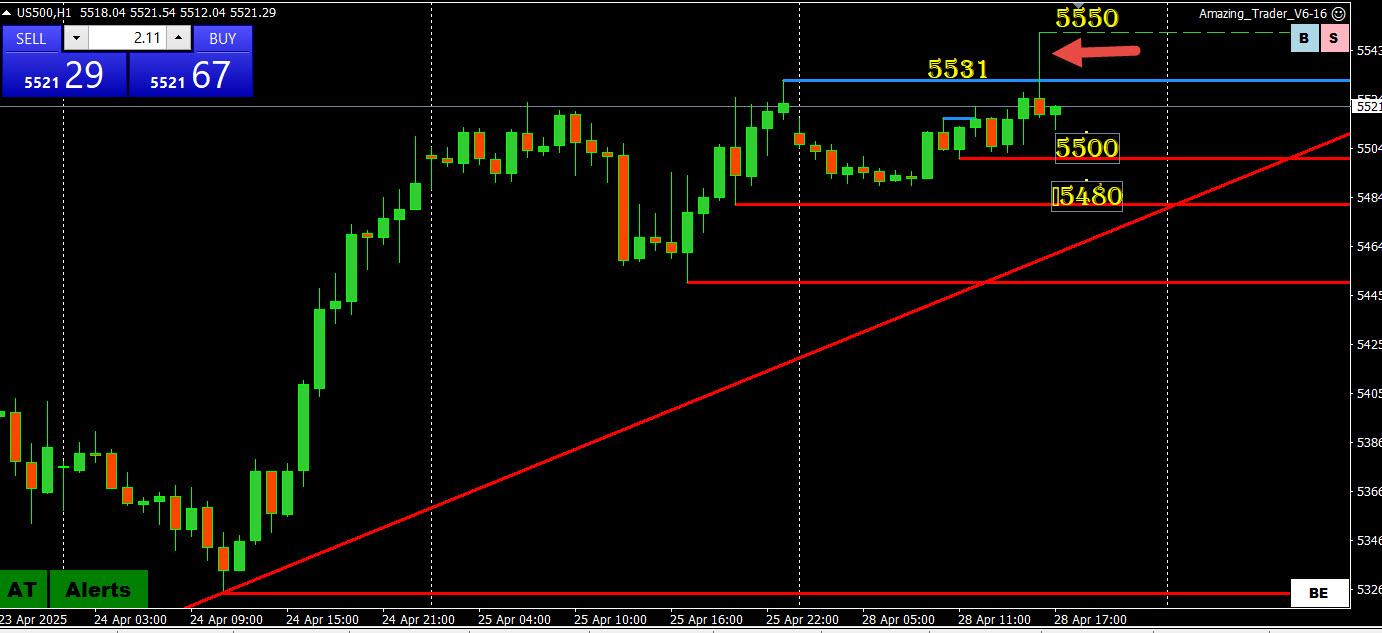
Keep it simple:
5500 needs to hold to keep a bid
Stops run above 5531… guess where it paused… 5550 (Power of 50 level).. works in SP500 as well
So we have 5500-50 as the range, too tight to last for long
April 25, 2025 at 2:31 pm #23230In reply to: Forex Forum
April 25, 2025 at 10:32 am #23193In reply to: Forex Forum
Using my platform as a HEATMAP shows ,,,
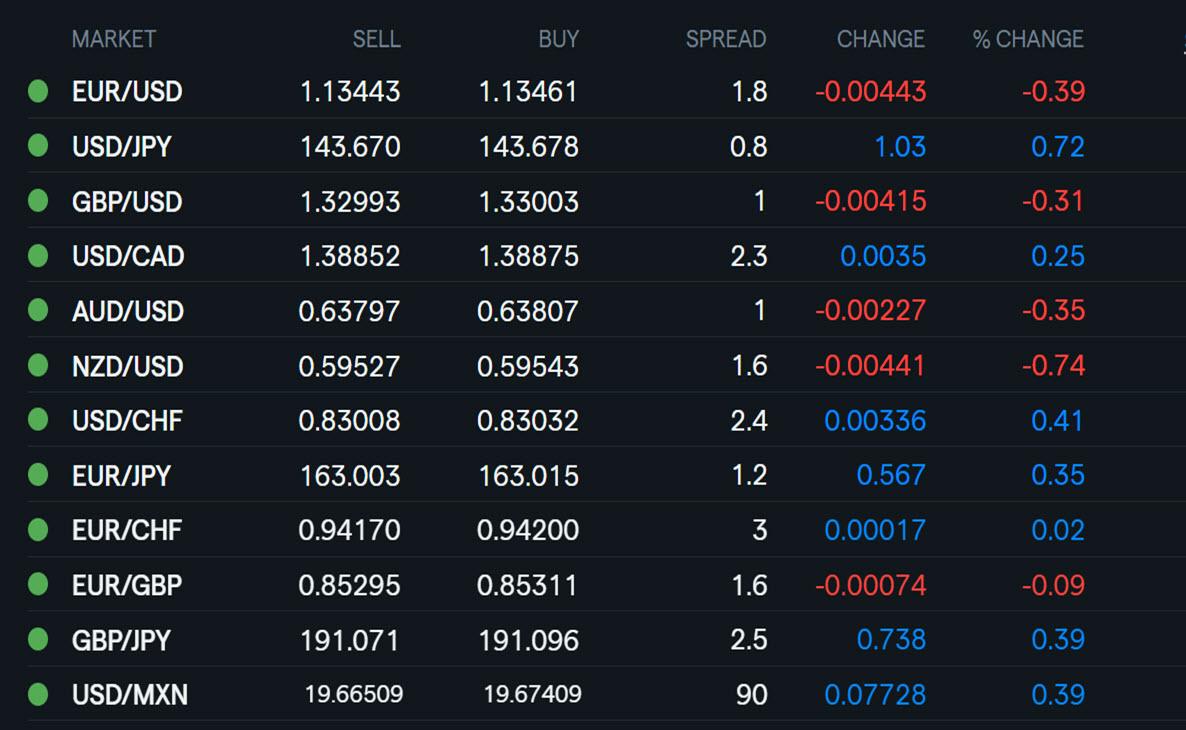
,,, the dollar trading firmer (but still with vs ranges) on glimmer of hope that trade war tensions with China may be thawingNews headline: China exempts some goods from US tariffs to limit trade war pain
GOLD trading lower after an early rally stalled
US stock extended rally buy so far not falling through SP500 unable to get through 5520 (level cited here yesterday)
Otherwise, light economic calendar, keep watching the headlines, TGIF
April 24, 2025 at 10:16 pm #23179In reply to: Forex Forum
April 24, 2025 at 1:03 pm #23149In reply to: Forex Forum
April 23, 2025 at 8:00 pm #23104In reply to: Forex Forum
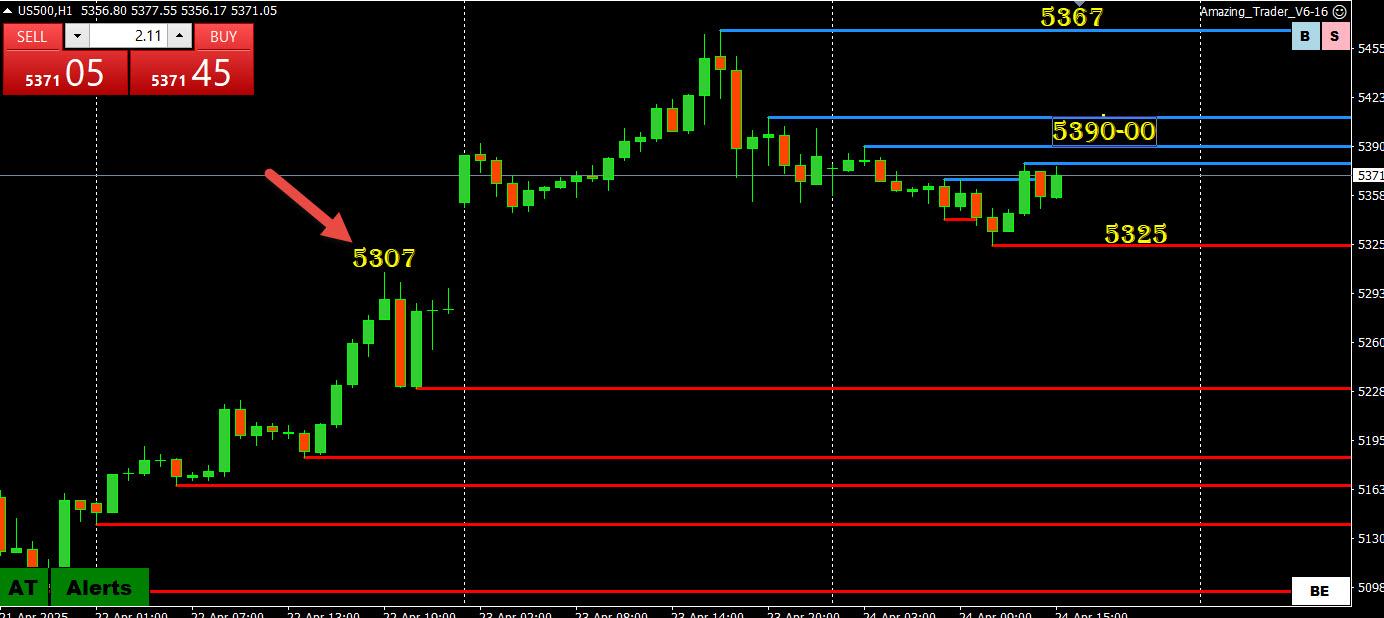
SP500 4 HOUR CHART – 5500 blocks the way
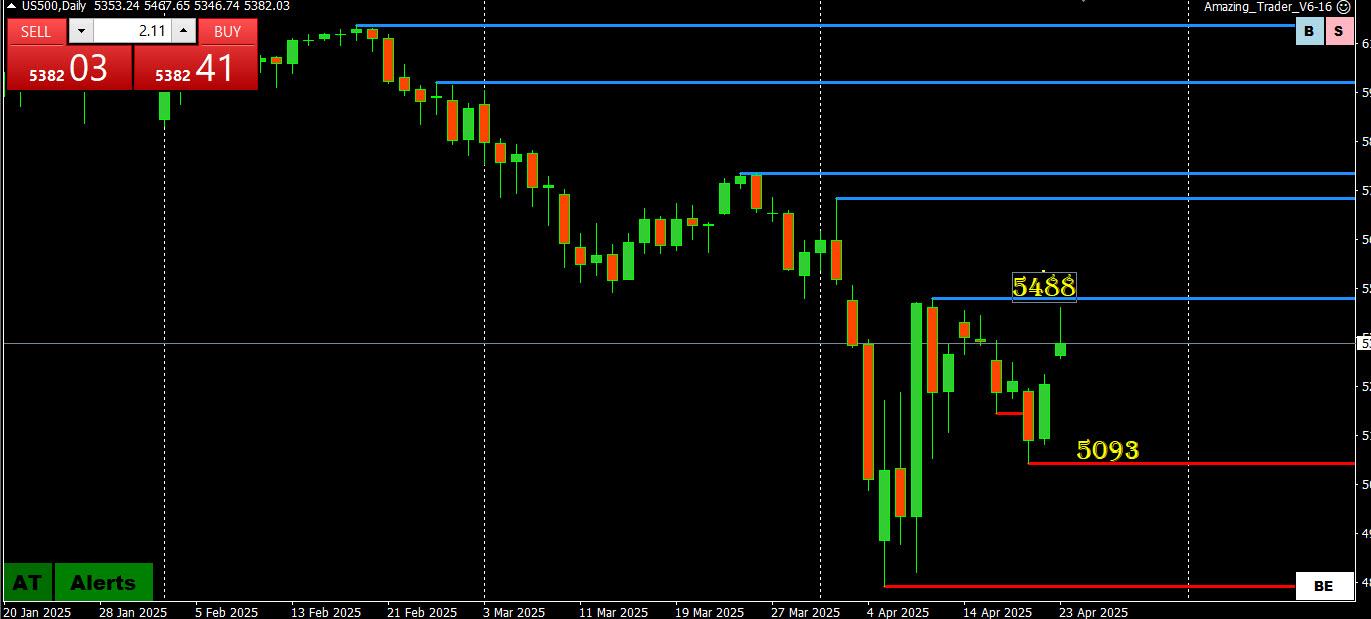
As pointed out at this time yesterday, one way io look at US500 is to assume the range is 5100-5500 which makes the 5300 midpoint the pivotal level that sets the tone.So far a double top around 5488 has blocked 5500.
Looking for a clkue? Watch how price reacts to headline news.
April 10, 2025 at 7:58 am #22404In reply to: Forex Forum
February 28, 2025 at 11:48 am #20232In reply to: Forex Forum
A look at the day ahead in U.S. and global markets from Mike Dolan
The S&P500 stock benchmark plunged into the red for the year this week as an Nvidia-led selloff, economic slowdown fears and re-ignited trade war fears jarred while the dollar surged anew.
Following Big Tech megacaps and small cap indexes into negative territory for 2025, the S&P500 plunged 1.5% on Thursday as U.S. jobless claims saw their biggest weekly jump in five months and President Donald Trump warned more tariff rises are coming as soon as next week.
Morning Bid: S&P500 in red for 2025 as trade war fears ratchet
February 25, 2025 at 11:49 am #20056In reply to: Forex Forum
A look at the day ahead in U.S. and global markets from Mike Dolan
Rancorous geopolitics continues to grab most headlines again this week, but it’s creeping anxiety about a slowing U.S. economy that’s unnerving investors most about Wall Street stocks.
Wary of Wednesday’s results from megacap chip giant Nvidia (NASDAQ:NVDA), the S&P500 lost its 6,000 handle for the first time in three weeks on Monday and both the tech-heavy Nasdaq and small cap Russell 2000 are now negative for the year to date.
Morning Bid: S&P500 loses 6,000 handle amid U.S. slowdown fearsFebruary 7, 2025 at 12:46 pm #19177In reply to: Forex Forum
Riiiiiight …
Today’s Jobs Report Will Be Confusing. Here’s What to Know. – By Justin Lahart , Reporter via WSJ
December 9, 2024 at 9:18 pm #15964In reply to: Forex Forum
December 5, 2024 at 9:31 pm #15769In reply to: Forex Forum
December 3, 2024 at 5:21 pm #15541In reply to: Forex Forum
November 3, 2024 at 10:33 pm #13867In reply to: Forex Forum
September 11, 2024 at 9:02 pm #11546In reply to: Forex Forum
September 9, 2024 at 1:54 pm #11459In reply to: Forex Forum
September 6, 2024 at 1:47 pm #11385In reply to: Forex Forum
September 5, 2024 at 11:37 pm #11358In reply to: Forex Forum
September 5, 2024 at 2:59 pm #11338In reply to: Forex Forum
-
AuthorSearch Results



Search
© 2024 Global View