
- This topic has 27,907 replies, 54 voices, and was last updated 17 hours, 49 minutes ago by Mtl JP.
-
AuthorPosts
-
July 10, 2025 at 12:09 am #27319
Timely article with EURUSD trying to regain a bid
In our blog
Will the ECB Change Its Tune on the Euro’s Rise?
 July 9, 2025 at 10:21 pm #27318July 9, 2025 at 10:11 pm #27317July 9, 2025 at 9:35 pm #27316
USDJPY
After extending its high to 147.19 correlations took over with a fall in US bond yields seeing USDJPY follow.
Correlations can be fickle so keep an eye on bond yields to see if the relationship is more than a one day wonder.
In any case, the move down is just a retracement as USDJPY would need to break 145.82 and then the trendline to indicate the high is in.
What has changed on the upside, is the deck is cleared of buy stops until above 147.19
USDJPY 4 HOUR CHART
 July 9, 2025 at 8:25 pm #27315
Top U.S. Imports from Brazil (by category)
1. Mineral Fuels and Oil
Crude oil (a major import)
Refined petroleum products
Brazil is a key source of crude for U.S. Gulf Coast refineries.
2. Iron and Steel
Semi-finished iron and steel products
Stainless steel and ferroalloys
Brazil is among the top exporters of semi-finished steel to the U.S.
3. Precious Stones and Metals
GoldDiamonds
Other precious metals
4. Agricultural Products
Coffee (Brazil is the world’s largest producer)
Orange juice (especially frozen concentrated OJ)
Soybeans and soybean meal (less frequent due to U.S. domestic supply)
Sugar and ethanol
5. Wood and Pulp Products
Pulp for paper (especially bleached eucalyptus pulp)
Tropical hardwoods
6. Aircraft and Aircraft Parts
From Embraer, Brazil’s aerospace giant, which supplies regional jets and parts
7. Machinery and Equipment
Industrial and electrical machinery components
(from the web)
July 9, 2025 at 8:23 pm #27314July 9, 2025 at 8:16 pm #27312NAS100 (NASDAQ)
You can see by a new record high today why I said yesterday, no matter what charts say, even suggesting a potential top in the NAS triggers a bout of PTSD.
With that said, with no resistance other than the record high (22935), use that as the key level.
Expect support as long as it trades above 22600-22662. Would re-evaluate if that support is broken.
NAS100 4 HOUR CHART
 July 9, 2025 at 7:55 pm #27307
US500 (SP500)
Why Amazing Trader (AT) levels matter
I noted this earlier and as you can see by the chart, why I keep suggesting signing up for AT
6220 => 6272 (high 6274) => 6235 => 6265
In any case, downside limited while above 6200-=20 BUT still needs a firm break of 6272-74 to chasllenege the 6287 high
US500 4 HOUR CHART
 July 9, 2025 at 7:41 pm #27306
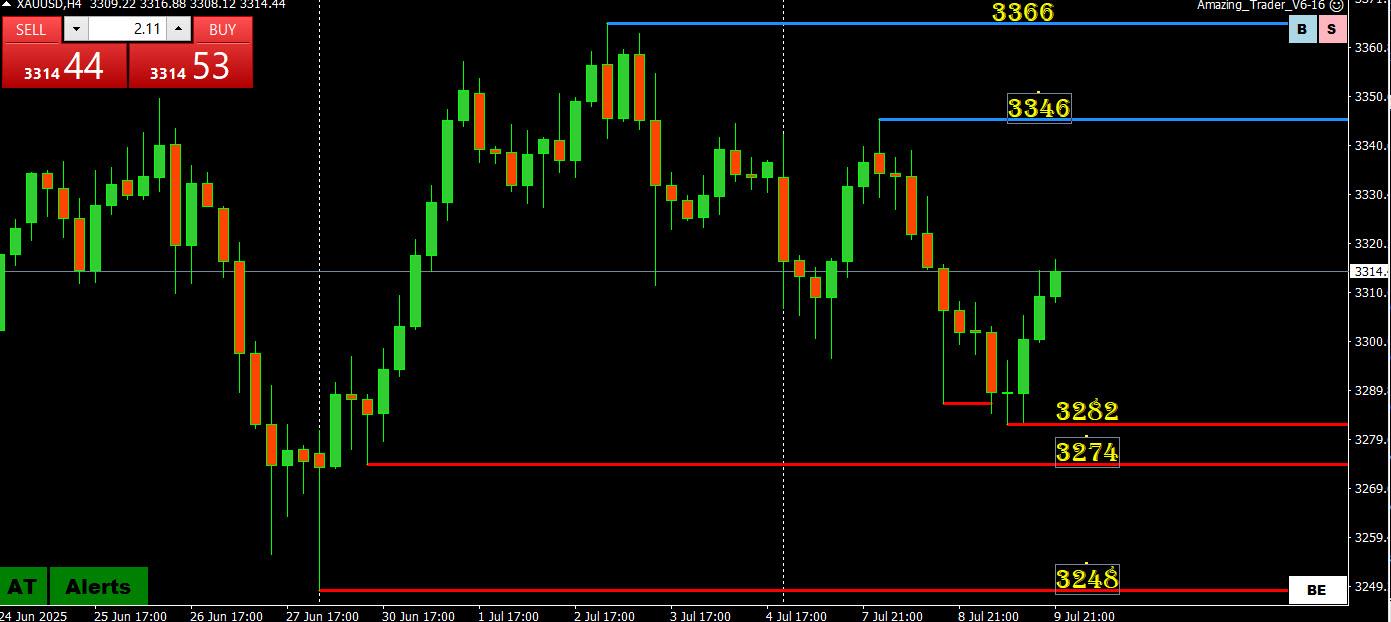
XAUUSD ((gold)
This is a glass half empty, glass half filled situation, depending on your view
Glass half empty: Failure to build on rallies that require a firm move through 3346-66 to build momentum to the upside.
Glass half filled: Repeated attempts to run to test 3274 for a run at 3248 have been repelled.
So, is XAUUSD bid in an offered market or offered in as bid market?
What is clear that unless the 3248 low is taken out, any stops on the downside will be limited.
Trade the range until momentum builds on either side.
XAUUSD 4 HOUR CHART
 July 9, 2025 at 7:29 pm #27305
XRPUSD
XRP in front of major resistance at 2.4135
Break of would open a road to 2.90 and higher
Supports: 2.35, 2.3235 & 2.2565
XRP is becoming bullish and unless cut short at this resistance this would be just a beginning of uptrend
However, if stopped and losses support at 2.00 it might lose more than half of its current value.
 July 9, 2025 at 7:18 pm #27304July 9, 2025 at 7:05 pm #27303July 9, 2025 at 6:58 pm #27302July 9, 2025 at 6:02 pm #27301
Mixed but cautious views, rate cuts this year still expected, no surprise
Minutes of the Federal Open Market Committee, June 17–18, 2025
July 9, 2025 at 5:52 pm #27300July 9, 2025 at 5:41 pm #27299July 9, 2025 at 5:39 pm #27298July 9, 2025 at 4:52 pm #27297July 9, 2025 at 4:51 pm #27296July 9, 2025 at 4:49 pm #27295July 9, 2025 at 3:16 pm #27294July 9, 2025 at 3:07 pm #27293July 9, 2025 at 3:04 pm #27292July 9, 2025 at 2:59 pm #27291What’s Hot and What’s Not?
What’s Hot
US bonds are up (yields are lower)
What’s Hot/Not
US dollar is off its highs but mixed on the day as follow through proving difficult
US stocks were hot earlier but have since cooled off
Gold was cold earlier but has since caught a bid
Crude was down earlier but bouncing off its lows
 July 9, 2025 at 2:44 pm #27289
Why (Amazing Trader) levels matter
US500 FAILED TO BREAK/HOLD ABOVE 6272 (ALWAYS LEAVE A FEW PIPS LEEWAY) AND SEE WHAT FOLLOWED…
US500 (SP500) 15 MINUTE CHART
 July 9, 2025 at 2:21 pm #27288
Why (Amazing Trader) levels matter
Bounce from double bottom just above 1.1700
EURUSD 15 MINUTE CHART
 July 9, 2025 at 2:13 pm #27287
Why (Amazing Trader) levels matter
US500 tested 6272, now a triple top
Generally more times a level is tested the weaker it becomes but market pays notice if it continues to hold.
US500 (SP500) 1 HOUR CHART
 July 9, 2025 at 2:06 pm #27286July 9, 2025 at 1:47 pm #27285July 9, 2025 at 1:18 pm #27284
 -
AuthorPosts





- You must be logged in to reply to this topic.
Search
© 2024 Global View