
- This topic has 27,906 replies, 54 voices, and was last updated 11 hours, 50 minutes ago by GVI Forex 2.
-
AuthorPosts
-
June 28, 2025 at 3:40 pm #26883
SPX: S&P 500 Clocks Record Close as US Stocks Stage Fabolous Comeback. What’s Behind Rally?
Key points:
· S&P 500 index books new all-time high
· Economic reality ≠ stocks at records
· What stocks are doing all the work?
Equity prices are on a tear — that’s for sure. But is that a good benchmark of economic health? After all, GDP contracted in the first quarter.
📈 S&P 500 Hits Record Close
· The S&P 500 index (SPX) notched an all-time closing high Friday, reversing course from its steep April drop and bouncing back more than 24% from that point to get where it is now.
· The broad-based market index closed Friday’s cash session up 0.5% to 6,173.07 points, blowing past its February 19 record high. What led to this stunning reversal? It’s a cocktail of events, sprinkled with investor optimism (more than anything?).
· The all-time closing high arrived after a rollercoaster ride on Friday when the Fed’s preferred inflation gauge came in higher than expected at 2.7%, above the 2.6% consensus calls.
· The index initially dived on this news, then jumped back up. Then dived again when Trump said he’s ending tariff talks with Canada — only to rise back up again and score the record.
Record Highs… in This Economy?
· Broadly, war tremors have toned down lately with the Iran-Israel ceasefire holding up. The tariffs, another sticking point, haven’t been talked about too much, and the Fed’s guidance is pointing to a cut sooner than later (investors are eyeing the September meeting).
· But how’s the economy looking? If stocks are sprinting, is that a measure of economic success? Not really. Rising equity prices may be a milestone of note, but there isn’t any economic growth to justify those lofty company valuations.
· As a matter of fact, the US GDP shrank in the past quarter, down 0.5% year on year. There’s still inflation that’s running above the Fed’s 2% goal. Revenue for those same ceiling-valuation companies isn’t setting records.
· Fair to say, then, that the party is fairly isolated just for the stock bros sipping espresso martinis in the corner and bragging about their wins, mostly concentrated in the tech sector.
Markets, but Without Mag 7
· Zoom in on a few players in the S&P 500 and you’ll see that there are just 7 companies that are largely carrying the index into record-high grounds. The familiar Magnificent Seven club where Nvidia NVDA is seen shattering records and hitting formidable valuations, close to $4 trillion.
What about the S&P 493 then? That’s mostly struggling out of the spotlight. Last year, for example, the Mag 7 rose 57%, while the other 493 stocks in the index only advanced 13%.
But still, a record is a record and credit’s due where credit’s due — traders and investors, always optimistic by nature, overcame great hurdles to get where they are now. Question is, how far can they go from here?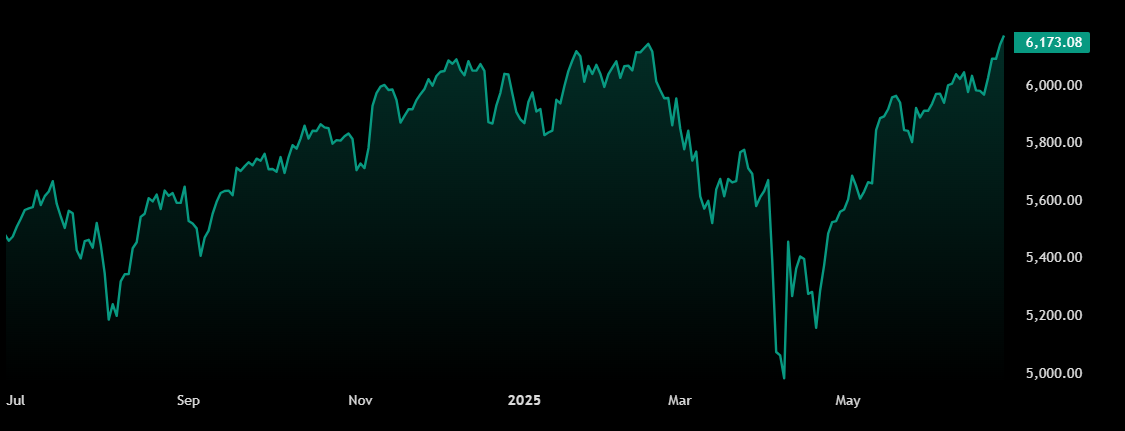 June 28, 2025 at 3:31 pm #26882
The $100K Mirage: Bitcoin’s Rally Not Backed By On-Chain Strength
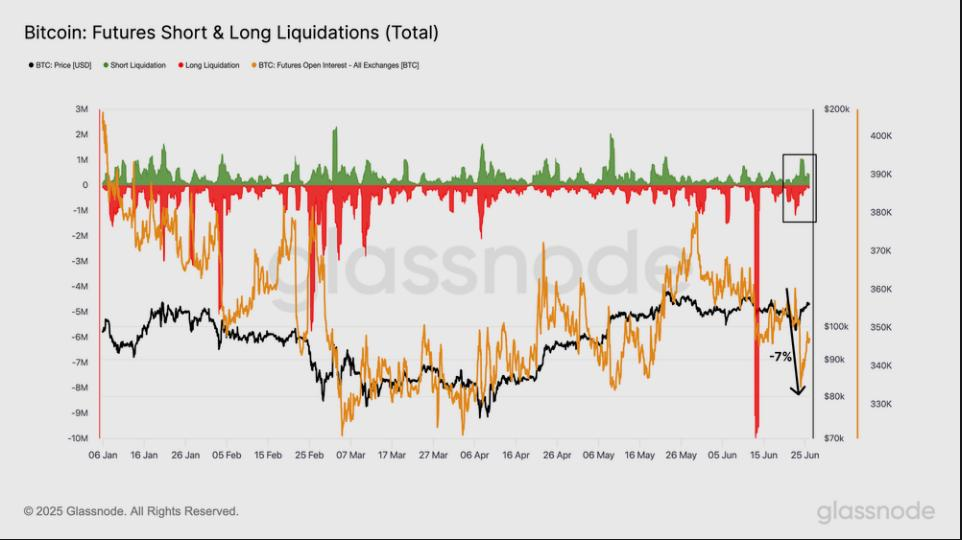
Bitcoin briefly climbed back above $100,000 this month, pushing close to the $108,000 level before a new pullback. The move looks strong on the surface. But based on reports from Glassnode, much of that surge came from traders using borrowed funds, not fresh buyers piling in.
Speculative Bets Fuel Recent Rally
According to on-chain data, late-June’s volume on Bitcoin futures stayed high as prices marched upward. Traders betting on short-term gains drove the market, even as the excitement behind the rally faded. Funding rates and the three-month futures basis both moved lower, signalling less bullish conviction. In other words, fewer people were making big, long bets on Bitcoin these days.
Spot Market Remains Quiet
Spot trading did not follow the futures boom. At its $111,910 peak in May, daily spot volume hovered around $7.65 billion. That’s well below the previous cycle highs, which topped $20 billion on some days. Based on reports, new cash from retail or long-term holders stayed on the sidelines instead of flooding in. Institutional Buyers Still Adding
Big firms did keep buying. This week saw Michael Saylor’s Strategy, Metaplanet and ProCap BTC together pick up about $1 billion worth of Bitcoin. At the same time, US-listed Bitcoin ETFs bought over $1.5 billion in fresh supply. Those steady purchases hint at genuine interest from institutions, even if short-term traders set the pace recently.
Supply Tightness Could Drive Prices
Glassnode now shows just 7 million BTC left freely available on exchanges. Roughly 14 million BTC are held by people who haven’t moved their coins in ages. That supply squeeze could support prices if demand holds up. But it also means any sudden sell-off might hit hard when exchange wallets run low. What Comes Next For Bitcoin
All in all, the recent jump above $100,000 feels more like a sprint by margin players than a marathon fueled by new believers. Corrections often follow rallies driven by heavy margin activity. Yet, the ongoing buying by big companies and ETFs offers a buffer. If they keep at it, Bitcoin may need a breather now but could rally again later.
As of June 28, Bitcoin traded at $106,500, down 0.85% on the day. Market watchers will be looking for a return of fresh spot demand or a stabilizing of futures bets before declaring the uptrend back on solid ground.
 June 28, 2025 at 3:24 pm #26881
BTCUSD – Bitcoin
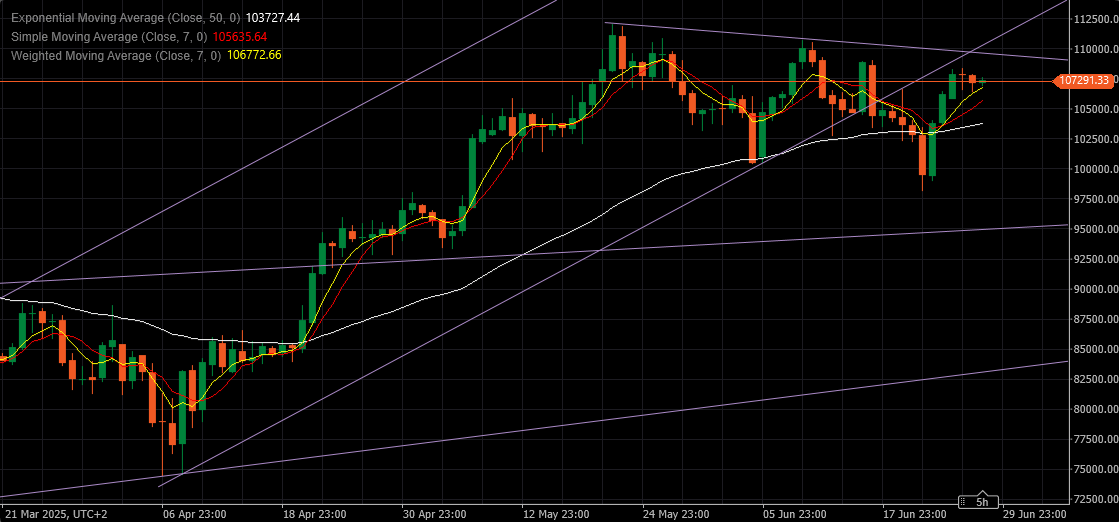
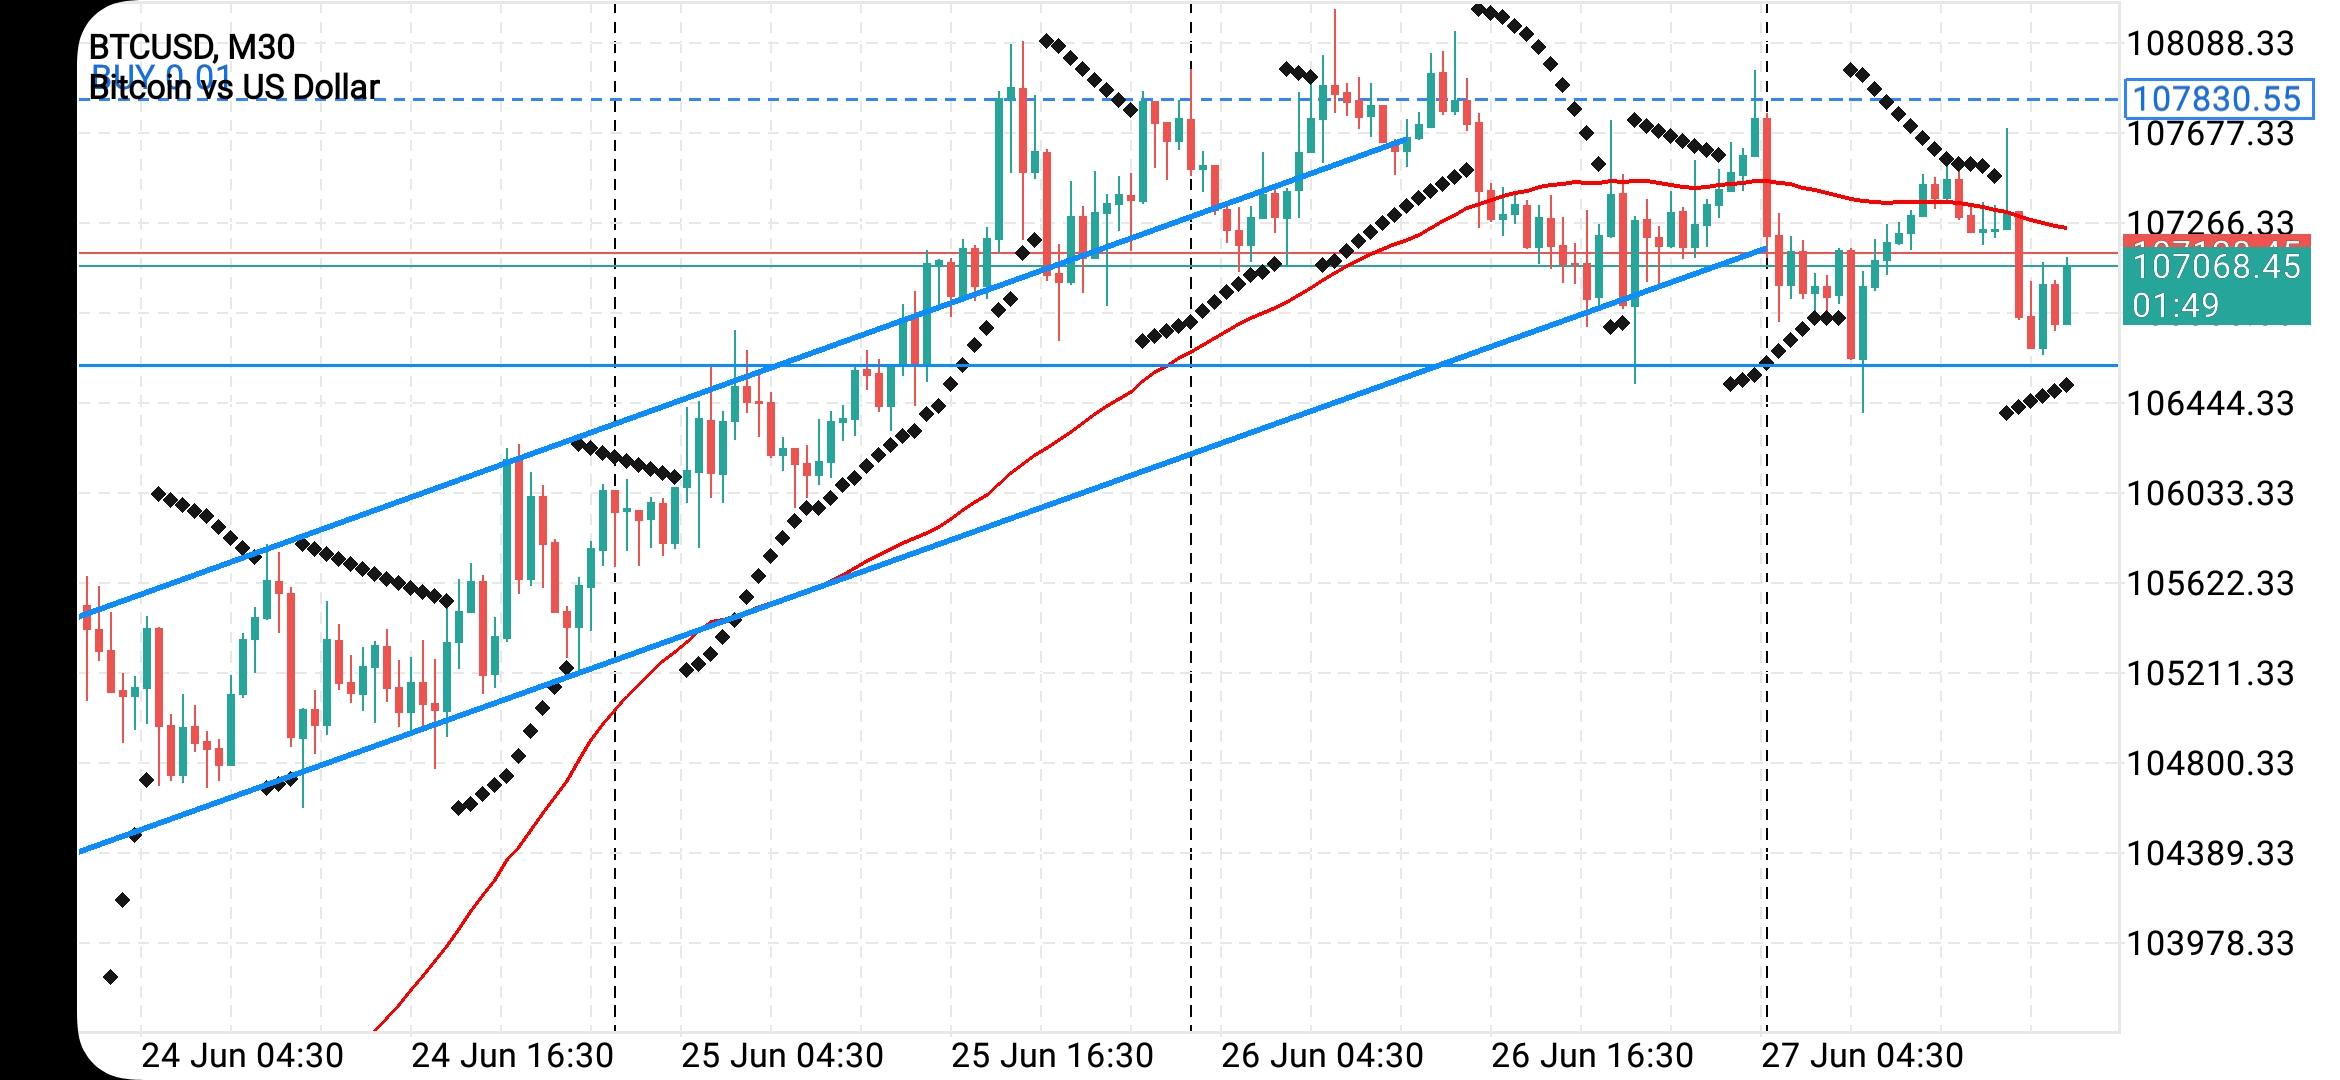
Right now BTC is trying to attack resistance at 109.600
For that to happen two things have to be in line:
Support at 106.875 has to hold
BTC has to reach above 107.400
Intraday pressure is still Down – it is “wait and see” situation
If 106.875 lost 106.145 is next Support to be visited – that would negate or at least delay another attempt Up
 June 28, 2025 at 12:05 pm #26880June 28, 2025 at 10:48 am #26877
Posted in our blog
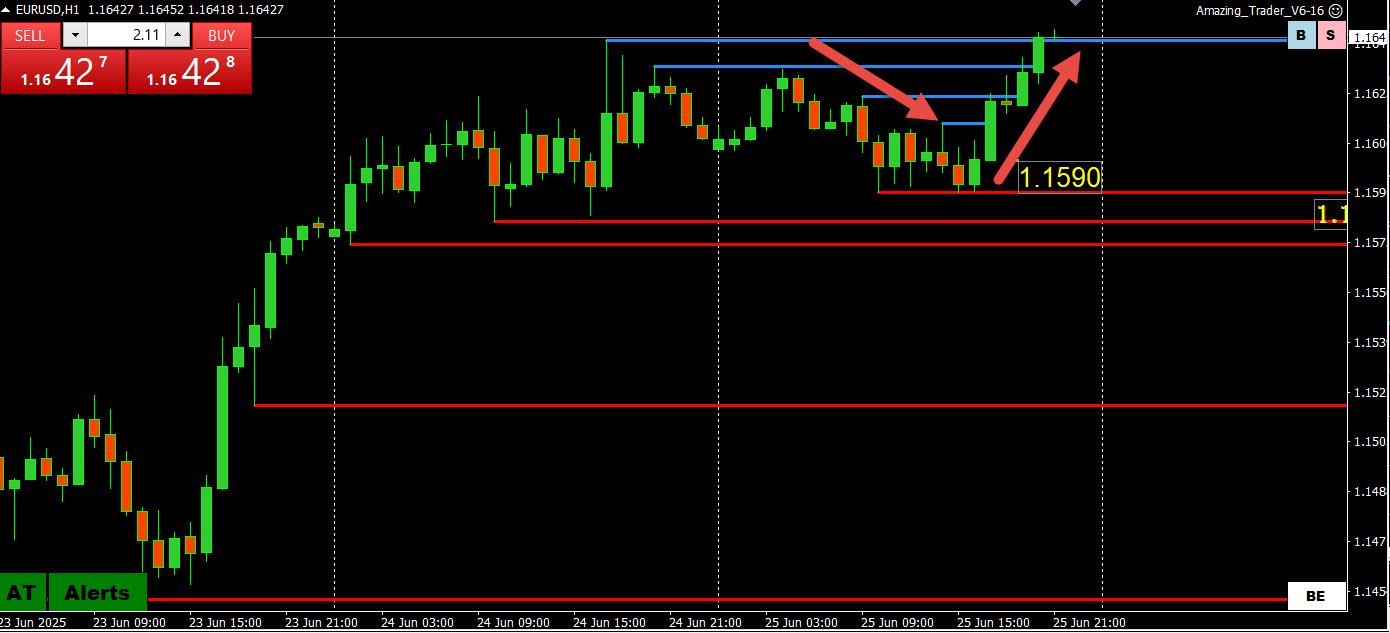
How to Use Drill Down Analysis in Forex: A Multi-Timeframe Look at EURUSD
Successful forex trading requires more than just focusing on a single chart. Whether you trade on a 15-minute or 4-hour chart, you must understand the context provided by longer-term time frames. This approach is called drill down analysis, and it’s a favorite strategy of institutional and “real money” traders.
In this article, we’ll show you how to perform drill down analysis, apply it to EURUSD, and identify key levels and trends across timeframes to improve your trading decisions.
How to Use Drill Down Analysis in Forex: A Multi-Timeframe Look at EURUSD
 June 27, 2025 at 11:43 pm #26876June 27, 2025 at 11:37 pm #26875
The Magnanimity of King Trump
–
Politics Trump shrugs off July tariff deadline: ‘We can do whatever we want’– President Donald Trump said he may not stick to an upcoming deadline when major U.S. tariffs are set to snap back into effect on a slew of countries.
– “No,” Trump said at the White House when asked if that early July deadline is set in stone. “We can do whatever we want.”June 27, 2025 at 9:44 pm #26873June 27, 2025 at 8:09 pm #26872Canada’s Digital Services Tax (DST) is a 3% levy on revenue earned from digital services provided to Canadian users by large multinational and domestic companies.
Legislative timing: Passed as Bill C‑59 on June 20, 2024; went into force on June 28, 2024, with revenue backdated to January 1, 2022
First tax payments: Due by June 30, 2025, covering income from 2022–2024
June 27, 2025 at 8:06 pm #26871June 27, 2025 at 6:03 pm #26870June 27, 2025 at 5:54 pm #26869June 27, 2025 at 4:26 pm #26867June 27, 2025 at 4:23 pm #26865June 27, 2025 at 4:17 pm #26864June 27, 2025 at 4:13 pm #26863June 27, 2025 at 3:47 pm #26862June 27, 2025 at 3:41 pm #26861Ethereum chart signals ‘altseason’ as analysts predict $10K ETH price top
Key takeaways:
· Ether’s technical breakouts suggest ETH price may hit $10,000 this cycle.
· Altcoin Season Index says it’s prime time to accumulate “lagging” altcoins.
· Bitcoin dominance nearing 70% could trigger a full-blown altseason soon.
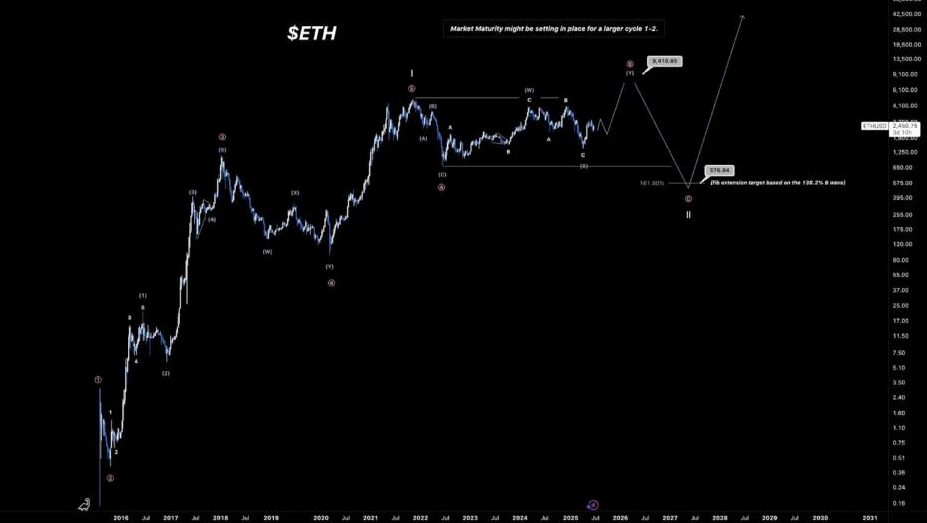
Ether’s ETHUSD technical setup suggests that the altcoin is poised for sharp price gains that could mark the start of an “altseason” over the next few weeks or months.
ETH price could top $10,000 this cycle – Analysts
Technical analysis using the Wyckoff method points to a potential Ethereum price breakout to the $3,200 mark
Several analysts have made similar projections, targeting $10,000 and above per ETH, citing historical fractals, increased institutional demand via Ethereum ETFs, and other factors. An accompanying chart showed an Elliott Wave analysis projecting a possible breakout to $9,400.
“ETH is still looking to shoot for new ATHs this cycle and should end around $9,000-$10,000, give or take.
Prepare for altseason:
The Altcoin Season Index, a metric used to measure the performance of non-Bitcoin cryptocurrencies (ie, altcoins) in the cryptocurrency market, suggests now is the time to get into altcoins.
Bitcoin has outperformed altcoins over the last 60 days, with the altcoin season index in the green zone below 20%.
Bitcoin dominance—a metric measuring Bitcoin’s market share relative to the overall crypto market—is one of the indicators commonly used to indicate whether the altseason has begun. It can provide traders with the overall investor sentiment and risk appetite in the market.
At the time of publication, BTC dominance is at 65.77% maintaining the uptrend, indicating that it is still “Bitcoin season.”
 June 27, 2025 at 3:36 pm #26860June 27, 2025 at 3:35 pm #26859June 27, 2025 at 3:33 pm #26858
Nike Up Over 15%, Best Performer in the DJIA and S&P 500 SO Far Today
NIKE, Inc. Class B (NKE) is currently at $72.07, up $9.53 or 15.23%
· Would be highest close since March 19, 2025, when it closed at $72.99
· On pace for largest percent increase since June 25, 2021, when it rose 15.53%
· Currently up five of the past six days
· Currently up two consecutive days; up 18.47% over this period
· Best two-day stretch since the two days ending March 25, 2020, when it rose 25.81%
· Up 18.94% month-to-date; on pace for best month since Dec. 2000, when it rose 30.94%
· Down 4.76% year-to-date
· Down 59.4% from its all-time closing high of $177.51 on Nov. 5, 2021
· Down 4.38% from 52 weeks ago (June 28, 2024), when it closed at $75.37
· Down 19.42% from its 52-week closing high of $89.44 on Sept. 27, 2024
· Up 35.29% from its 52-week closing low of $53.27 on April 8, 2025
· Traded as high as $72.84; highest intraday level since March 20, 2025, when it hit $73.65
· Up 16.47% at today’s intraday high; largest intraday percent increase since Dec. 17, 1999, when it rose as much as 21.47%
· Best performer in the DJIA today
· Best performer in the S&P 500 today
· Second most active stock in the S&P 500 today
· Contributed 58.58 points to the DJIA so far today
 June 27, 2025 at 3:29 pm #26857
Nasdaq, S&P 500 Notch New Record Highs
The S&P 500 and Nasdaq Composite both notched new record highs shortly after Friday’s open, capping a dizzying rally from the depths of April’s tariff-induced selloff.
· The broad S&P 500 topped 6158, besting a previous intraday record hit in February.
· The index is on pace for its quickest recovery back to all-time highs following a decline of at least 15%.
· The tech-heavy Nasdaq Composite topped 20240, besting a previous all-time high set in December.
· The best S&P 500 performers since the April 8 closing low include Micron, AMD, Palantir and Coinbase. The cryptocurrency exchange has risen 140% since then.
· Both the S&P and the Nasdaq are on track to close at record highs if they hold gains.
· Stocks got a boost in recent sessions after Israel and Iran struck a fragile cease-fire. Continued trade negotiations between the U.S. and China, Canada and the European Union have also lifted investor spirits.
SP 500 Chart
 June 27, 2025 at 2:54 pm #26856June 27, 2025 at 2:51 pm #26855June 27, 2025 at 2:44 pm #26854June 27, 2025 at 2:43 pm #26853June 27, 2025 at 2:06 pm #26852
US stocks pop higher on revisions to final U of M consumer sentiment report… headline up slightly, inflation expectations down slightly
 June 27, 2025 at 1:50 pm #26849June 27, 2025 at 1:36 pm #26848June 27, 2025 at 1:32 pm #26847
 -
AuthorPosts






- You must be logged in to reply to this topic.
Search
© 2024 Global View