
- This topic has 28,115 replies, 54 voices, and was last updated 8 hours, 20 minutes ago by Belgrade Bobby.
-
AuthorPosts
-
July 22, 2025 at 10:39 pm #27865July 22, 2025 at 10:29 pm #27864July 22, 2025 at 10:13 pm #27863July 22, 2025 at 9:02 pm #27862
S&P 500 (SP500) – Weekly
To be able to get a picture where it can be heading, I had to move to bigger picture.
S&P is posting all time highs on a regular basis lately, but what is really in front of it.
There is a resistance at 6355.00 – previous Channel Support trendline and now it acts as a resistance.
But what if S&P takes over and go above??
It would be back in old Uptrend Channel dating from 2023. With targets in 7.000 – 7.500 area.
It is in such a Bullish pattern right now and I wouldn’t be surprised to see it up there in time…
 July 22, 2025 at 8:49 pm #27861
SDPR S&P 500 ETF Trust – SPY
Spy is not losing tempo even a bit.
Target is in 645.00 area, and even we are already in uncharted territory , if somehow it breaks above that level we would be in something like Deep Space nine….
Only level that comes to my mind is around 800 in that case…
Support: 625.00, 620.00 & 618.00
Resistances: 630.00 , 631.55 & 633.45
 July 22, 2025 at 8:39 pm #27860
Nvidia – NVDA
After reaching All time high at 174.25 Nvidia dipped towards support at 163.60 –short of it…
Now most important now is for Nvidia to stay above 161.60 – Channel trendline
If it manages to do it so, we would have another channel with upper trendline in 230 area
So let’s see what’s gonna be
Resistances: 170.50, 174.25 & 177.35
 July 22, 2025 at 8:31 pm #27859
Advanced Micro Devices Inc. – AMD
After failing to stay above the channel trendline at 160.25 AMD briefly tested support at 148.05 ( stayed short of it – low 149.34 ) and rebounded strongly.
Now this pattern calls for a strong move Up tomorrow – even taking out previous high at 161.95.
But if it fails to deliver, it would start a correction towards 139.90
Resistances: 156.25, 161.30 & 161.95
 July 22, 2025 at 8:24 pm #27858July 22, 2025 at 8:18 pm #27857July 22, 2025 at 3:39 pm #27856July 22, 2025 at 3:30 pm #27855July 22, 2025 at 3:26 pm #27854July 22, 2025 at 2:10 pm #27853
Courtesy Ken Fisher at New York Post
All about ‘yield curves’ – and the big move for stocks they’re pointing to in 2025
So what’s a yield curve, again? It’s a graph showing government bond yields from 3-month to 10-year, left to right. When long-term rates top short rates, the curve slopes upward — and is deemed “steep” and historically bullish. When short-term rates top long, it is “inverted”— an historically fairly reliable though imperfect recession warning.
there is more insight.
excellent refresher reading
fwiwJuly 22, 2025 at 2:04 pm #27852July 22, 2025 at 1:45 pm #27851July 22, 2025 at 1:35 pm #27850July 22, 2025 at 1:22 pm #27848DXY 97.86 at 9:08 AM EDT
puppy, while under 98, has its mojo curtailed and I am inclined towards further downside
economists and equities types are squealing about “uncertainty” related to Trump’s tariffs and, to some smaller extent, his slugfest with jerome.I am leary of headlines trumpeting (some) stocks pushing uP.
EURO 1.1685
puppy is trying to keep up bull bias, fully pricing thursdays ECB staying pat. One stupid comment from some suit = risk
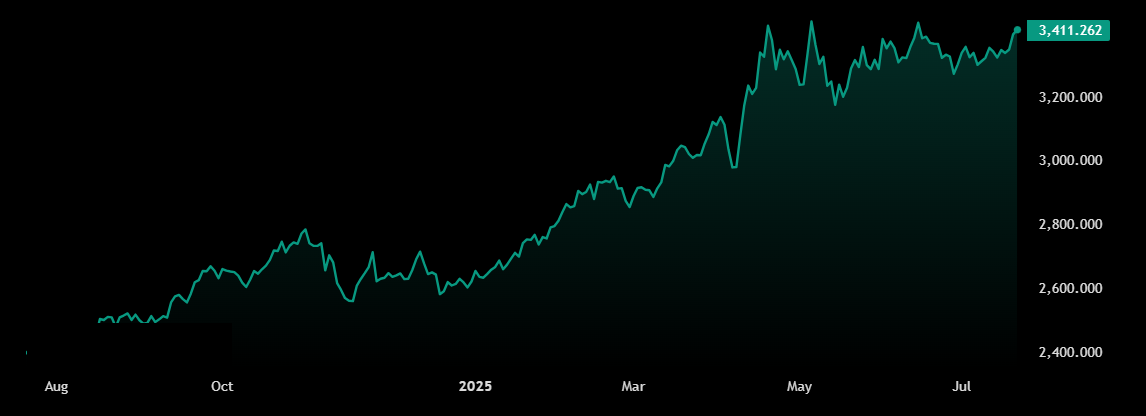
S 1.1650; Res 1.1750July 22, 2025 at 1:19 pm #27847XAU/USD: Gold Prices Ricochet Off $3,400 as Traders Eye String of Key Updates
Key points:
· Gold prices dive under $3,400
· Markets eye central bank moves
· Trade negotiations in crunch time
Bullion jumped to a one-month high of $3,402 before coming down by about 20 bucks. What’s next could be a catalyst for a new leg higher (or lower).
Gold prices XAUUSD jumped to $3,402 on Tuesday — its highest in over a month — before paring gains to trade around $3,380 per ounce. Still, the move was enough to bring back bullish appetite as gold bugs juggle a weaker dollar, lower yields, and rising global tensions.
Traders are eyeing the August 1 tariff deadline, with President Trump threatening a 30% blanket duty on European imports if a deal isn’t reached. Bloc officials are already prepping a broader set of countermeasures. In other words: gold smells smoke.
As risk ramps and safe-haven bids return, bullion’s bounce may not be a one-off — especially with macro fireworks queued up through next week.
Powell, ECB, and the Chessboard
The European Central Bank is expected to hold rates at 2.0% when it wraps up its meeting on Thursday. After a string of cuts, that pause could offer some relief to the euro — or just widen the rate gap if the Fed gets dovish.
Speaking of the Fed, Chair Jay Powell is due to speak Tuesday at a Washington conference. With Trump lobbing verbal grenades about firing him, the buzz around a shock resignation — while unlikely — has traders watching closely.
Even without drama, Powell’s tone could move markets. If he leans dovish ahead of next week’s FOMC meeting, expect another surge in gold and a softening in the dollar.
What’s Next for Bullion?
Gold bulls are cautiously optimistic: the recent breakout puts $3,400 back in play, and a close above that level could open the door to new highs — especially if trade tensions worsen or Powell blinks.
But there’s still plenty of two-way risk. A hawkish Powell, progress on tariffs, or a bounce in the greenback could easily knock gold back into consolidation mode.
Presently, though, momentum’s on bullion’s side — but the real catalyst may be just one headline away. Stay nimble. Gold sure is.
 July 22, 2025 at 1:12 pm #27846
Ripple Price Analysis: Will XRP Dip Before Rocketing Past $4?
Ripple has maintained strong bullish momentum, breaking above its previous peak and printing a new all-time high at $3.66.
However, a short-term corrective retracement is anticipated before the price potentially resumes its upward trajectory toward the $4 mark.
XRP has recently demonstrated strong bullish momentum, breaking decisively above its January 2018 peak at $3.4 and setting a new record of just over $3.65. This breakout signals a major shift in market sentiment, with price action accelerating through key resistance levels. The surge appears to be driven by institutional accumulation, highlighting a bullish bias in the market.
However, following such an impulsive rally, the market typically enters a temporary corrective phase. The $3 level stands out as a significant support zone and potential target for the current retracement. Holding above this level will be essential for maintaining the bullish structure and paving the way toward the $4 psychological threshold.
The 4-Hour Chart
In the lower timeframe, XRP’s breakout to $3.66 was marked by strong bullish momentum, as reflected by a sequence of large bullish candles. The asset gained approximately 30% in a single leg before encountering resistance and minor rejection at the ATH level.
Since then, XRP has entered a consolidation phase, likely forming a corrective pullback structure. The $3 region, coinciding with the 0.5–0.618 Fibonacci retracement zone, is a key area to watch for renewed buying interest.
If bulls defend this level and volume increases, another rally toward the $3.66 ATH, and potentially beyond, is probable. Until confirmation emerges, however, a continued short-term correction remains the base-case scenario.
 July 22, 2025 at 1:07 pm #27845
Exchange-Traded Funds, Equity Futures Lower Pre-Bell Tuesday as More Corporate Earnings Awaited
The broad market exchange-traded fund SPDR S&P 500 ETF Trust SPY was down 0.2% and the actively traded Invesco QQQ Trust QQQ was 0.1% lower in Tuesday’s premarket activity as investors await more earnings reports.
US stock futures were also lower, with S&P 500 Index futures down 0.1%, Dow Jones Industrial Average futures slipping 0.02%, and Nasdaq futures retreating 0.2% before the start of regular trading.
Federal Reserve Chair Jerome Powell is scheduled to speak at 8:30 am ET.
The Richmond Fed manufacturing index for July will be released at 10 am ET.
Fed Vice Chair for Supervision Michelle Bowman’s remarks are due at 1 pm ET.
In premarket activity, bitcoin was up by 1.9%. Among cryptocurrency ETFs, the cryptocurrency fund ProShares Bitcoin Strategy ETF BITO was 2% higher, Ether ETF EETH was down 1.3%, and Bitcoin & Ether Market Cap Weight ETF BETH was flat.
Power Play:
Consumer
The Consumer Staples Select Sector SPDR Fund XLP was up 0.3%, while the Vanguard Consumer Staples Fund VDC was inactive. The iShares US Consumer Staples ETF IYK, the Consumer Discretionary Select Sector SPDR Fund XLY, the VanEck Retail
The iShares US Energy ETF IYE was inactive, while the Energy Select Sector SPDR Fund XLE was down by 0.04%.
Amplify Energy AMPY stock was down more than 1% before Tuesday’s opening bell after the company said it has engaged TenOaks Energy Advisors to explore potential buyers for its assets in East Texas and Oklahoma.
Commodities
Front-month US West Texas Intermediate crude oil was down 0.8% at $66.69 per barrel on the New York Mercantile Exchange. Natural gas fell 2.2% to $3.25 per 1 million British Thermal Units. United States Oil Fund USO was 0.7% lower, while the United States Natural Gas Fund UNG fell 1.8%.
Gold futures for August declined 0.3% to $3,396.40 an ounce on the Comex, while silver futures were down 0.6% at $39.10 an ounce. SPDR Gold Shares retreated by 0.3%, and the iShares Silver Trust was 0.1% lower.
SPY Chart
 July 22, 2025 at 12:59 pm #27844
Trump’s Tariff Turns Leave Europe’s Policymakers in the Dark
It can be hard to tell whether President Trump’s tariff threats are sincere or a bargaining tool, clouding the way ahead for rate setters at the European Central Bank, Pantheon Macroeconomics’ Claus Vistesen writes. The bank’s governing council is expected to hold its benchmark interest rate at 2.00% this week. Some members might be focused on the 30% tariffs Trump has threatened to slap on European imports, and which would hit the eurozone economy hard, Vistesen says. “But the problem for policymakers is that they can’t be sure the U.S. president intends actually to impose, let alone keep, such tariffs for an extended period of time,” he tells investors in a note. That leaves the ECB set to stand pat this week and to look ahead to a September meeting with, perhaps, more clarity on the EU-U.S. trade relationship.
 July 22, 2025 at 12:57 pm #27843
US Dollar Mixed Early Tuesday Ahead of Philadelphia Fed Nonmanufacturing, Redbook, Richmond Fed Data
The US dollar was mixed against its major trading partners early Tuesday — up versus the pound and yen, down versus the euro and Canadian dollar — ahead of the release of the Philadelphia Federal Reserve’s nonmanufacturing report for July at 8:30 am ET.
Weekly Redbook same-store sales data are due to be released at 8:55 am ET, followed by the Richmond Fed’s manufacturing and services measures for July at 10:00 am ET.
Fed Chairman Jerome Powell is due to give opening remarks at conference at 8:30 am ET, followed a speech by Fed Vice Chair for Supervision Michelle Bowman at 1:00 pm ET. Neither are expected to comment on the economy or monetary policy due to the ‘quiet period’ which extends through the July 29-30 Federal Open Market Committee meeting.
A quick summary of foreign exchange activity heading into Tuesday:
EURUSD rose to 1.1702 from 1.1690 at the Monday US close and 1.1655 at the same time Monday morning. There are no Eurozone data on Tuesday’s schedule, but European Central Bank President Christine Lagarde is due to speak at 1:00 pm ET. The next European Central Bank meeting is scheduled for Thursday, when no change in interest rates is expected.
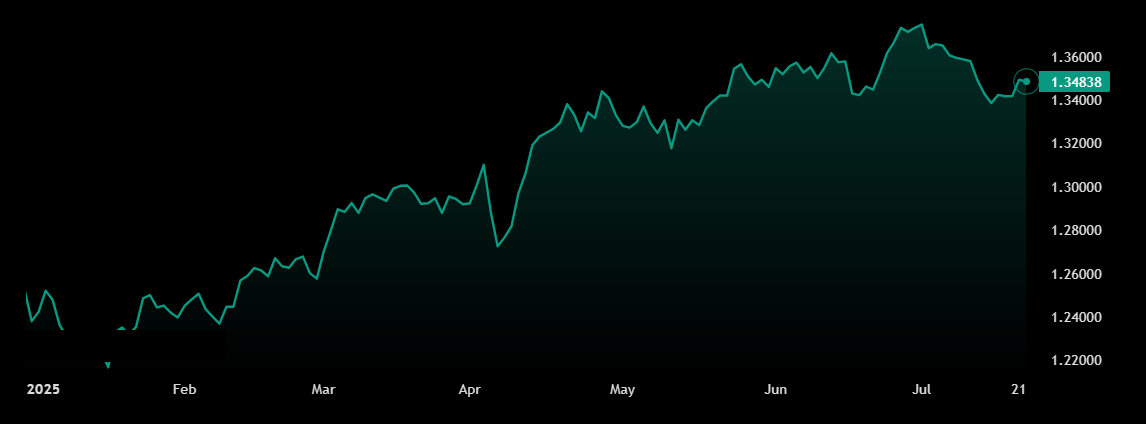
GBPUSD fell to 1.3480 from 1.3485 at the Monday US close but was above a level of 1.3466 at same time Monday morning. UK public sector borrowing increased in June according to data released overnight. The next Bank of England meeting is scheduled for Aug. 7.
USDJPY rose to 147.4785 from 147.3474 at the Monday US close but was below a level of 147.6837 at the same time Monday morning. There were no Japanese data released overnight. The next Bank of Japan meeting is scheduled for July 30-31.
USDCAD fell to 1.3678 from 1.3684 at the Monday US close and 1.3711 at the same time Monday morning. There are no Canadian data on Tuesday’s schedule. The next Bank of Canada meeting is scheduled for July 30.
GBPUSD Chart
 July 22, 2025 at 12:49 pm #27842July 22, 2025 at 12:43 pm #27840July 22, 2025 at 12:38 pm #27839
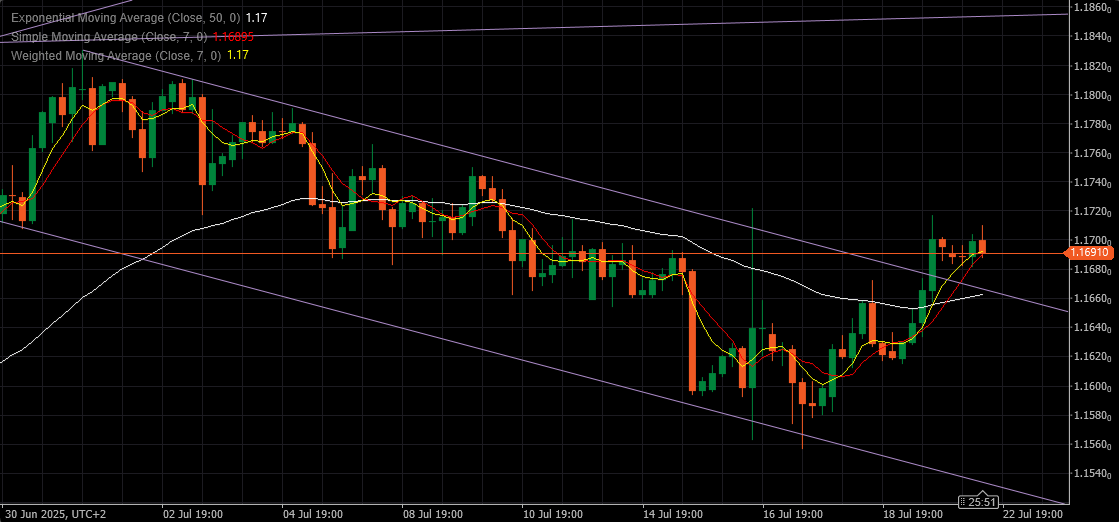
EURUSD 4h
This is looking like a double top right now, but if EUR manages to close this bar above 1.16950 it will have a chance to test higher next 4h
Close below 1.16850 would be bearish intraday, and would open it for a test of Support at : 1.16650
On the bigger picture – Daily – Probability is to the Upside today.
Pressure right now – Down
 July 22, 2025 at 12:32 pm #27838
USDJPY Daily
149 zone seems impenetrable, and Yen is turning south.
Unless Support at 146.150 holds, it is going to test way more important one at 143.250
If that one lost, road would be open for attack at 140 area .
That is the last line of defence and a door for Pivotal 127.00 – separator between Bullish and Bearish
 July 22, 2025 at 12:19 pm #27837July 22, 2025 at 11:38 am #27836
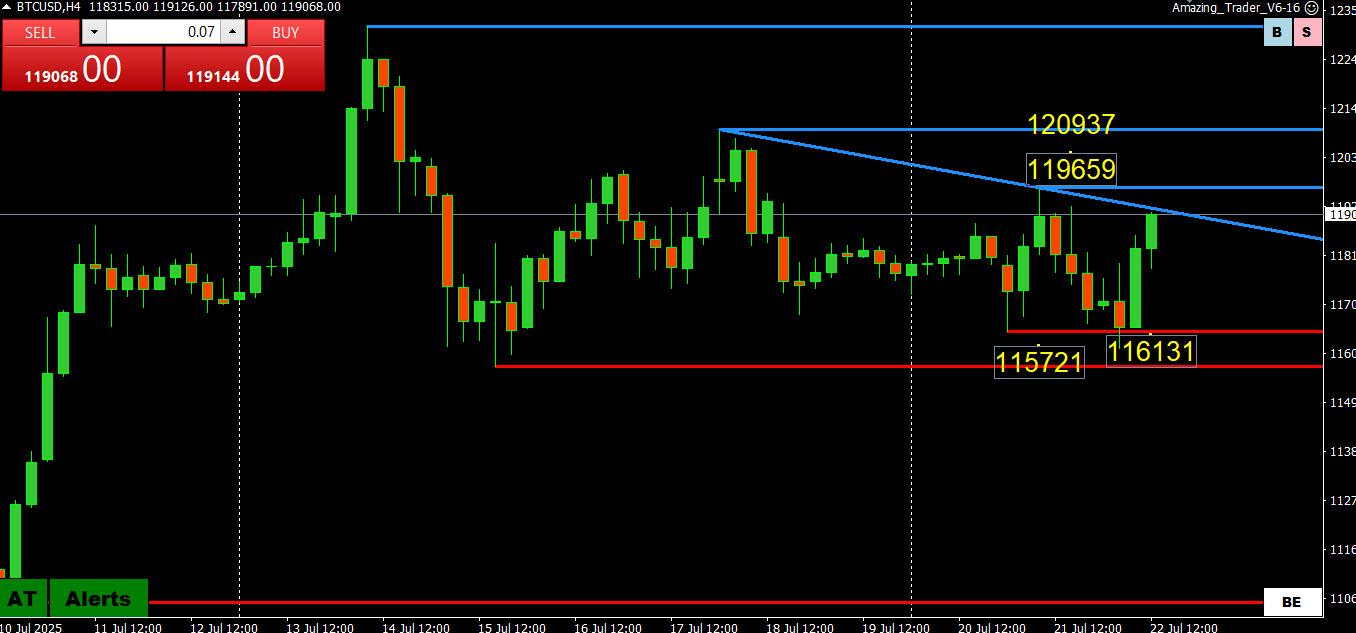
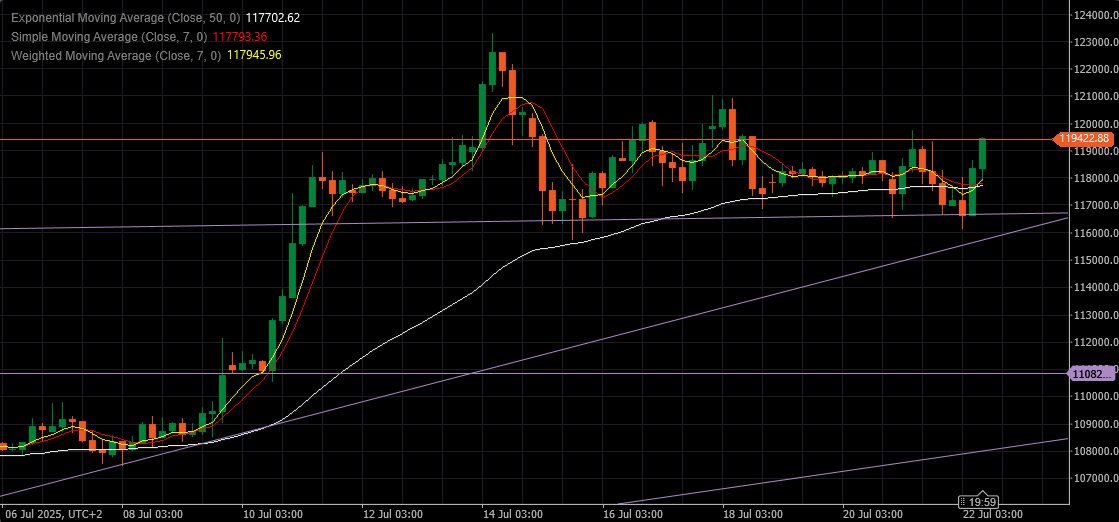
BTCUSD (BITCOIN)
After setting a record high at 123206, BTCUSD has been consolidating
Given its volatility, I prefer to loo at pivotal big figures such as 115K, 120K 125K, etc
In this regard 120K is the key level to watch as it will dictate whether it goes for the record high and beyond by becoming support or takes a breather.
BTCUSD 4 HOUR CHART
 July 22, 2025 at 10:47 am #27835July 22, 2025 at 10:32 am #27834
Out ealier… markets have been ignoring threats of retailation if trade talks break down

-
AuthorPosts



- You must be logged in to reply to this topic.
Search
© 2024 Global View