
- This topic has 28,092 replies, 54 voices, and was last updated 6 hours, 9 minutes ago by GVI Forex 2.
-
AuthorPosts
-
July 29, 2025 at 11:55 am #28091
US data due
Advanced Trade Balance
JOLTS (Job openings)
CB Consumer Confidence
See our Economic Data Calendar
 July 29, 2025 at 11:49 am #28090July 29, 2025 at 11:16 am #28089July 29, 2025 at 9:59 am #28088July 29, 2025 at 9:51 am #28087July 29, 2025 at 9:47 am #28086July 29, 2025 at 9:35 am #28085
Using my platform as a Heatmap shows..
… the dollar is almost back to square one after extending its highs overnight
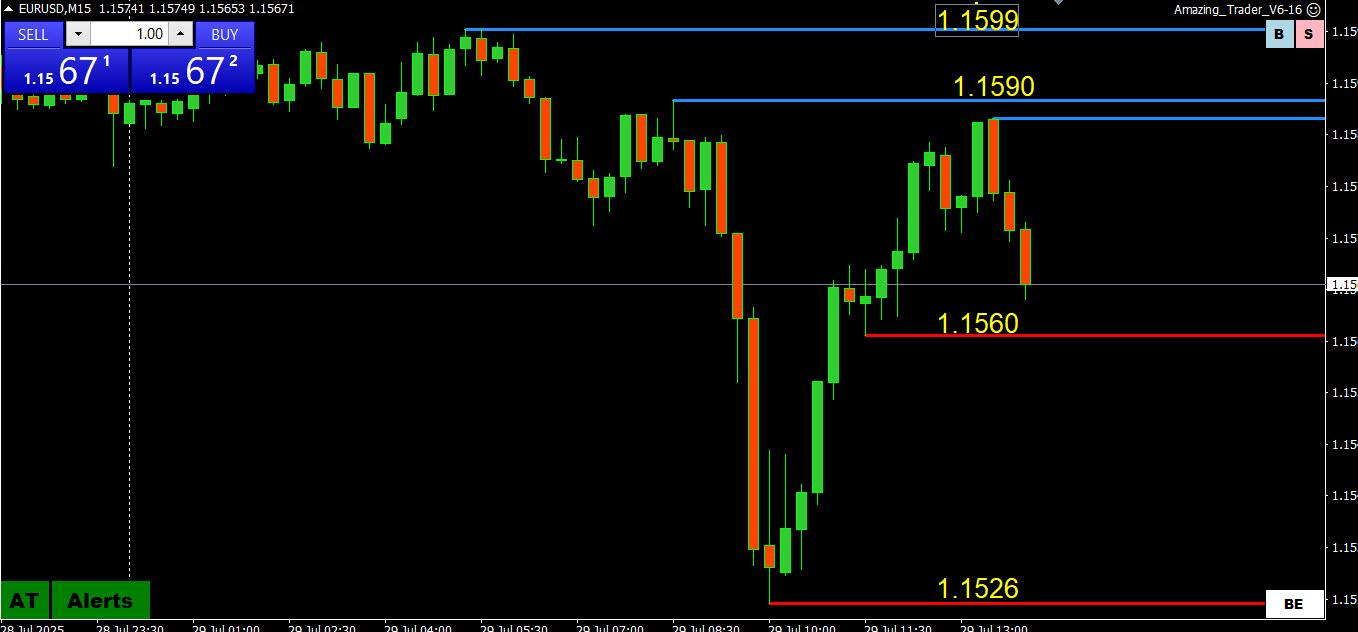
EURUSD extended its low but downside paused above the pivotal 1.15 level (low 1.1525)
USD highs (deck cleared of USD BUY stops until these levels)
EURUSD 1.1526
USDJPY 148.75
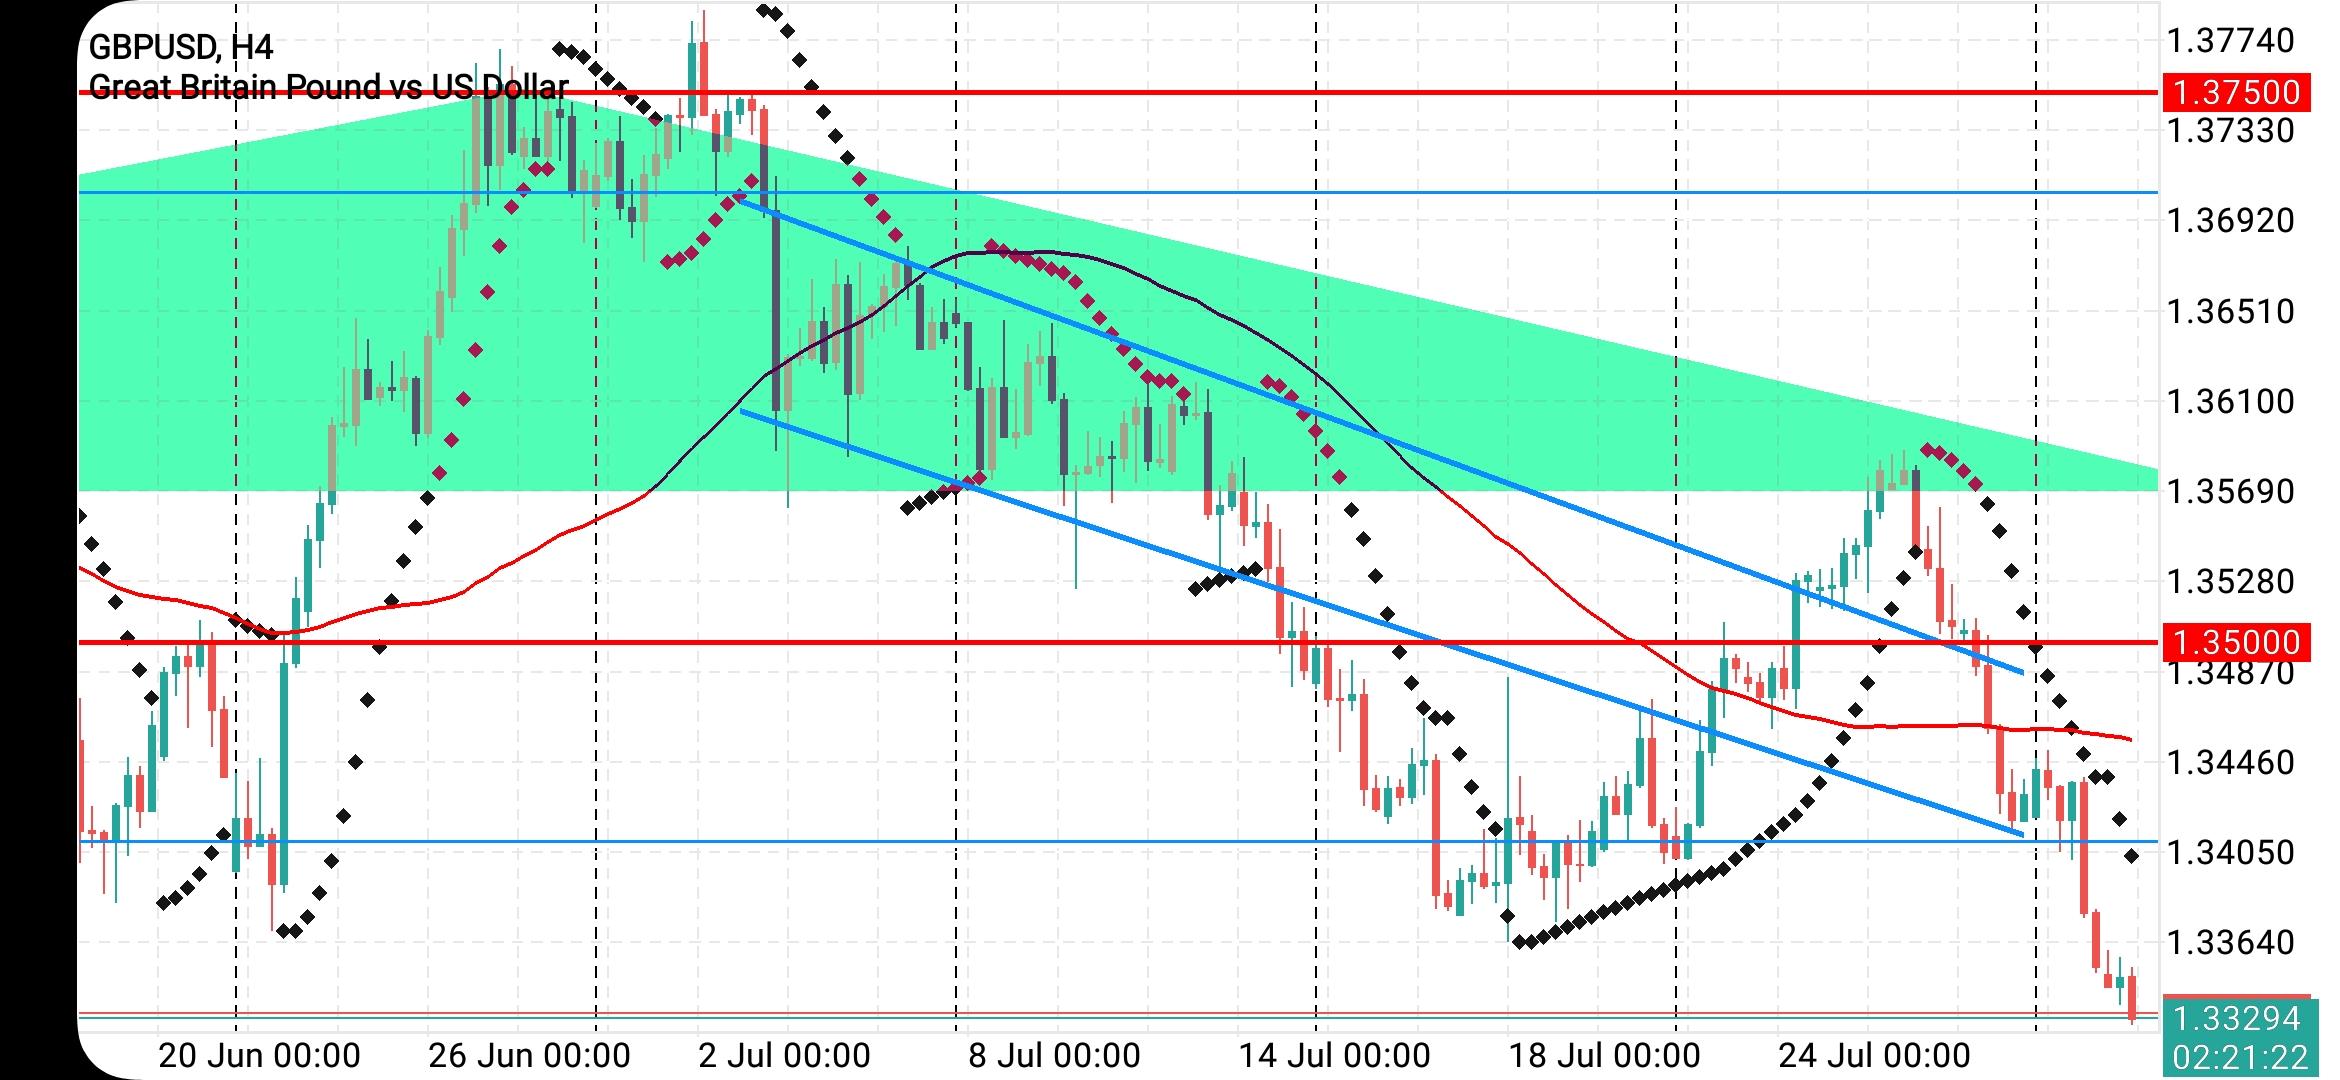
GBPUSD 1.3315
USDCAD 1.3761
AUDUSD .6499Gold is up after trading lower yesterday
US stocks are up (focus on earnngs)
US bonds are steady
UE: US Consumer Confidence (Jul), JOLTS (Jun)
 July 29, 2025 at 6:45 am #28084July 29, 2025 at 6:44 am #28083July 29, 2025 at 6:43 am #28082July 29, 2025 at 5:38 am #28081
Ethereum Soars on $1.9B Inflows and ETF Optimism as BlackRock and SharpLink Double Down
Ethereum (ETH) is once again at the center of investor attention, pulling in a staggering $1.59 billion in inflows over the past week.
This marks the second-largest weekly inflow in Ethereum’s history, amid growing optimism that U.S. regulators will soon approve a spot Ethereum ETF. Overall, digital asset investment products attracted $1.9 billion, marking 15 consecutive weeks of positive flows.This surge in capital has pushed Ethereum’s price up 62% this month to $3,900, positioning it just below the critical $4,000 breakout level. Meanwhile, Bitcoin ETPs faced $175 million in outflows, signaling a capital rotation from BTC to ETH and other altcoins.
Analysts point to the passage of the Genius and Clarity Acts in the U.S. as key drivers of this trend, enhancing regulatory clarity for altcoin investment vehicles.BlackRock and SharpLink Boost Ethereum Exposure
Institutional investors are doubling down. BlackRock’s iShares Ethereum ETF (ETHA) surged past $10 billion in AUM, becoming the third-fastest-growing ETF globally, while the firm raised its ETH holdings to $10.47 billion, with 100% of its crypto exposure now allocated to Ethereum.
Simultaneously, Nasdaq-listed SharpLink Gaming purchased 77,210 ETH worth approximately $295 million, raising its total ETH treasury to over 438,000 ETH. This single purchase surpassed the network’s entire 30-day ETH issuance, underscoring the aggressive accumulation trend among institutions.
Technical Indicators and Risks Remain Ethereum’s rally is further supported by bullish technical signals. A “golden cross” pattern emerged, and the MACD shows strong upward momentum, despite an overbought RSI reading of 82.07, a level often associated with potential price pullbacks.
Solana and XRP also saw inflows of $311 million and $189 million, respectively, while Litecoin and Bitcoin Cash experienced minor outflows. Meanwhile, Ethereum’s on-chain activity surged 288%, reinforcing confidence in the network’s role as the leading smart contract and DeFi platform. As regulatory momentum builds and ETF approval appears within reach, Ethereum’s dominance in institutional portfolios signals a pivotal moment for altcoin adoption—though short-term volatility remains a factor to watch. July 29, 2025 at 3:39 am #28080
Bitcoin Rejected At $120,000: Binance Whale Inflows Suggest Possible Drop To $110,000
Yesterday, Bitcoin (BTC) once again faced rejection around the $120,000 resistance level after briefly reaching a high of $119,760.
At the time of writing, the top cryptocurrency is trading slightly lower at $118,900. However, a sharp increase in whale inflows to Binance threatens to trigger further downside pressure for the digital asset.Binance Whales Ramp Up Bitcoin Deposits
According to a recent CryptoQuant Quicktake post by contributor BorisVest, Bitcoin whale activity on Binance has increased significantly in recent days.
In particular, the Binance Whale Inflow metric recorded a notable spike on July 25, signalling rising institutional participation in exchange deposits. On that day alone, the 30-day cumulative inflow to Binance surged by $1.2 billion, fuelling short-term selling pressure across the market.
Data from CoinGlass shows that between July 24 and July 25, roughly $141 million worth of BTC long positions were liquidated as a result. It’s worth noting that alongside this spike in whale deposits, retail investors have also been moving their holdings to exchanges. However, their participation remains relatively low in comparison, hinting that recent selling pressure is predominantly whale-driven.The following chart illustrates that while retail inflows have been trending upward for weeks, the sudden increase in whale deposits has introduced additional fragility into Bitcoin’s price structure.
The surge in Binance whale inflows came just before Bitcoin was rejected at the critical $120,000 level. Following this rejection, BTC retraced to the $115,000–$116,000 range, which is now acting as short-term support.
Whale inflows aren’t the only factor spooking investors. BTC reserves on centralized exchanges also recently reached a one-month high, suggesting that some holders may be anticipating a temporary pullback or consolidation phase before resuming the uptrend.
That said, Binance’s share of BTC spot trading volume recently saw a sharp rise, suggesting that a rally may be on the horizon for the world’s leading cryptocurrency.
At press time, BTC trades at $118,926, up 0.4% in the past 24 hours.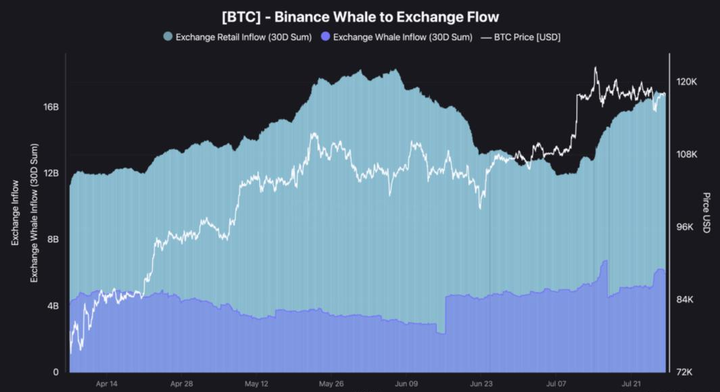 July 29, 2025 at 2:09 am #28079
Stocks in New Zealand Rise for 5th Session
The NZX 50 rose 24 points or 0.2% to 12,935 on Tuesday morning, marking its fourth straight session of gains, driven by strength in industrial services, communications, and energy minerals.
Record-high closes on Wall Street’s S&P 500 and Nasdaq Monday also supported sentiment following the announcement of a U.S.-EU trade deal that eased global risk concerns. Meanwhile, President Trump said the baseline global tariff rate will likely fall “in the range of 15 to 20%.” Hopes that the U.S. Federal Reserve will hold interest rates steady this week also encouraged traders to add new positions.
On the trade front, the U.S. and China resumed talks, with expectations growing for a 90-day extension to their tariff truce.
However, gains were limited by caution ahead of key business and consumer confidence data in New Zealand due later this week.
Early outperformers included Spark NZ (2.4%), Third Age Health Services (2.3%), South Port NZ (2.0%), and PGG Wrightson (1.8%). NZX Chart July 29, 2025 at 12:46 am #28078
US Futures Steady After Mixed Wall Street Session
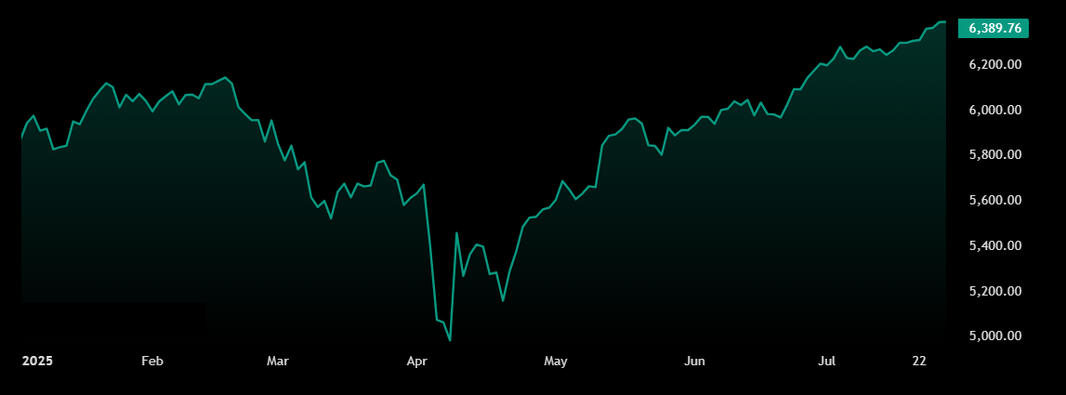
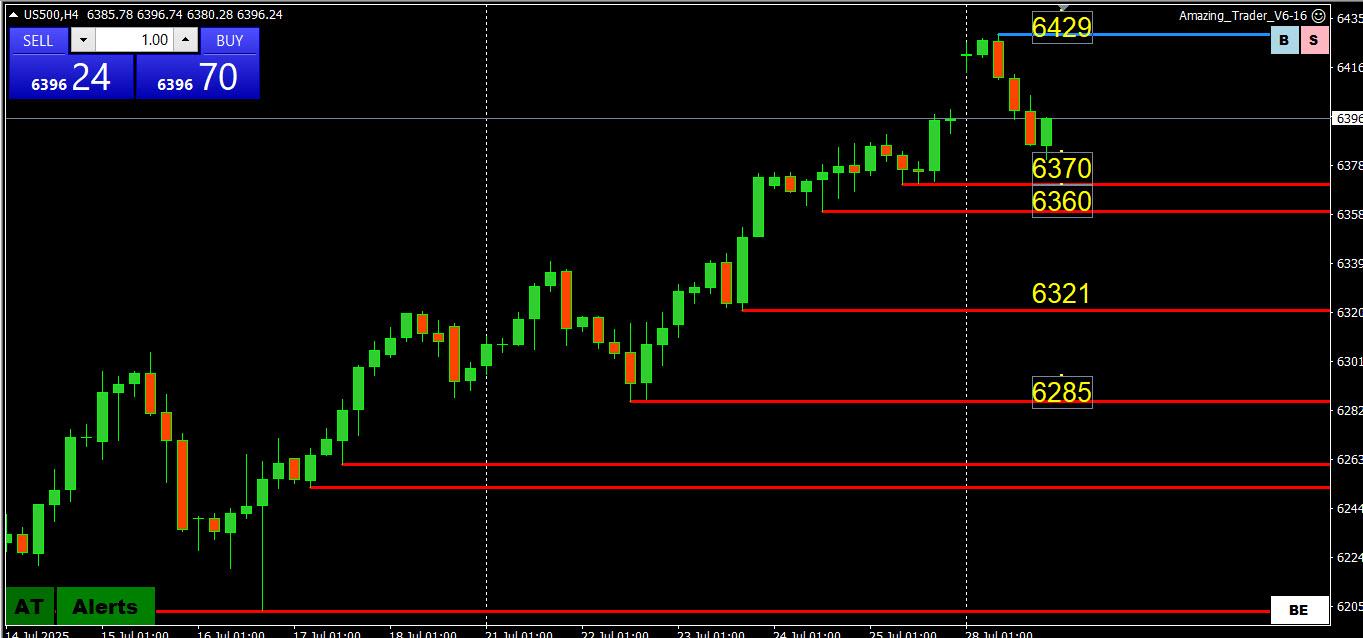
US stock futures held steady on Tuesday following a mixed performance on Wall Street to start the week. On Monday, the S&P 500 and Nasdaq Composite edged up 0.02% and 0.33%, respectively, with both indexes notching fresh record highs.
In contrast, the Dow slipped 0.14%.
The market reacted to a new US-EU trade agreement and braced for a busy week packed with corporate earnings and key economic events.
President Trump announced a trade deal with the EU that sets a baseline tariff of 15%, while optimism grew around a possible extension of the US-China trade truce.
Investors also looked ahead to earnings from major tech names including Meta, Microsoft, Apple, and Amazon.
Meanwhile, attention turns to the Federal Reserve’s policy decision on Wednesday, where traders will be watching for signals of a possible rate cut in September. Key economic data on PCE inflation and the July jobs report are also due later in the week.
S&P 500 Chart
 July 29, 2025 at 12:43 am #28077
Dollar Gains 0.60% to 148.56 Yen
Dollar/Japanese yen: 148.56 Japanese yen per dollar (0.0067 dollar per Japanese yen)
• Today the dollar gained 0.60% vs. the Japanese yen
• Largest one-day percentage gain since Tuesday, July 15, 2025
• Up for three straight sessions
• Up 1.40% over the last three sessions
• Largest three-day percentage gain since Tuesday, July 15, 2025
• Highest five pm New York rate since Friday, July 18, 2025
• Off 6.19% from its 52-week high of 158.36 hit Wednesday, Jan. 8, 2025
• Up 5.65% from its 52-week low of 140.613 hit Monday, Sept 16, 2024
• Down 3.55% vs the Japanese yen from 52 weeks ago
• Month-to-date it is up 3.14% vs the Japanese yen
• Year-to-date the dollar is down 5.50% vs the Japanese yen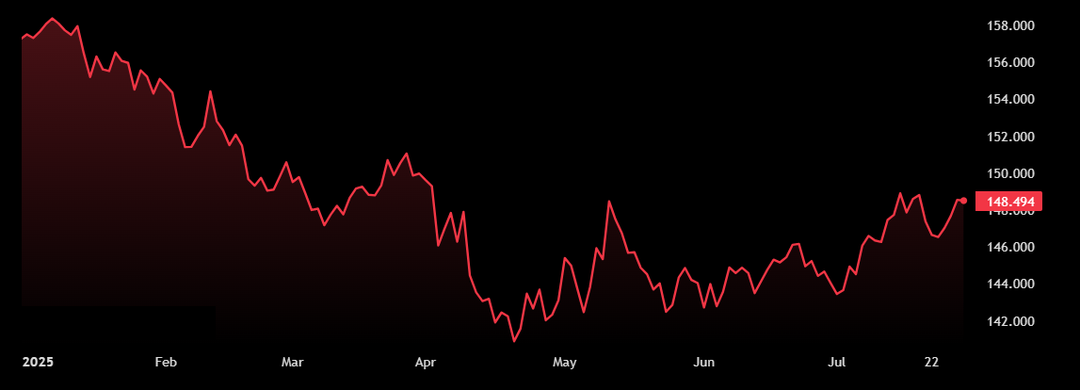 July 29, 2025 at 12:20 am #28076
Dollar Gains 0.28% to 1.3741 Canadian Dollars
Dollar/Canadian dollar: 1.3741 Canadian dollars per dollar (0.7278 dollar per Canadian dollar)
• Today the dollar gained 0.28% vs. the Canadian dollar
• Up for three straight sessions
• Up 1.04% over the last three sessions
• Largest three-day percentage gain since Friday, May 9, 2025
• Highest five pm New York rate since Thursday, July 17, 2025
• Off 5.46% from its 52-week high of 1.4535 hit Friday, Jan. 31, 2025
• Up 2.30% from its 52-week low of 1.3432 hit Tuesday, Sept. 24, 2024 • Down 0.82% vs the Canadian dollar from 52 weeks ago
• Month-to-date it is up 0.96% vs the Canadian dollar
• Year-to-date the dollar is down 4.48% vs the Canadian dollar July 28, 2025 at 11:31 pm #28075July 28, 2025 at 10:19 pm #28074July 28, 2025 at 9:34 pm #28073
The Treasury Department said it expects to borrow over a trillion dollars in the current quarter because it began July with a small cash balance and expect less cash flow in the coming months.
The Treasury estimated net marketable borrowing, the difference between the total amount to be borrowed and the amount of debt maturing, to be $1.007 trillion for the three months from July through September. Treasury’s initial estimate, which it made public in April, was for $554 billion.
July 28, 2025 at 9:31 pm #28072July 28, 2025 at 8:32 pm #28071July 28, 2025 at 8:26 pm #28070July 28, 2025 at 6:59 pm #28066EURUSD
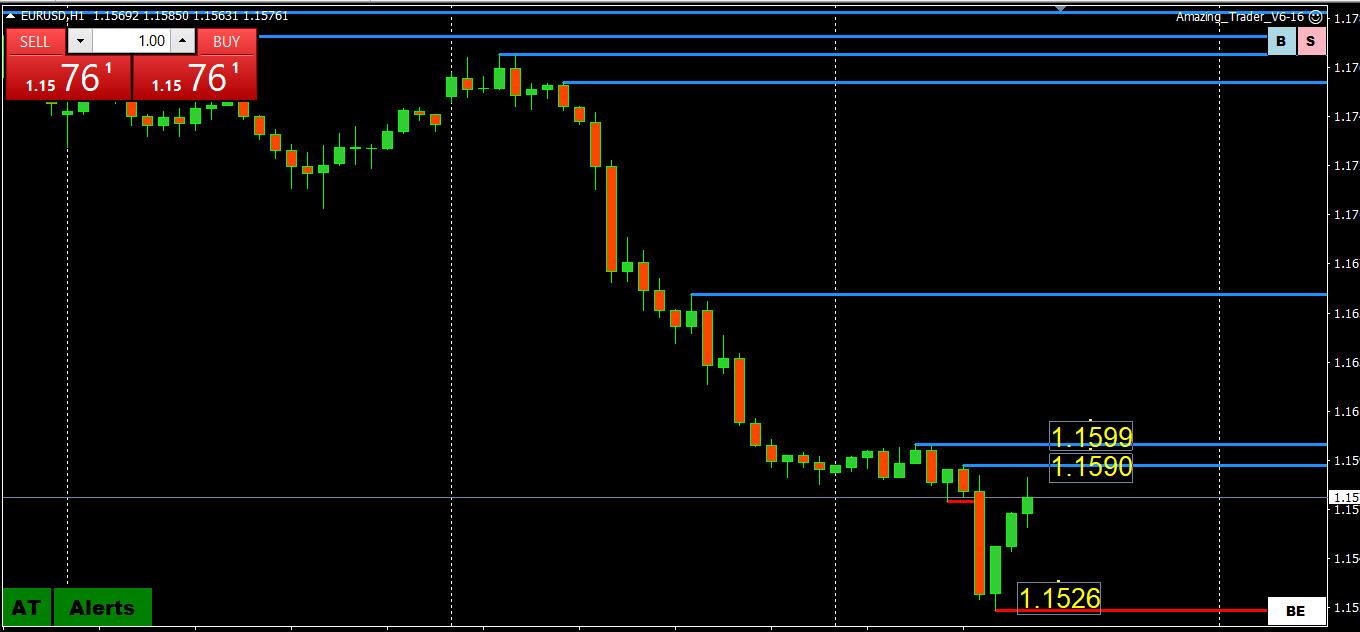
This chart is a textbook example of what it means to try and catch a falling knife.
Pro tip: In trading, “catching a falling knife” means buying an asset (e.g. in this case the EURUSD) while its price is dropping sharply in the hope of catching the bottom before a rebound.
The phrase is meant as a warning: Trying to catch a real life falling knife is risky as you can get hurt or more. In trading it is risky because the price may continue to fall further than expected, causing heavy losses.
EURUSD 4 HOUR CHART
 July 28, 2025 at 6:41 pm #28065
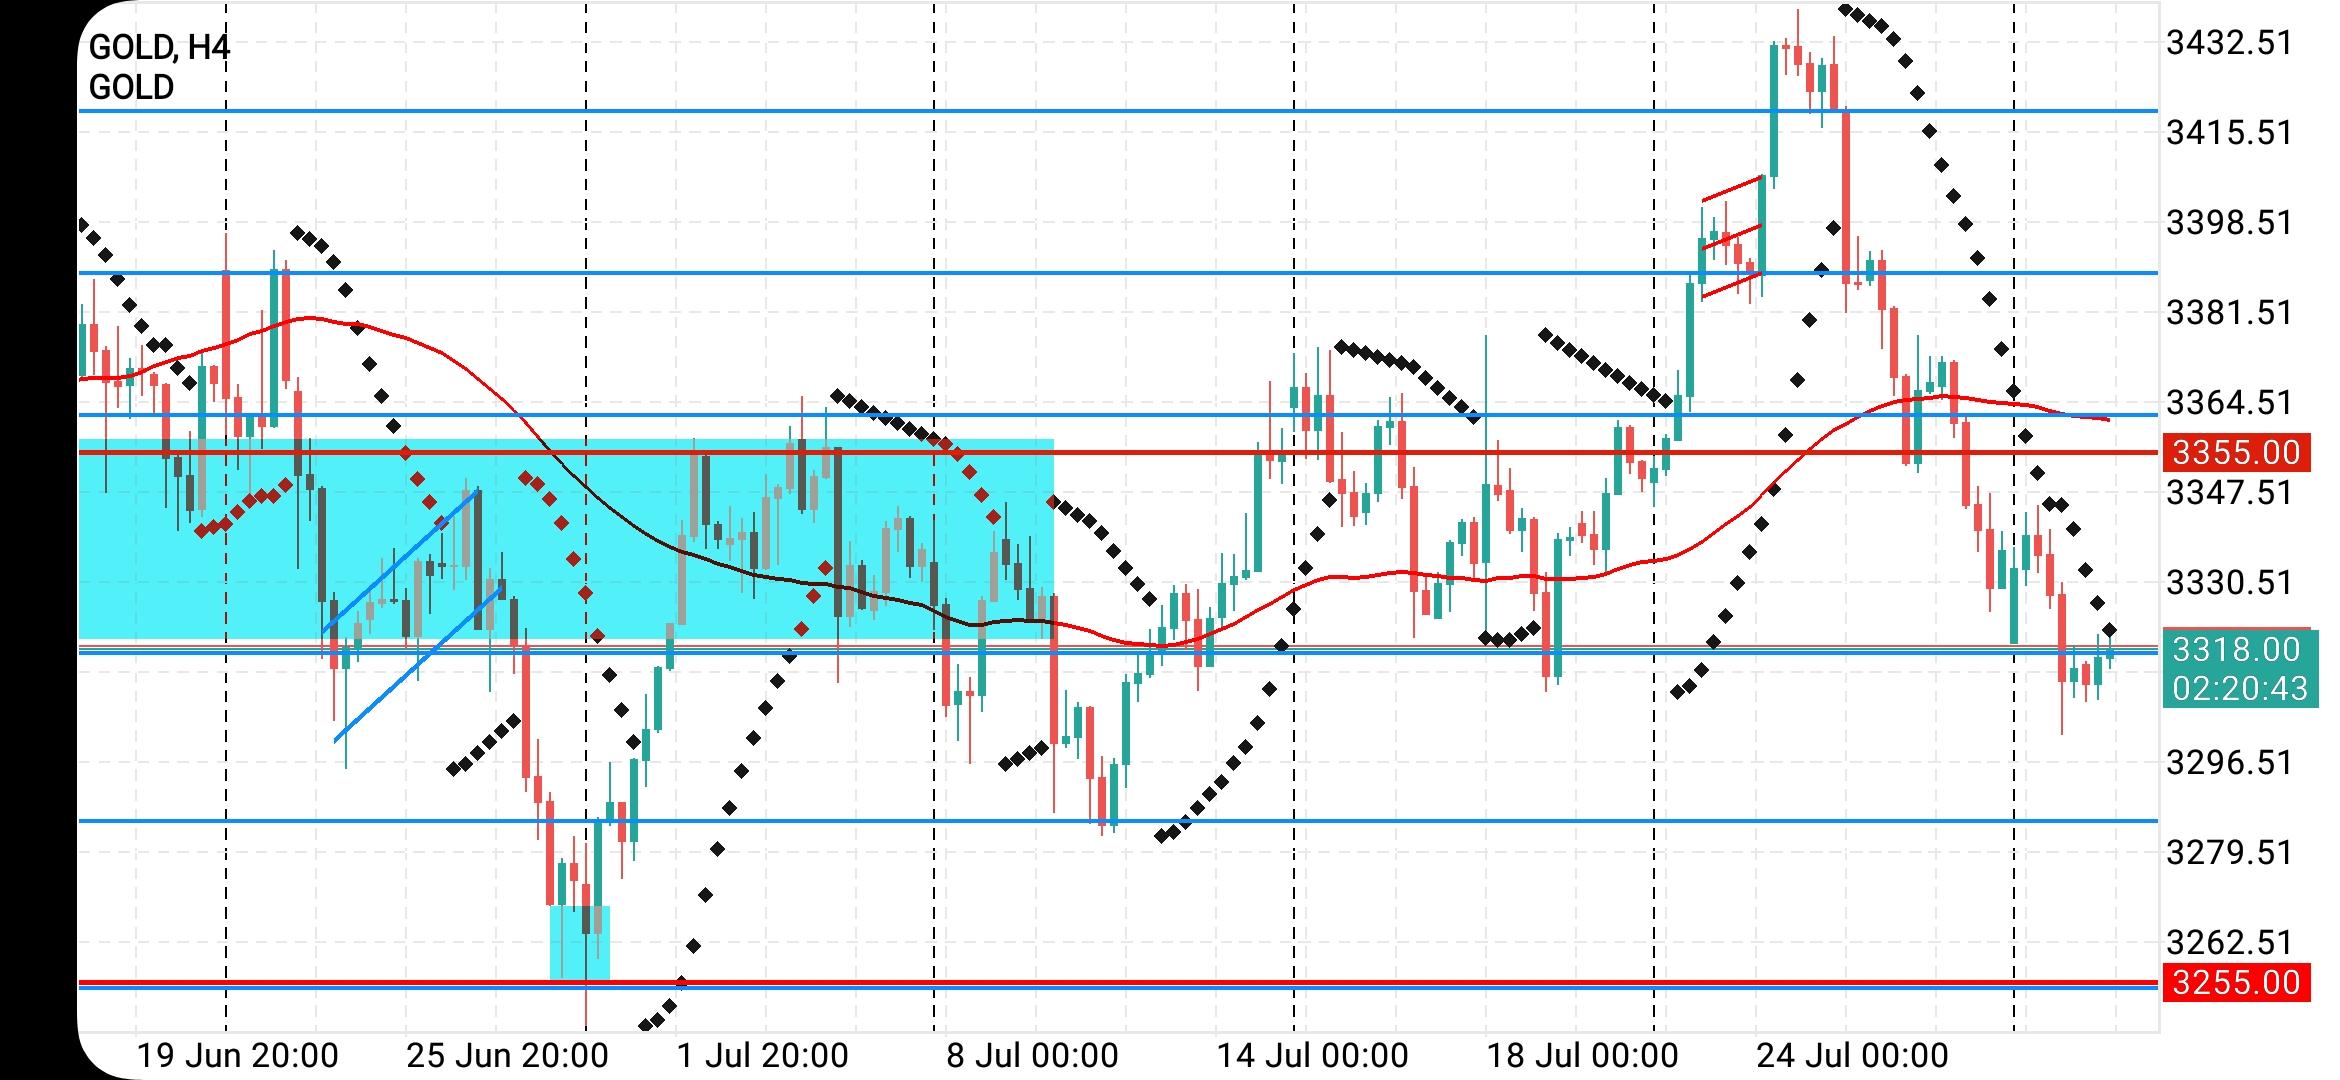
XAUUSD (GOLD)
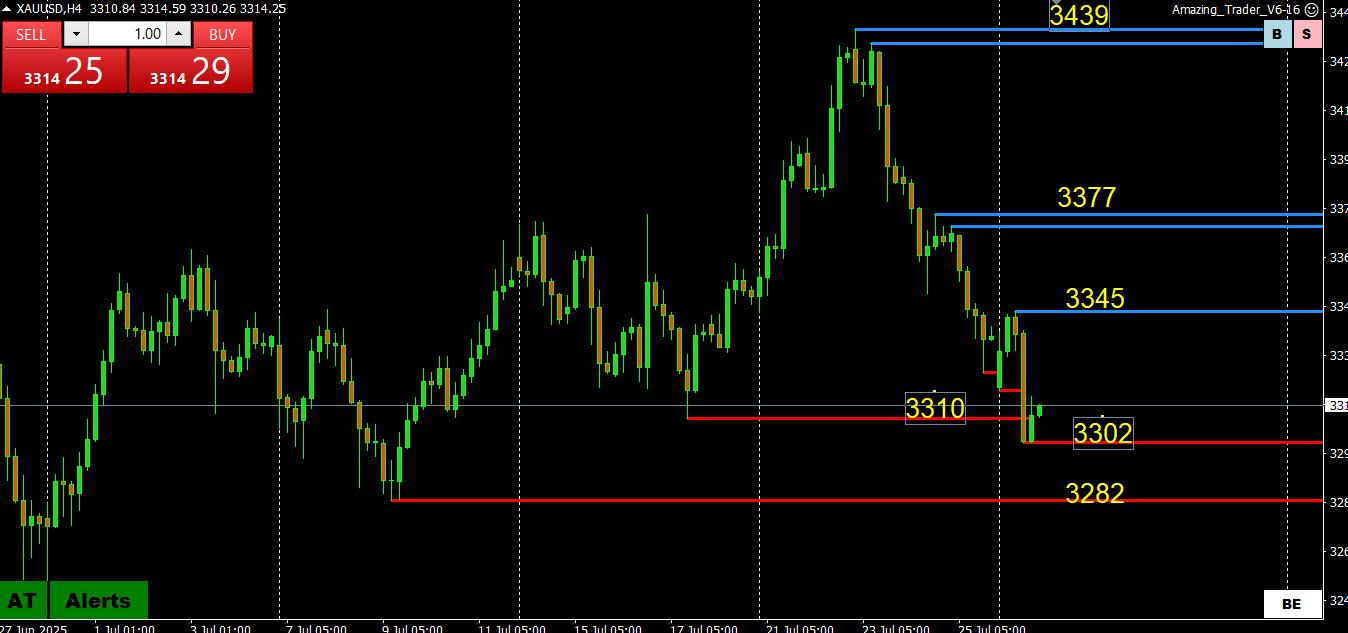
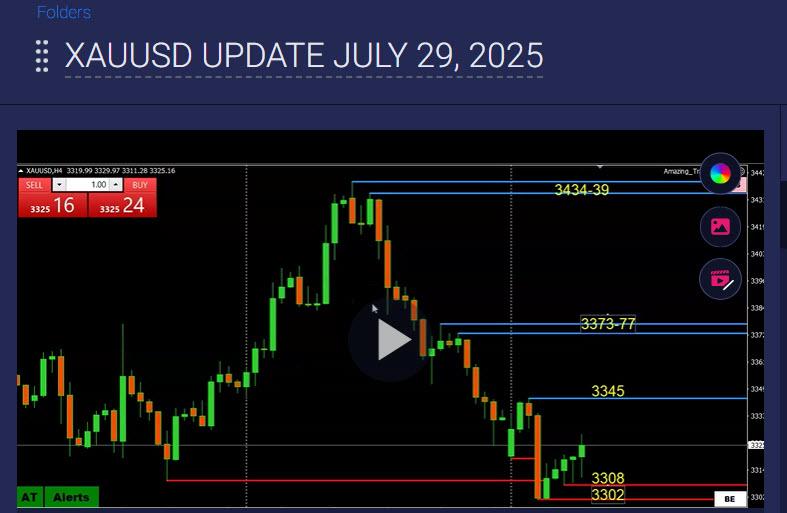
Extending its retreat (retracement?) from its 3400+ failure
Now dependent on 3282 support holding to prevent exposing the 3244 low.
On the upside, 3300+ is needed to slow the risk, 3345+ to negate it.
3300 could be pivotal in dictating the trading tone.
Monday low 3302.
XAUUSD 4 HOUR CHART
 July 28, 2025 at 5:44 pm #28064July 28, 2025 at 5:10 pm #28063July 28, 2025 at 4:53 pm #28060July 28, 2025 at 4:41 pm #28057
10-yr 4.416% at 12:31 PM EDT
Wednesday FOMC
— players likely to focus on jerome’s tremble in his voice beyond the words he may utter
Thursday PCE inflation
Friday NFPnuff data ta help one make mountain or lose a mountain
EURO 1.1602
slightly below my Sup number BUT
still abouve the 50dma
— for me keeps bias uPJuly 28, 2025 at 3:48 pm #28055July 28, 2025 at 3:26 pm #28054 -
AuthorPosts





- You must be logged in to reply to this topic.
Search
© 2024 Global View