
-
AuthorSearch Results
-
June 5, 2025 at 7:44 pm #25909
In reply to: Forex Forum
US500 (SP500) 4 HOUR
Similar to others: Outside day. Failed breakout and retreat after target hit at 6006. Potential to turn bearish or at least a stall..
Momentum: Clinging to trendline to keep it pointed up
Otherwise: 5950 is pivotal
Needs above it to keep 6000+ on the radar
Below it risk is for 5900 or below
US500 (SP500) 4 HOUR CHART
 June 5, 2025 at 3:12 pm #25888
In reply to: Forex Forum
June 5, 2025 at 1:54 pm #25882In reply to: Forex Forum
US500 (SP500)
Here is where ther6006 resistance came from… on an AT Daily Chart
US500 (SP500) DAILY CHART
 June 5, 2025 at 1:49 pm #25881
In reply to: Forex Forum
June 4, 2025 at 8:08 pm #25846In reply to: Forex Forum
June 4, 2025 at 2:47 pm #25830In reply to: Forex Forum
June 3, 2025 at 7:36 pm #25786In reply to: Forex Forum
US500 (SP500) 1 HOUR
Momentum: UP
Keeps a bid if 5945 becomes support.
Break of 5945 puts a potentially tough 5995=6005 zone on the radar.
A move above 6005 would put the record 6140 back in play
However, anything other than a firm 6000+ break would leave it in the current range.
US500 (SP500) 1 HOUR CHART
 June 3, 2025 at 1:21 pm #25761
In reply to: Forex Forum
June 2, 2025 at 7:45 pm #25739In reply to: Forex Forum
June 2, 2025 at 7:24 pm #25735In reply to: Forex Forum
May 29, 2025 at 2:10 pm #25544In reply to: Forex Forum
May 28, 2025 at 8:22 pm #25498In reply to: Forex Forum
May 28, 2025 at 2:37 pm #25473In reply to: Forex Forum
May 27, 2025 at 7:49 pm #25428In reply to: Forex Forum
May 27, 2025 at 2:32 pm #25414In reply to: Forex Forum
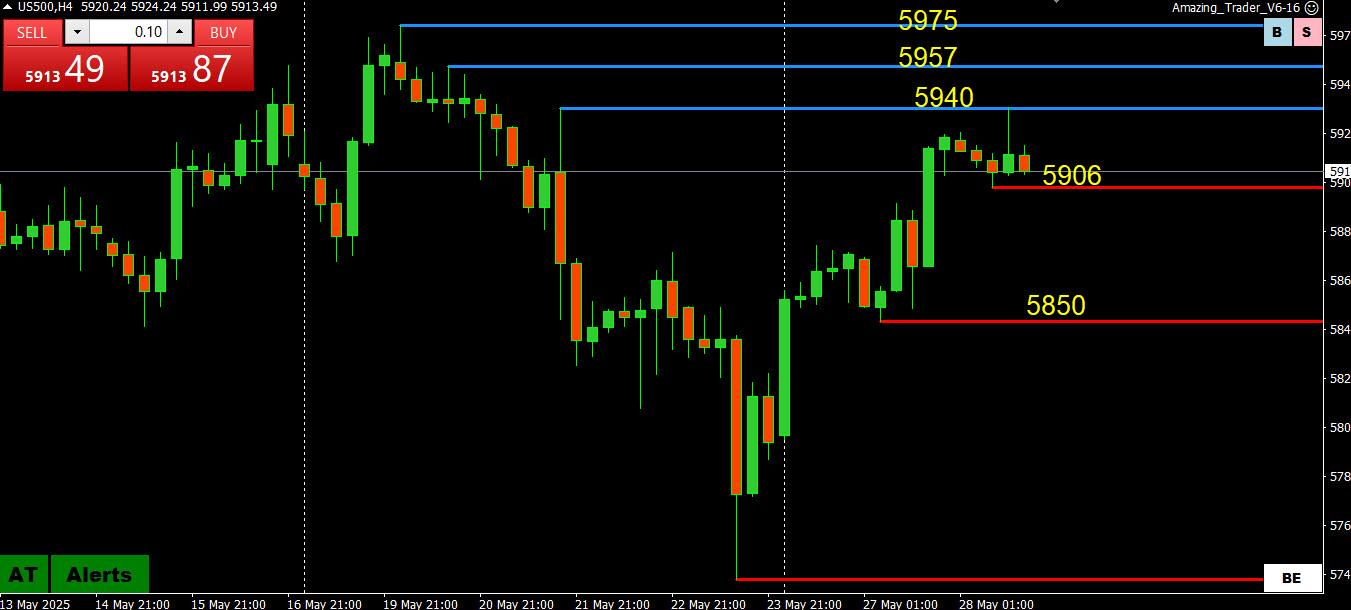
US500 (SP500) 4 HOUR – What AT is showing

Once again, it’s the reaction to news that matters
1) Trump flip flop on EU tariff deadline, 2) CB consumer confidence beat today
5900 the current obstacle… then 5940-67-75 stand in the way of 6000
Keeps a bid while above 5850
AT = The Amazing Trader
Get your 30 day trial by clicking on the Amazing Trader link un the menu bar at the top of this page)
May 23, 2025 at 6:14 pm #25317In reply to: Forex Forum
May 22, 2025 at 4:40 pm #25266In reply to: Forex Forum
May 21, 2025 at 7:57 pm #25216In reply to: Forex Forum
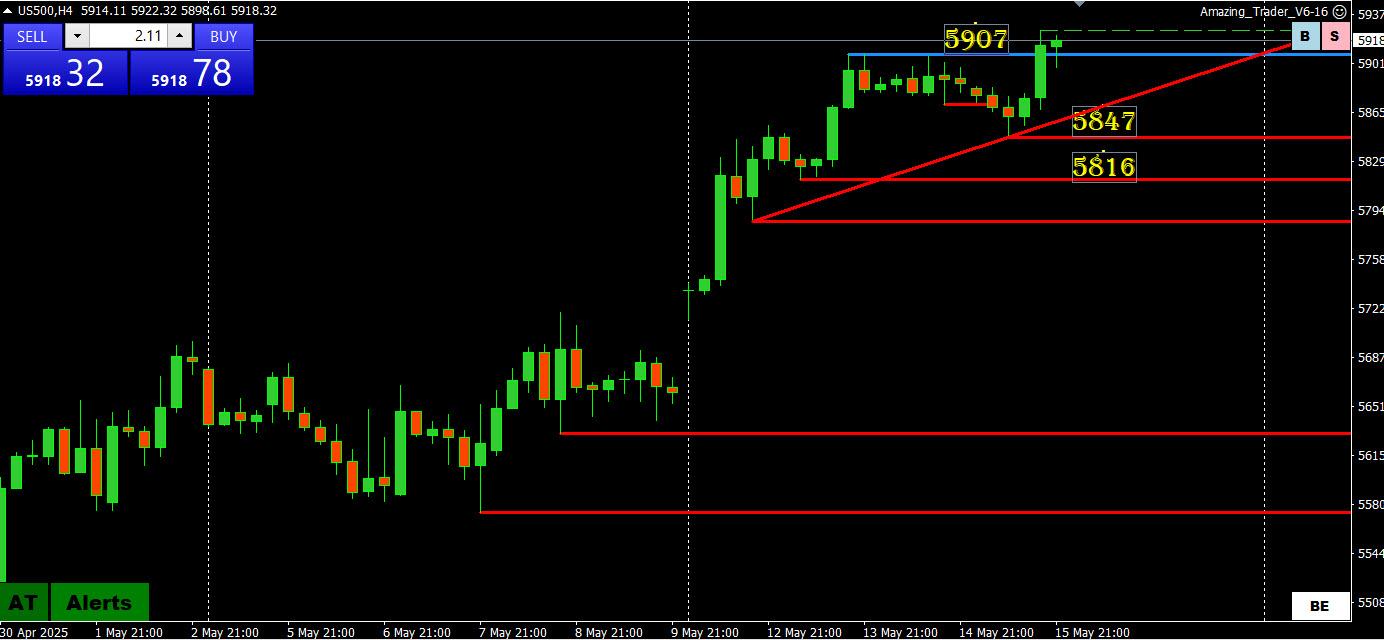
US500 (SP500) 4 HOUR – What AT is showing

The AT ladder strategy says when there are 3 lines (in this case blue) it often indicates the risk of an acceleration in the direction of the lines (in this case down).
This has seen 5875 broken, which confirms the end of the latest leg up.
While below 5875, then 5847 (briefly broken so far) and 5796-5816 are targeted. Note there is still a lingering opening week gap below 5786.
AT = The Amazing Trader
Get your 30 day trial by clicking on the Amazing Trader link un the menu bar at the top of this page)
May 21, 2025 at 3:18 pm #25199In reply to: Forex Forum
May 20, 2025 at 8:02 pm #25158In reply to: Forex Forum
May 19, 2025 at 8:29 pm #25084In reply to: Forex Forum
May 15, 2025 at 8:48 pm #24951In reply to: Forex Forum
May 14, 2025 at 5:28 pm #24868In reply to: Forex Forum
May 13, 2025 at 7:51 pm #24801In reply to: Forex Forum
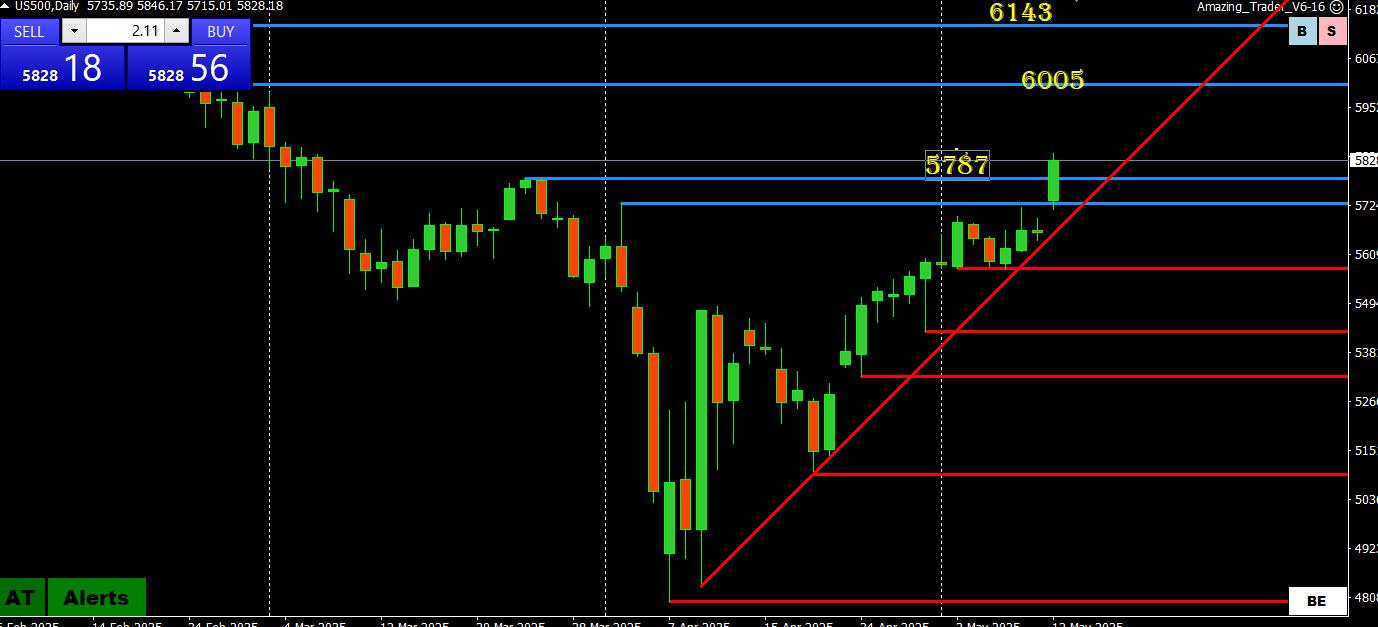
US500 (SP500) DAILY – What AT is showing
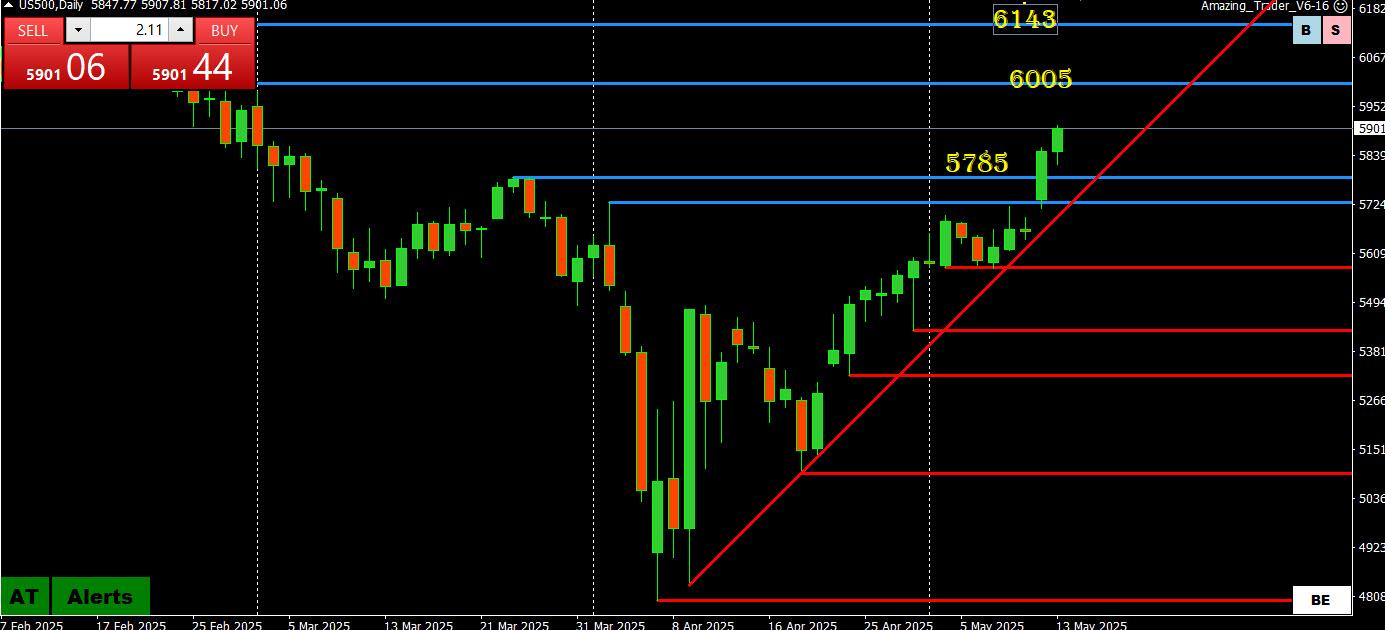
Uptrend trying to build momentum for a run at 6005
With no nearby key support, look for 5900 to dictate whether a run at 6000 is in the cards.
In any case, only below 5785-5815 would negate the upside risk.
AT = The Amazing Trader
Get your 30 day trial by clicking on the Amazing Trader link in the menu bar at the top of this page)
May 13, 2025 at 6:06 pm #24793In reply to: Forex Forum
May 13, 2025 at 2:21 pm #24788In reply to: Forex Forum
May 12, 2025 at 7:50 pm #24741In reply to: Forex Forum
May 12, 2025 at 2:20 pm #24721In reply to: Forex Forum
US500 – (SP500) 15 Minute CHART – What is AT showing?
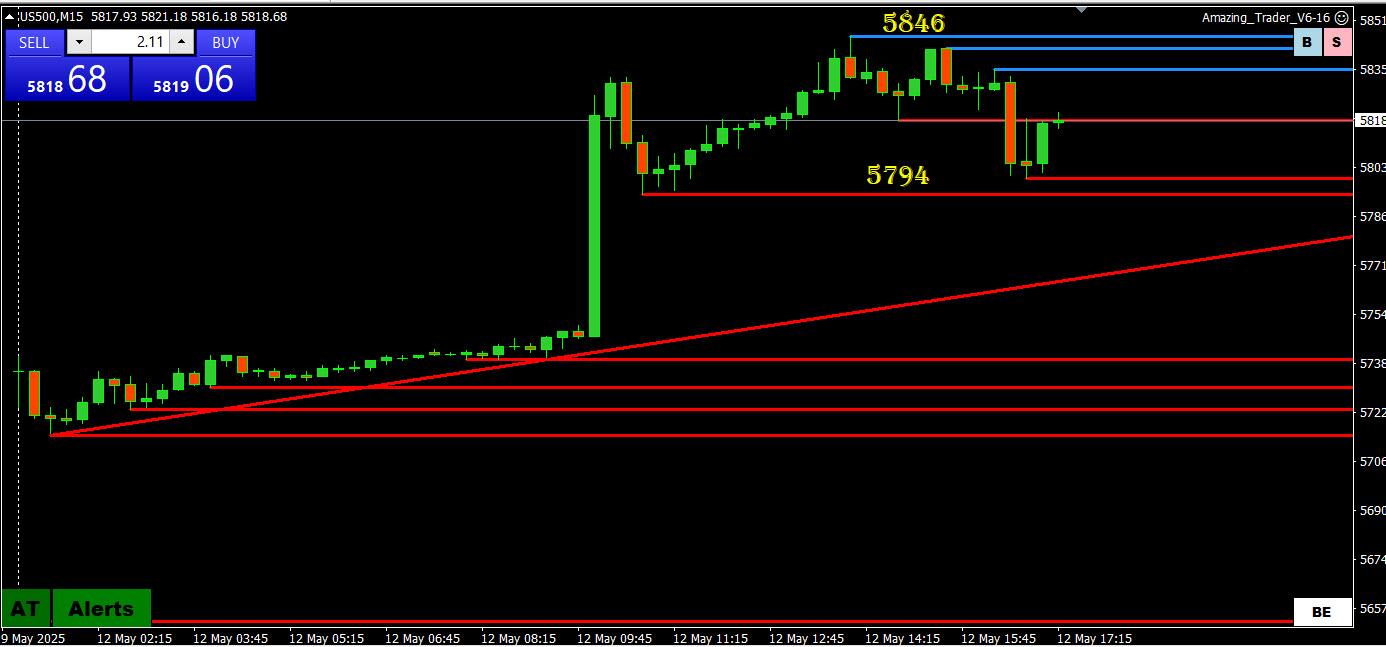
Would need to break 5846 or high is in for today.
Keeps a bid as long as 5794 holds as support.
Consolidation while within 5794-5846… below 5794 iis 4787 (level cited earlier)
(AT = The Amazing Trader charting algo…
… get your 30 day trial by clicking on the Amazing Trader link in the menu bar at the top of this page)
May 12, 2025 at 12:59 pm #24708In reply to: Forex Forum
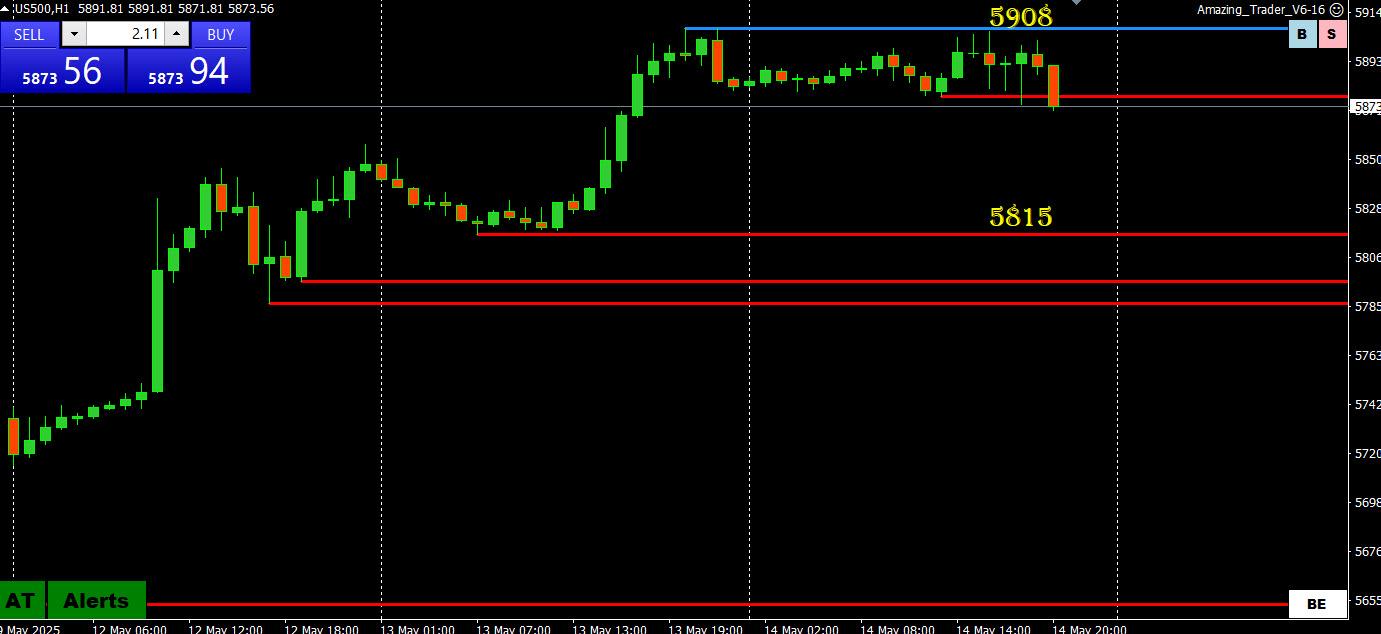
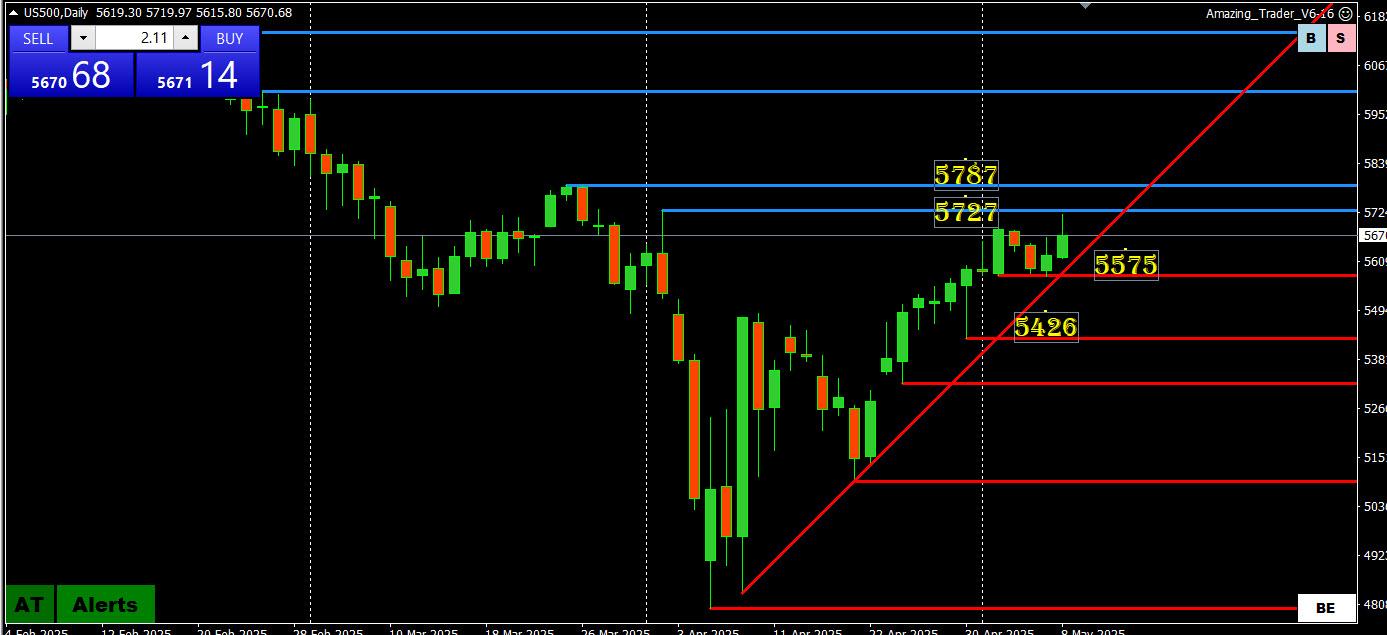
US500 (SP500) HOUR CHART – What is AT showing?
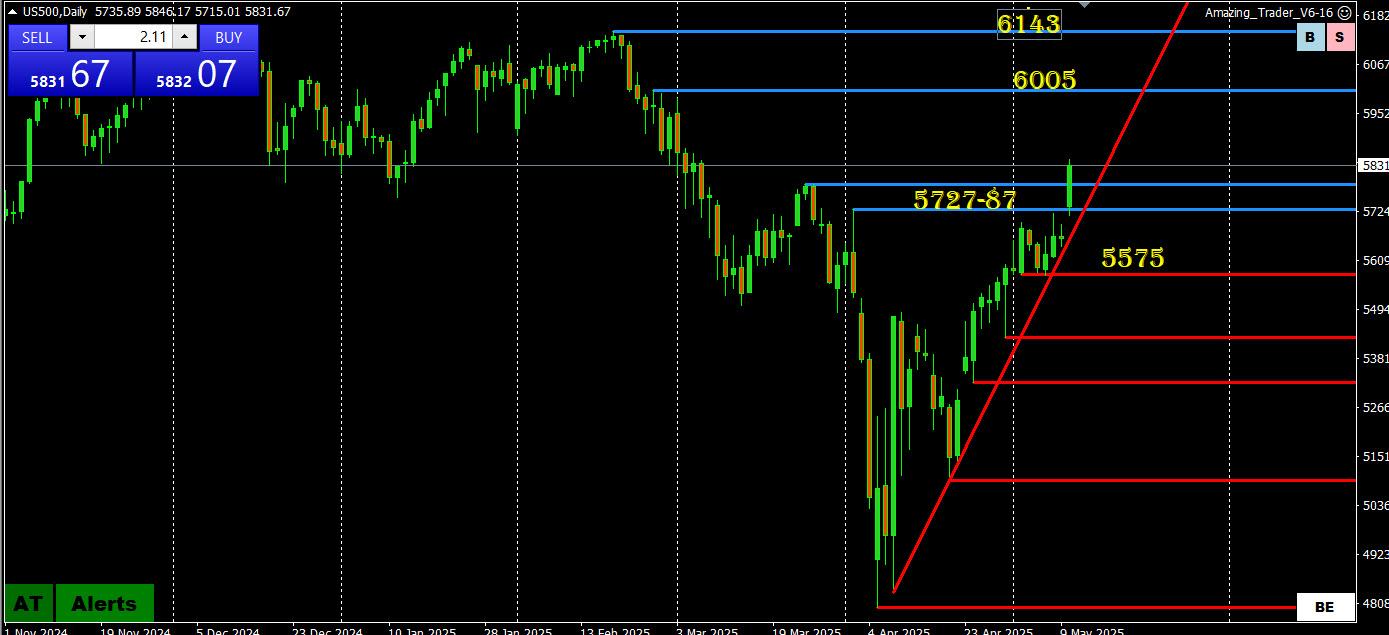

Classic case of the reaction to news being more important than the news itself
Given the pace of the move and the gap it is hard to say anything other than the uptrend would be confirmed on a close above 5787 but faces tough resistance starting around 6000.
Support zone is now 5727-5787
(AT = The Amazing Trader charting algo…
… get your 30 day trial by clicking on the Amazing Trader link in the menu bar at the top of this page)
May 8, 2025 at 8:03 pm #24408In reply to: Forex Forum
-
AuthorSearch Results








Search
© 2024 Global View