
- This topic has 28,293 replies, 54 voices, and was last updated 2 hours, 12 minutes ago by GVI Forex 2.
-
AuthorPosts
-
July 16, 2025 at 12:13 pm #27605July 16, 2025 at 11:34 am #27600July 16, 2025 at 11:18 am #27599July 16, 2025 at 11:06 am #27598
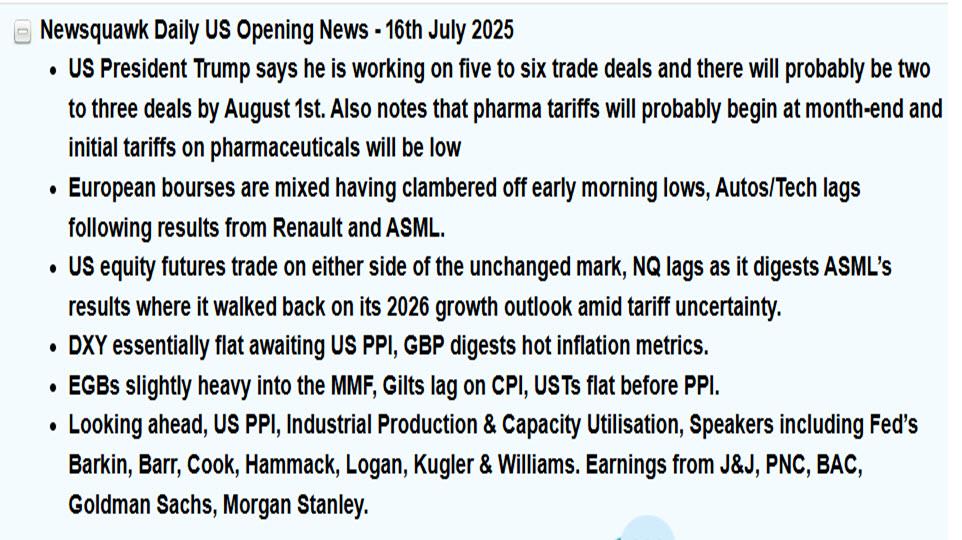
There was a time when US PPI would be ignored as CPI is the main focus but in this hyper sensitive environment markets will react to the data.
See consensus forecasts in our Economic Data Calendar
 July 16, 2025 at 9:57 am #27597July 16, 2025 at 9:54 am #27596
USDJPY
2 blue Amazing Trader lines drawn off the high indicates a potential change in direction but after the one way move yesterday there are no obvious key support levels that would need to be broken to fuel a retracement.
Use the intra-day low at 148.63 and 148.00-50 (and the trendline within it) AS supports
Note thee seems to be a correlation between a weaker USDJPY and US bond yields backing off a bit so keep an eye on this relationship to see if it continues )intra dat correlations can often be fickle and suddenly stop working).
USDJPY 1 HOUR CHART
 July 16, 2025 at 9:39 am #27595July 16, 2025 at 9:29 am #27594
Using my platform as a HEATMAP shows
… the dollar consolidating after yesterday’s sharp move higher awaiting the release of U.S. PPI. Markets will be most sensitive to any miss on the upside in inflation data,
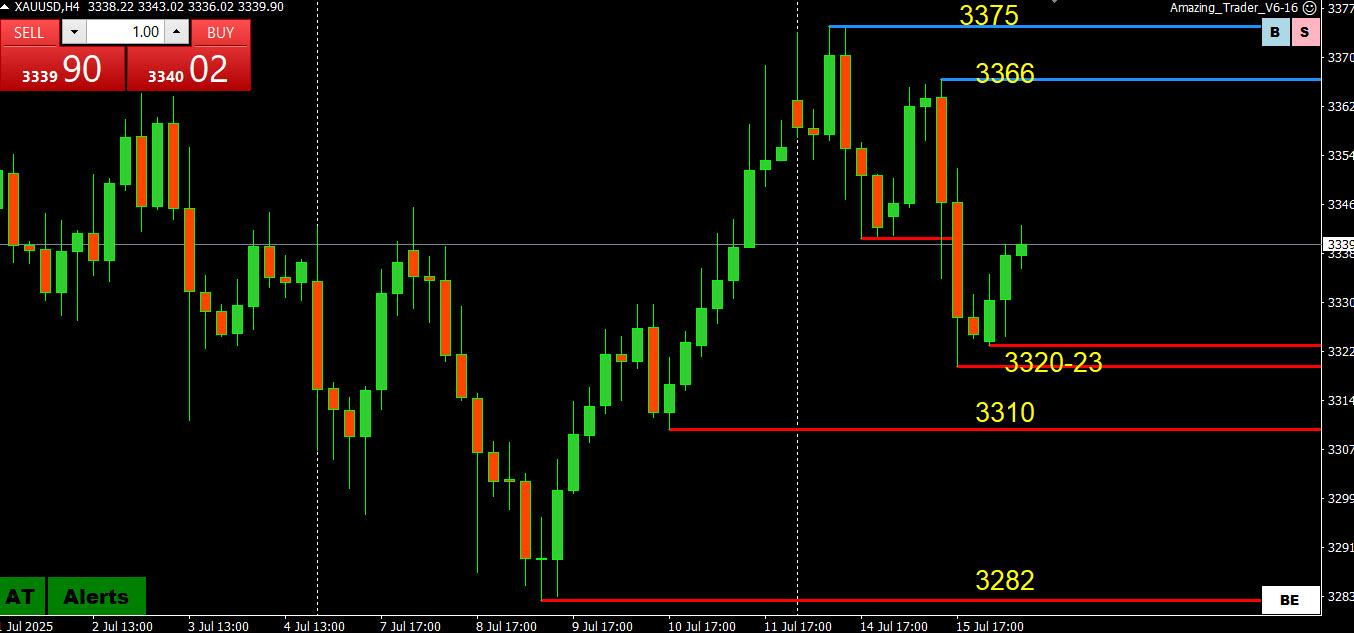
Gold is trading up as it consolidates within its range.
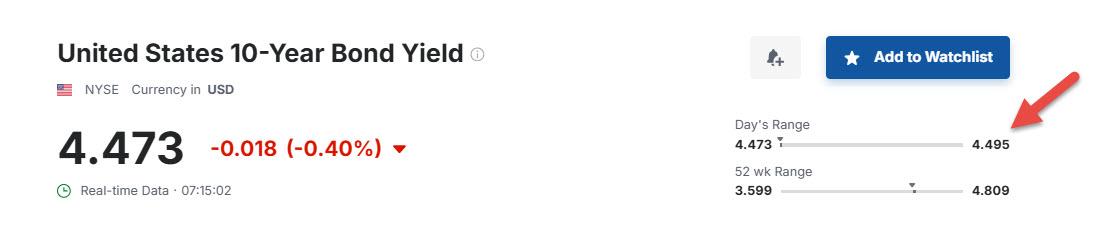
US bond yields have steadied but remain elevated just below the pivotal 4.50%
U.S. stocks have steadied as well after a whipsaw set yesterday that saw it end lower on the day.
 July 16, 2025 at 12:40 am #27593July 16, 2025 at 12:36 am #27592July 15, 2025 at 9:55 pm #27591July 15, 2025 at 9:49 pm #27590
yeaaa-h ..”Prices for audio-video equipment rose 1.1% over the month and have risen 11.1% on a year over year basis”
sticki prices will favour “authorities” to remain reluctant to lower rate. Assuming m/m 0.3% CPI for next few months , by yr-end it ll hit 3+%. Jerome gang will want to see at least that before they hint at wanting to get off their wait-n-see chair.
All the while donald will be yelling and screaming at them.Thing to watch is player manifest confidence in FED’s ability to keep grip on rising prices.
In that regard I ll be looking for a tilt down of the USD.DXY 98.63 at 17:47
July 15, 2025 at 9:18 pm #27589July 15, 2025 at 8:01 pm #27588NAS100 (NASDAQ)
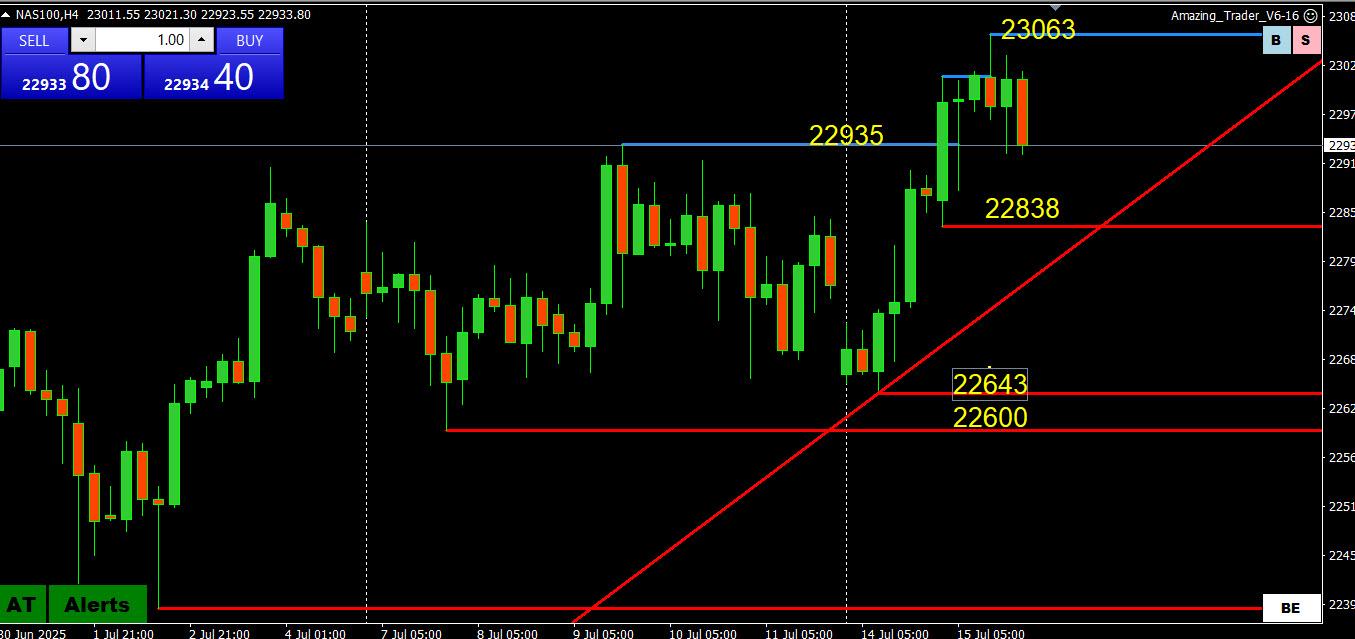
Similar to US500 … a retreat from a new record high except still having a stronger trend.
To raise the risk that the top is in, at least for now, back below the old record high (22935) and 22838 would indicate a break of momentum.
To do more damage, the trendline and 22600-43 would need to be broken.
One change is there is little to go after on the upside unless 23063 is broken,
NAS100 4 HOUR CHART
 July 15, 2025 at 7:54 pm #27587
Advanced Micro Devices Inc. – AMD
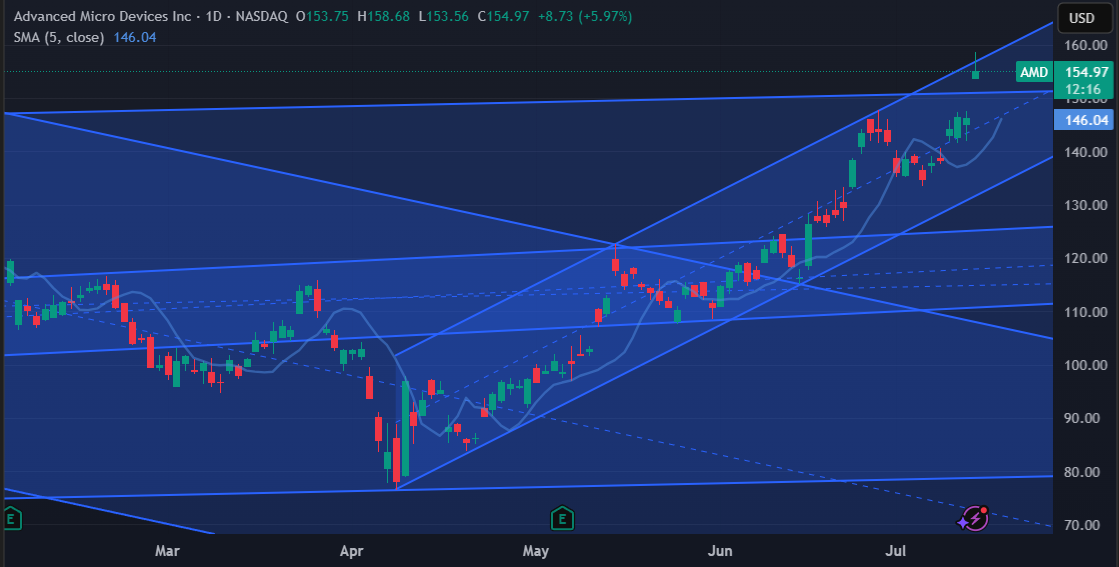
When I said that AMD needs to take out 147.75 to be able to reach 161.00 and higher, seemed over the top to many….
High today : 158.68
Now that 161.00 doesn’t look that far away, does it…
For the rally to continue, AMD has to hold on 151.00 – previous resistance – now support.
If so, we might be on our way towards 220.00 – ATH 227.30
Time will tell…
 July 15, 2025 at 7:51 pm #27586July 15, 2025 at 7:47 pm #27585July 15, 2025 at 7:41 pm #27584
Nvidia – NVDA
And as expected Nvidia has reached target at 172.20 ( even breached it a bit – actual high 172.40 )
So what now ?
Well, in case it goes above today’s high , this week’s target is set at 175.50
In such a case, Uptrend angle would be lifted and we might be looking at a blow off rally that would lead all the way to 190.00, before the correction kicks in.
 July 15, 2025 at 7:33 pm #27583July 15, 2025 at 7:26 pm #27582
GameStop Corporation – GME
Once the Meme Star, GME lost its mojo…
It is stuck for over a month in a very tight range, with resistance at 24.00 blocking any attempt to move higher.
Even if it manages to break above it, GME will face a problem already at 26.00
Support at 22.45 is holding for now, but if lost two targets are visible : 20.75 & 16.65
BTC rally to the new high at 123.235 did not help even a bit to GME, so it seems like a doomed stock right now…
 July 15, 2025 at 6:09 pm #27581July 15, 2025 at 5:48 pm #27580July 15, 2025 at 5:33 pm #27579
Bond market sends troubling signal on inflation that should concern investors
Treasuries were selling off Tuesday after the June CPI report
The U.S. bond market was in the process of selling off on Tuesday in a manner that tends to spell fresh trouble for many stock investors.
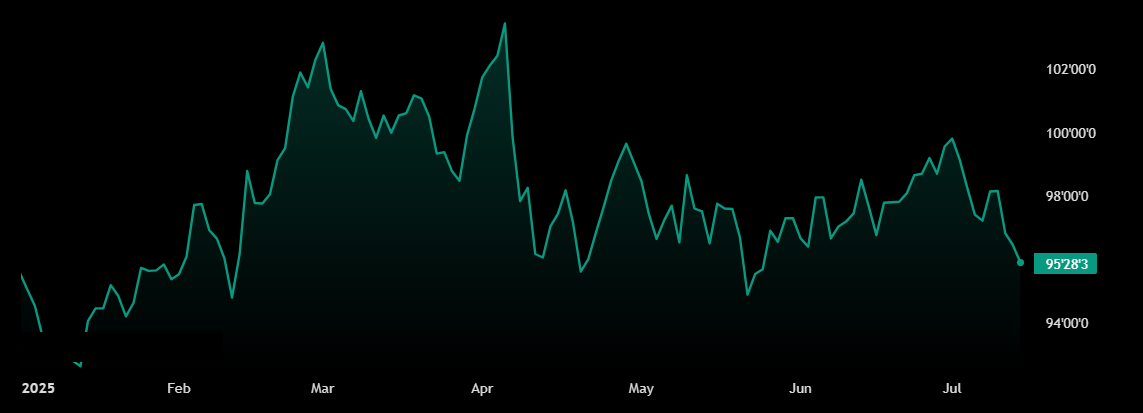
The selloff in Treasuries sent the yield on the 30-year bond BX:TMUBMUSD30Y above 5% and on its way toward its highest closing level since May. Back in May, the 30-year yield’s rise above 5% was accompanied by worries about the U.S.’s fiscal outlook. By contrast, Tuesday’s moves were largely about the outlook for inflation after June data showed consumer prices rose by the most on a monthly basis since the beginning of the year.
Read: 30-year Treasury yield is above 5% again – that’s usually a bad sign for stocks
A 30-year Treasury yield that rises above 5% tends to be negative for stocks because of the way it impacts borrowing rates for households and businesses. The yield is used as a benchmark on everything from mortgages to corporate bonds, and also provides clues on market participants’ outlook for the economy and government debt.
Among other things, Tuesday’s rise in yields was sending the message that U.S. policymakers may not be able to cut interest rates in two quarter-point increments this year, as Federal Reserve officials had signalled in June.
There’s now a possibility that Fed officials will cut rates only once in the third quarter
Tuesday’s data revealed that the consumer-price index rose 0.3% last month, the biggest rise since January. The overall rate of inflation in the past year climbed to 2.7% from 2.4% in the prior month, and the yearly core rate jumped to 2.9% from 2.8% previously.
The latest inflation report “practically confirmed that President Trump’s tariffs acted to push up consumer prices in June
US30Y Price Chart
 July 15, 2025 at 5:28 pm #27578
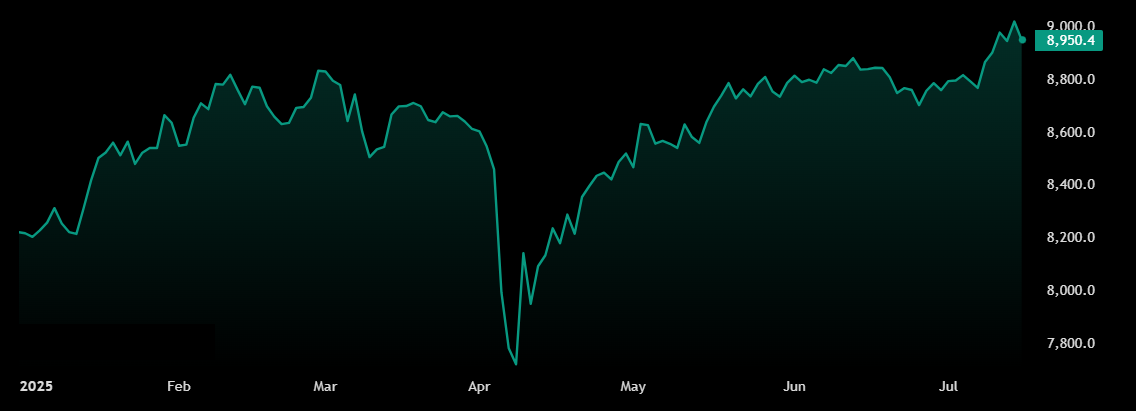
FTSE 100 Index Ends 0.66% Lower at 8938.32
The FTSE 100 Index is down 59.74 points or 0.66% today to 8938.32
· Fourth highest close in history
· Largest one day point and percentage decline since Wednesday, April 9, 2025
· Down two of the past three trading days
· Off 0.66% from its record close of 8998.06 hit Monday, July 14, 2025
· Up 41.03% since the pre-Brexit vote level of 6338.10 hit Thursday, June 23, 2016
· Today’s closing value is the fourth highest this year
· Off 0.66% from its 52-week high of 8998.06 hit Monday, July 14, 2025
· Up 16.39% from its 52-week low of 7679.48 hit Wednesday, April 9, 2025
· Rose 9.47% from 52 weeks ago
· Off 0.66% from its 2025 closing high of 8998.06 hit Monday, July 14, 2025
· Up 16.39% from its 2025 closing low of 7679.48 hit Wednesday, April 9, 2025
· Month-to-date it is up 2.02%
· Year-to-date it is up 765.30 points or 9.36%
 July 15, 2025 at 5:24 pm #27577
US Equity Indexes Mixed as Nvidia Helps Lift Nasdaq While Investors Weigh Bank Earnings, Inflation Print
US equity indexes traded mixed after midday Tuesday, following quarterly earnings from the largest banks, consumer price inflation and renewed optimism among technology investors.
The Nasdaq rose 0.4% at 20,658.1, while the S&P 500 slipped 0.1% to 6,263.4 and the Dow Jones Industrial Average fell by 0.7% to 44,140.9. All sectors except technology and communication services fell intraday. Healthcare, energy, and financials led the decliners.
Wells Fargo WFC lowered its full-year net interest income outlook despite reporting second-quarter results above market expectations.
JPMorgan Chase JPM reported better-than-expected Q2 results as investment banking activity gained momentum amid improving market sentiment. Chief Executive Jamie Dimon, however, warned that the US economy still faces substantial risks, including trade tariffs.
Citigroup C reported a year-over-year gain in net income and revenue during Q2.
Meanwhile, in economic news, the consumer price index rose 0.3% month-over-month in June, the Bureau of Labor Statistics reported Tuesday. That’s in line with a Bloomberg-compiled survey and a jump from a 0.1% gain in May. Annually, inflation accelerated to 2.7% from 2.4%, faster than the 2.6% consensus.
Core inflation, which excludes the volatile food and energy components, grew 0.2% from 0.1%, below the 0.3% forecast. The annual core measure came in at 2.9%, in line with market projections.
Most US Treasury yields rose, with the 10-year Treasury up 5.4 basis points to 4.48% and the two-year 5.6 basis points higher at 3.95%.
Nvidia NVDA secured a “monster win” as the US government assured that licenses for the H20 graphic processing units sales in China will be granted, Wedbush Securities said in a note to clients Tuesday. The tariff war halted H20 sales, and Wedbush said this cost Nvidia about $8 billion in quarterly sales. Shares jumped 4.2% intraday, among the top gainers in the S&P 500, the Nasdaq, and the Dow.
Nasdaq Chart
 July 15, 2025 at 5:20 pm #27576
European Stocks Close Lower
European stocks erased early gains and closed mostly lower on Tuesday as markets continued to assess how potential tariffs from the US may hurt European businesses.
The STOXX 50 closed 0.3% lower at 5,358 and the STOXX 600 fell 0.4% to close at 545.
US President Trump had previously announced a 30% tariff on imports from the European Union starting August 1st, prompting the bloc to continue to seek a trade agreement.
EU officials recently stated that a deal is still being negotiated to avoid tariffs, but a retaliation package is being prepared regardless, which may tariff up to €72 billion worth of US goods.
Financial service providers led the losses in the session, with Allianz, BBVA, and UniCredit dropping between 2% and 1%.
Also, Ericsson fell over 4%, despite the company beating earnings forecasts, as US import tariffs weighed on results.
On the other hand, ASML jumped 2.7%, benefitting from the US relaxing export curbs on Nvidia chips.
Stoxx 600 Chart
 July 15, 2025 at 5:13 pm #27575July 15, 2025 at 5:04 pm #27574July 15, 2025 at 5:03 pm #27573July 15, 2025 at 4:54 pm #27572
-
AuthorPosts




- You must be logged in to reply to this topic.
Search
© 2024 Global View