
-
AuthorSearch Results
-
January 13, 2026 at 8:53 pm #35305
In reply to: Forex Forum
January 10, 2026 at 5:08 pm #35202In reply to: Forex Forum
2026 Global Markets Scorecard
Consensus forecasts to start 2026 were calling for firmer US stocks, firmer Gold, a weaker dollar, most notably vs the JPY based on divergent monetary policies between the BoJ and the Fed, and a dollar and sharply higher Bitcoin,
Scorecard after the first full week of trading (focus in 2nd week will be on whether momentum builds further):
- US stocks (up): DJIA and US500 setting record highs while NAS100trying to play catch up.
- Gold: Closed the week at 4500, putting the record 4549 high on the radar.
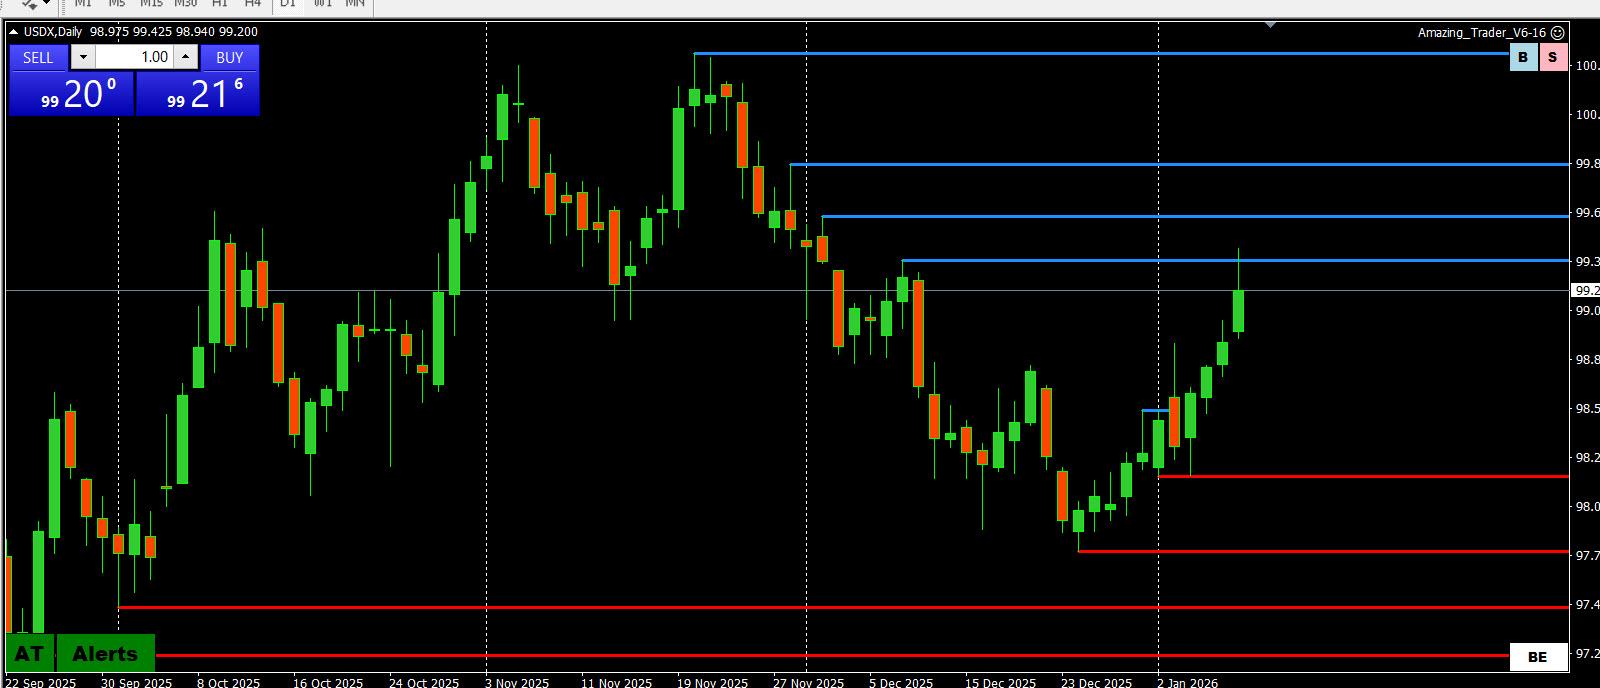
- US dollar: Confounding the consensus by ending the week on a firm note.
- Bitcoin: Disappointing start after not able to sustain a breakout from its congestion range.
Test now comes in the second week where SCOTUS will issue its ruling on the legality of tariffs on Wednesday. In addition, Trump’s choice of a new Fed Chair can be announced at any time (perfect for a distraction).
USDX (US DOLLAR INDEX) DAILY CHART
 January 10, 2026 at 4:51 pm #35201
In reply to: Forex Forum
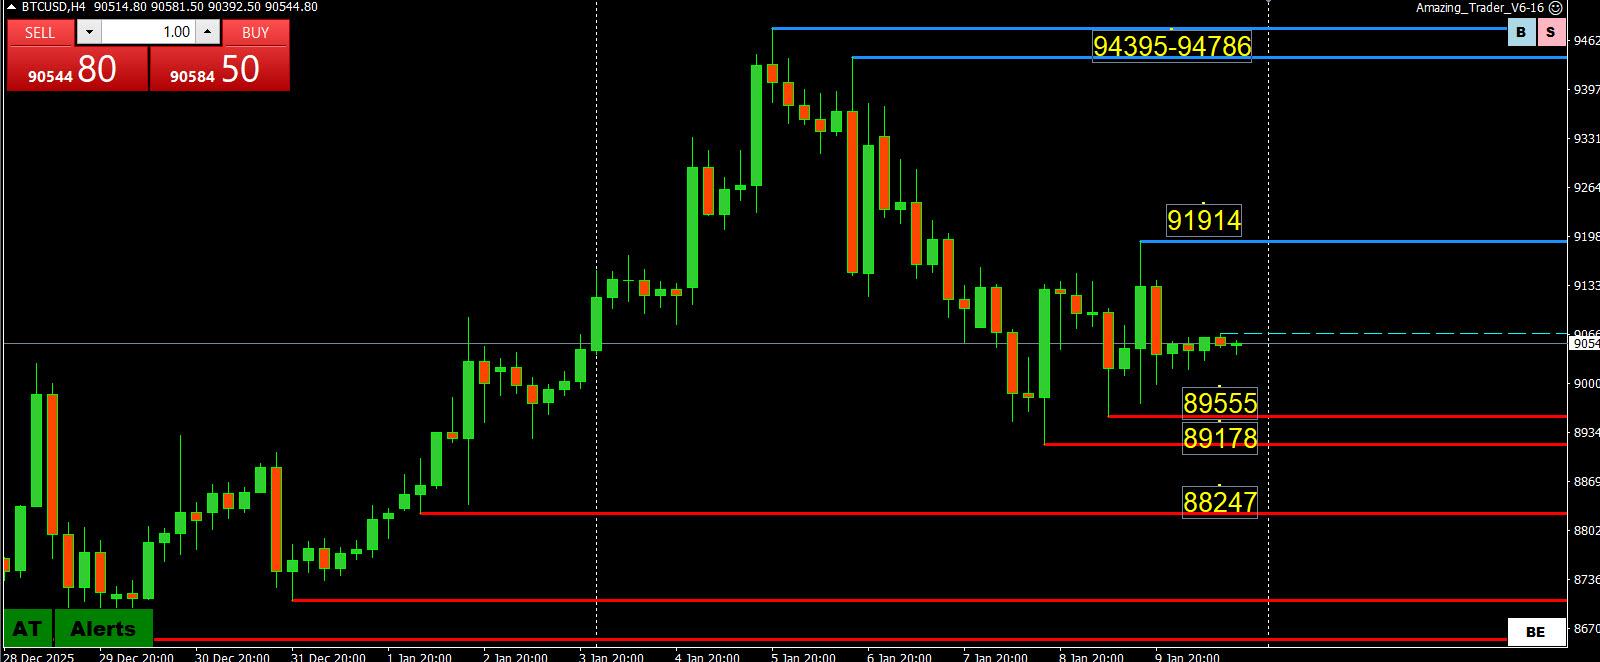
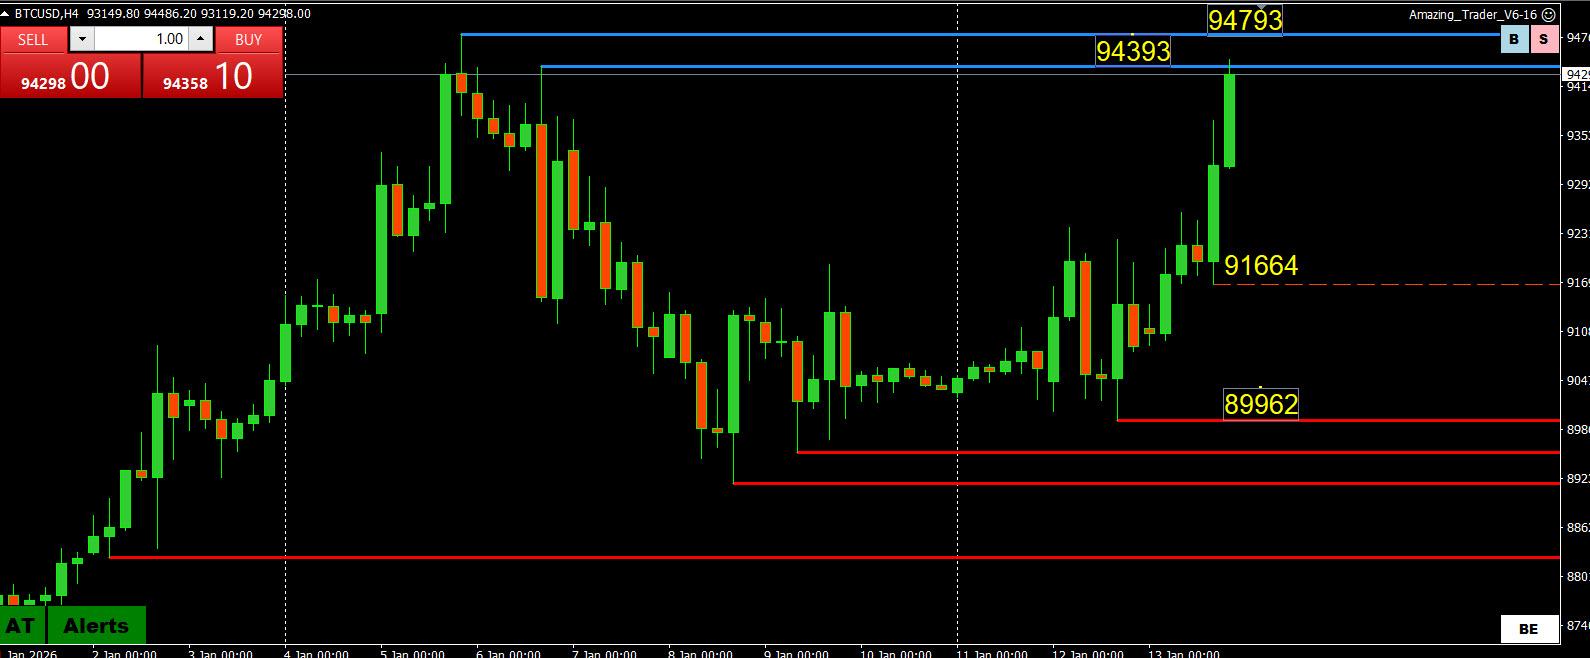
BTCUSD (BITCOIN) UPDATE
- Disappointing but not fatal start to 2036
- It’s hard to find a correlation for Bitcoin with the relationship with tech shares breaking down. G
- This leaves it back into a congestion range bounded by 89-92K (can also use 88-92K) where 90K is clearly pivotal in dictating its tone going forward.
BTCUSD 4 HOUR CHART
 January 8, 2026 at 1:44 pm #35127
In reply to: Forex Forum
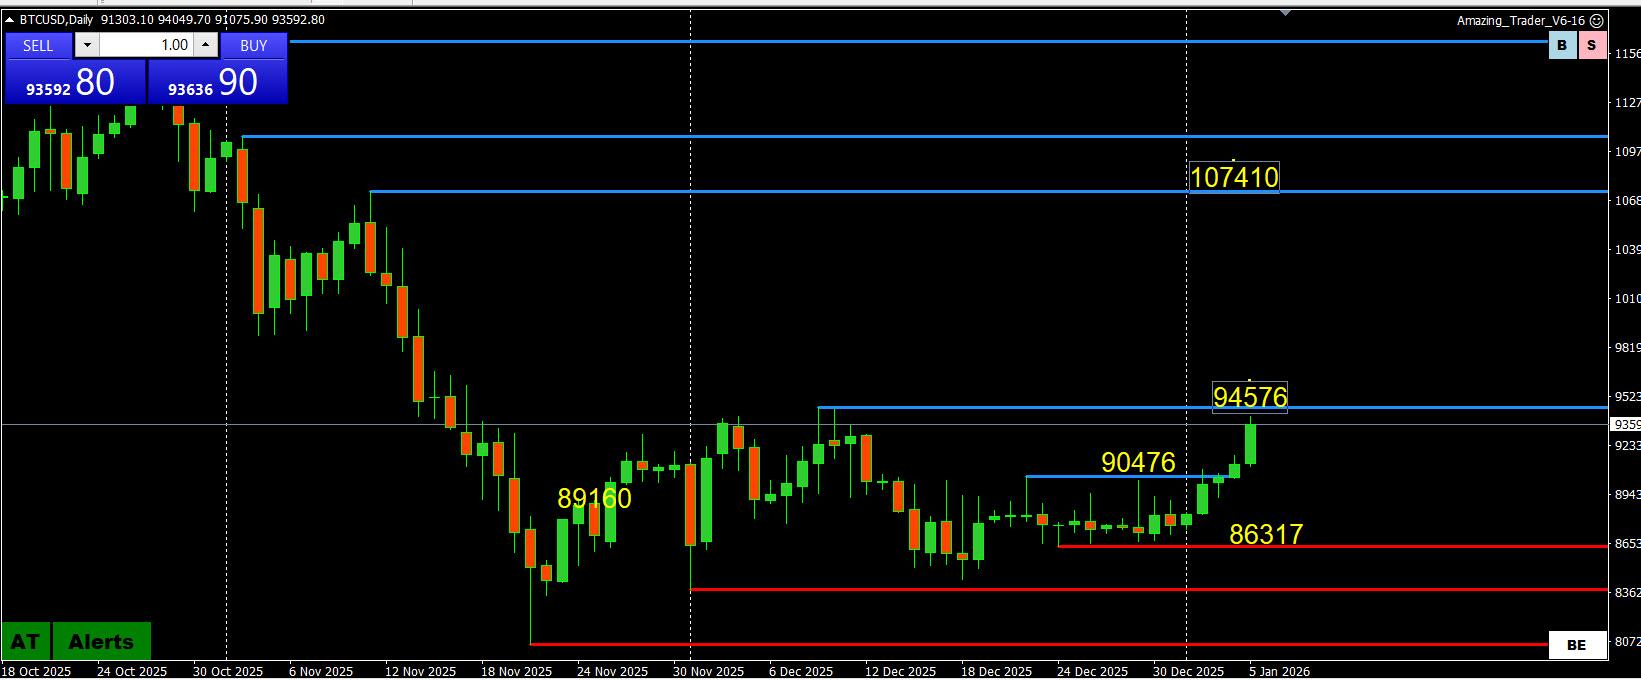
BTCUSD Weekly
Bitcoin failed in front of 95K and now we have to see what is going to happen at 87.500
Loss of opens a road for test of 70K
There are two more levels within a reach now : 65K & 53K – later being a last line of defence for BTC for it to be able to continue with another Rally this year.
 January 8, 2026 at 10:20 am #35116
In reply to: Forex Forum
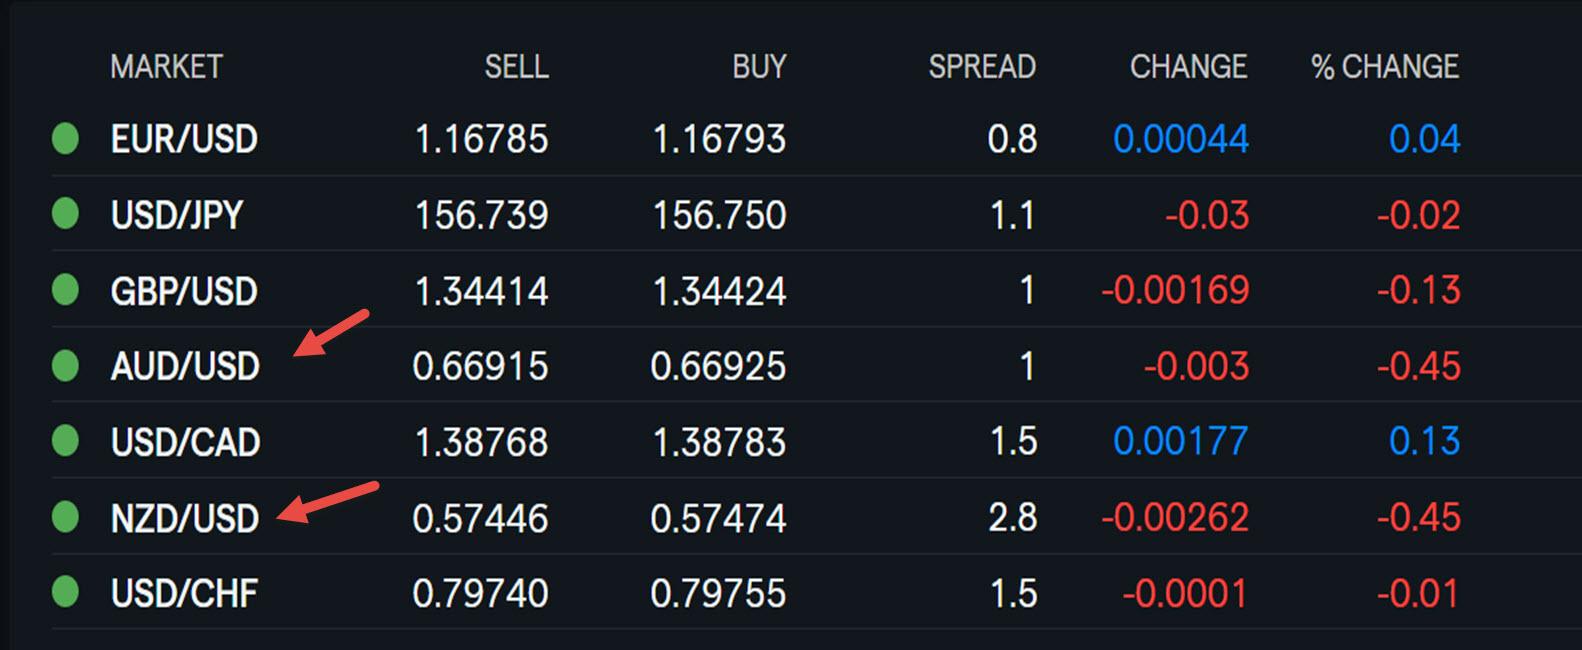
Forex Market Snapshot
- The dollar is trading mixed to firmer with the AUD and NZD underperforming as softer equities (although off the lows) weigh on the currencies.
- GBPUSD is softer (so far breaking a 4 day pivot around 1.35) while EURUSD is close to unchanged (but so far breaking a 3-day pivot around 1.17) as EURGBP has extended its recovery from earlier in the week losses.
- BITCOIN has been a victim of a start of the year whipsaw, testing sub-90K after failing above 94K earlier in the week.
- News flow has been light as markets look ahead to Friday’s US jobs report and whether the Supreme Court will announce its opinions on the legality of Trump tariffs.
 January 6, 2026 at 6:46 pm #35073
In reply to: Forex Forum
January 5, 2026 at 5:26 pm #35037In reply to: Forex Forum
January 4, 2026 at 11:38 am #34993In reply to: Forex Forum
January 2, 2026 at 1:29 pm #34962In reply to: Forex Forum
Bitcoin Price Analysis: BTC Targets $90K Again – Breakout Incoming or Another Rejection?
Bitcoin continues to grind sideways below the $90K level, showing signs of compression after weeks of chop. While there has been no significant bullish breakout yet, the price is pressing against key local resistances. Buyers are trying to reclaim control, but the lack of follow-through makes this a pivotal area to watch.Bitcoin Price Analysis: The Daily Chart
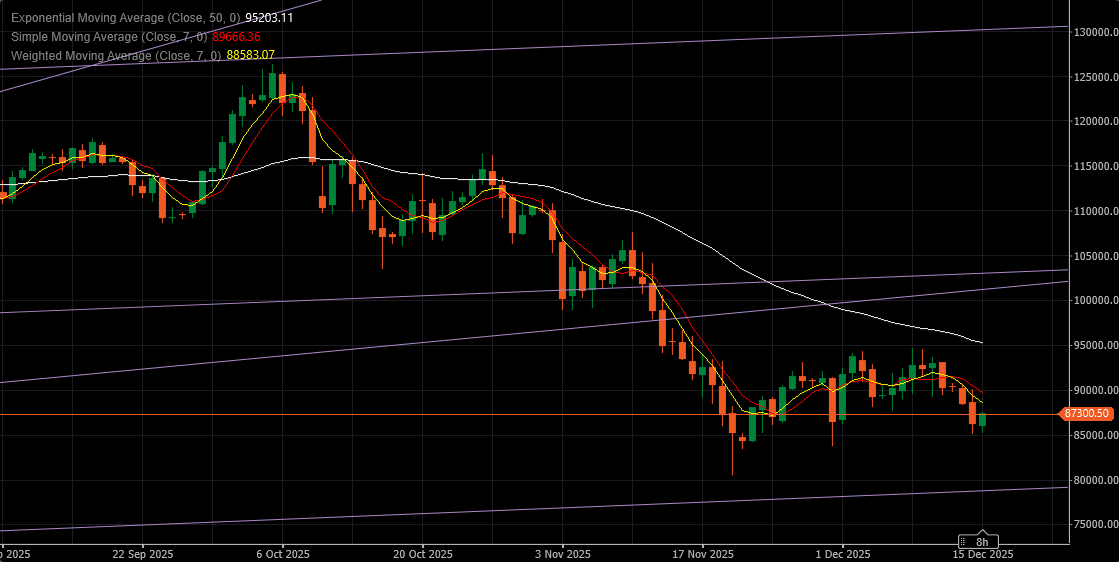
On the daily chart, BTC remains trapped within a descending channel, testing the upper boundary once again near the critical $90K level. The 100-day and 200-day moving averages located above $95K act as major dynamic resistance levels, and buyers have yet to reclaim them.
Despite recent bounce attempts, momentum has been fading. RSI is climbing but is still around the neutral territory, indicating that there is room for a move higher. If buyers fail to break above the $90K zone and the higher boundary of the channel, another visit to the $80K support zone remains likely. Until that breakout happens, this is still a bearish market structure.
 January 1, 2026 at 2:45 pm #34952
In reply to: Forex Forum
January 1, 2026 at 2:33 pm #34951In reply to: Forex Forum
December 31, 2025 at 11:20 am #34938In reply to: Forex Forum
Markets in 2025: Gold, Goldilocks and the dollar bears
World stocks have added another $15 trillion in market cap
Biggest annual gain for gold since 1979 oil crisis
Treasuries have made modest gains but emerging market bonds have surged
Oil down 17%, bitcoin crashes 30% since October
The dollar’s decline leaves the euro up almost 14% in 2025 and the Swiss franc 14.5% higher.
Reuters
December 26, 2025 at 3:52 pm #34855In reply to: Forex Forum
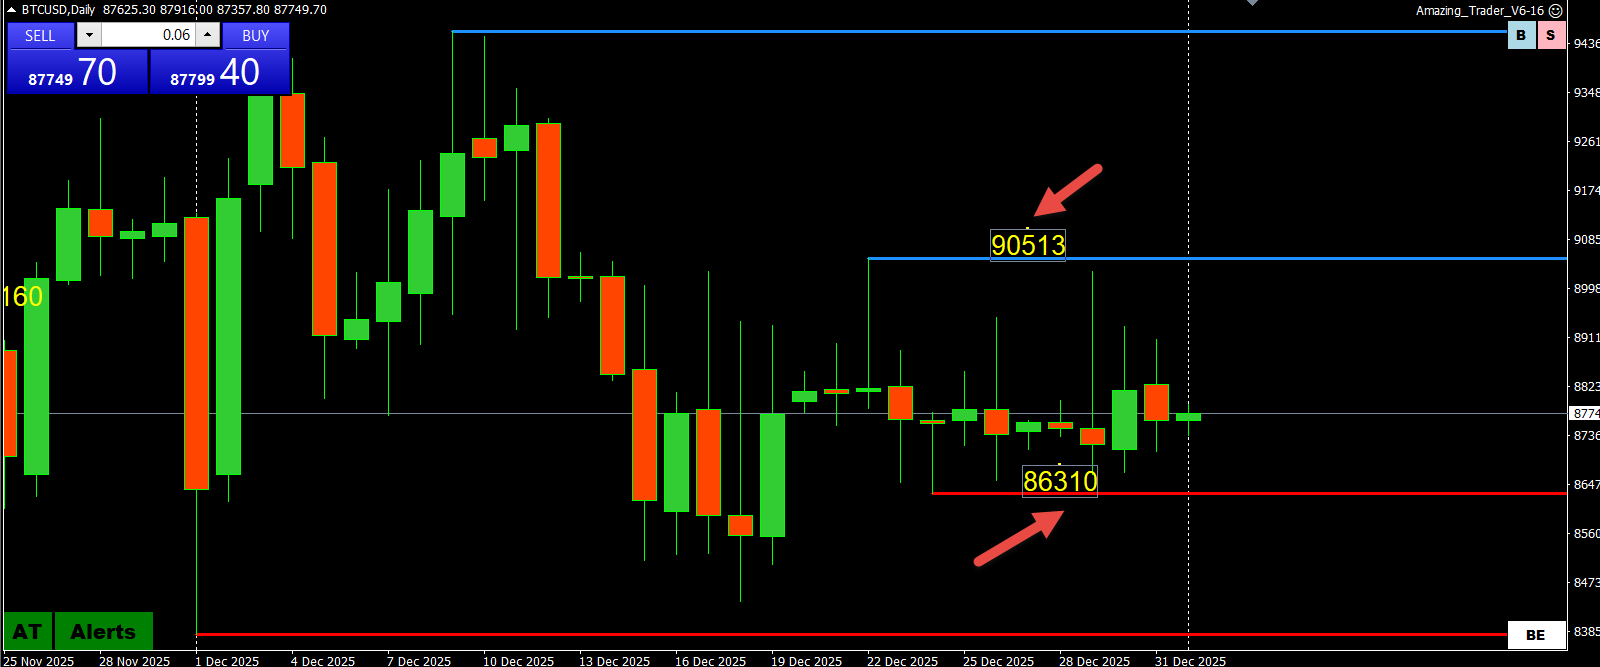
BTCUSD (BITCOIN) UPDATE
- With digital assets taking a back seat to precious metals, BTCUSD continues to struggle building momentum within an 80-95K range, rewarding range traders and frustrating those looking for a breakout.
- It would take a move outside of 83/84K or 90/91K to break the current stalemate.
- Bulls will likely hang in though unless 78-080K is broken.
BTCUSD DAILY CHART
 December 26, 2025 at 10:54 am #34848
In reply to: Forex Forum
Market Update
- With only US markets open but many opting for long holiday weekends or longer, liquidity will be thin and trading volumes light, leaving price action subject to any end of year flows.
- Attention will be on stock markets to see if they can build further momentum for a Santa rally.
- The FX market is quiet with the dollar trading a touch firmer, JPY and GBP currently underperforming.
- Precious metals remain bid with XAUUSD trading 4500+
- BITCOIN is up and trying to join the party but remains below 90K
 December 25, 2025 at 11:19 pm #34847
In reply to: Forex Forum
BITCOIN $87,5xx as I type AND
ahead of tomorrow’s (dec 26) $23.6 billion option expiryLooking at 4hr chart (for example)
– $85K is “support” and
— $90K is “resistance”For potentially high adrenalin tactical trading / reading:
AHEAD of the 23.6 billion option expiry
December 24, 2025 at 3:46 pm #34825In reply to: Forex Forum
Holiday trading in BTC
The cryptocurrency market remains open 24/7 during Christmas, unlike traditional stock exchanges
–
Bitcoin is trading in a narrow range between $85,000 and $90,000 as of December 24, 2025, amid thin holiday liquidity and reduced market activity, with the price currently near $86,935.Despite hopes for a “Santa rally,” the market has been constrained by low trading volumes, ETF outflows, and the looming expiration of a record number of Bitcoin options contracts on Boxing Day (December 26), which could trigger heightened volatility.
— yahoo financeDecember 24, 2025 at 11:21 am #34814In reply to: Forex Forum
December 24, 2025 at 10:19 am #34811In reply to: Forex Forum
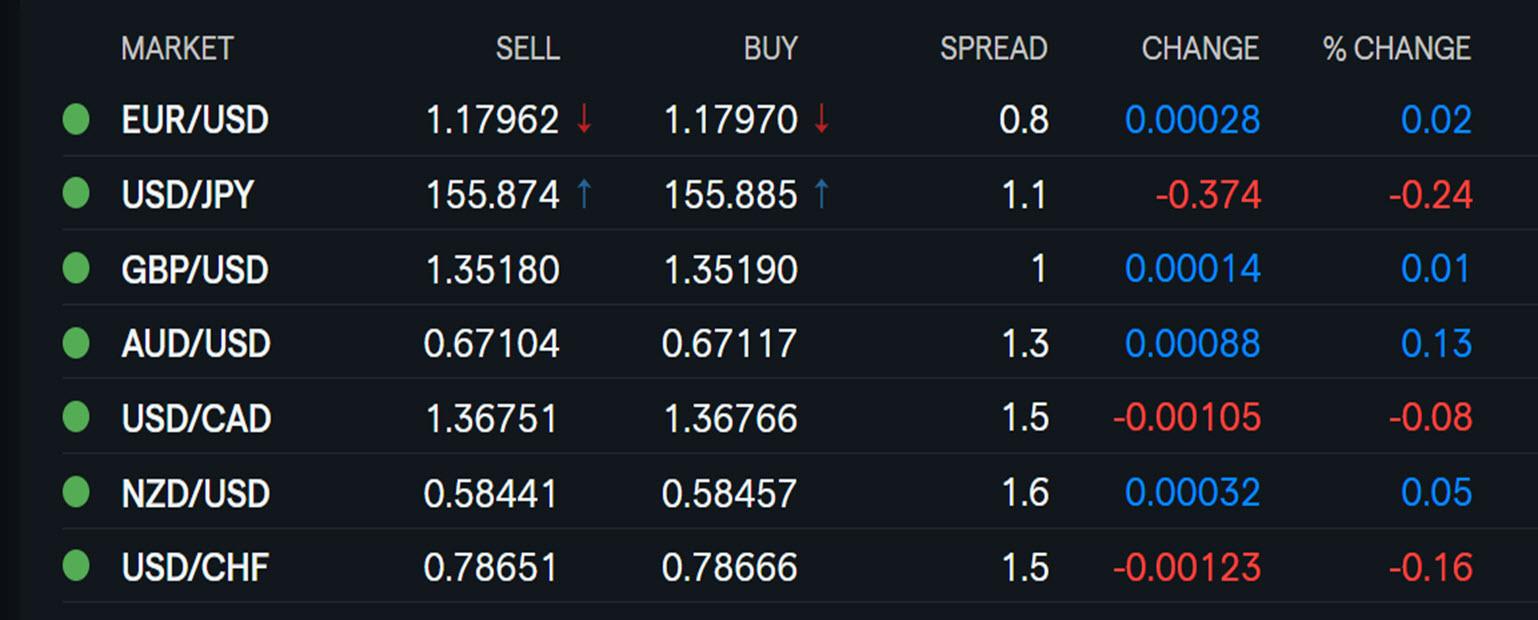
Forex Market Snapshot
It is more about early market closures and the ability to absorb market flows today as liquidity thins ahead of 4 day holidays for most major centers (US and Japan are open on Friday).
- The dollar, meanwhile, remains on the defensive although off its lows
- EURUSD briefly extending its high above 1.18 (high 1.1807), currently trading just below it
- USDJPY extending its low but paused above 155.47 support (low 155.55)
- GBPUSD trading bid while above 1.35
- EURGBP retested key .8720 support for a 2nd day and a double bottom
- US stocks have so far traded a cautious session
- XAUUSD extended its high through 4500 before backing down below it
- Bitcoin continues to drift lower and not join the party
- Data focus: US weekly jobless claims
 December 20, 2025 at 10:44 am #34714
In reply to: Forex Forum
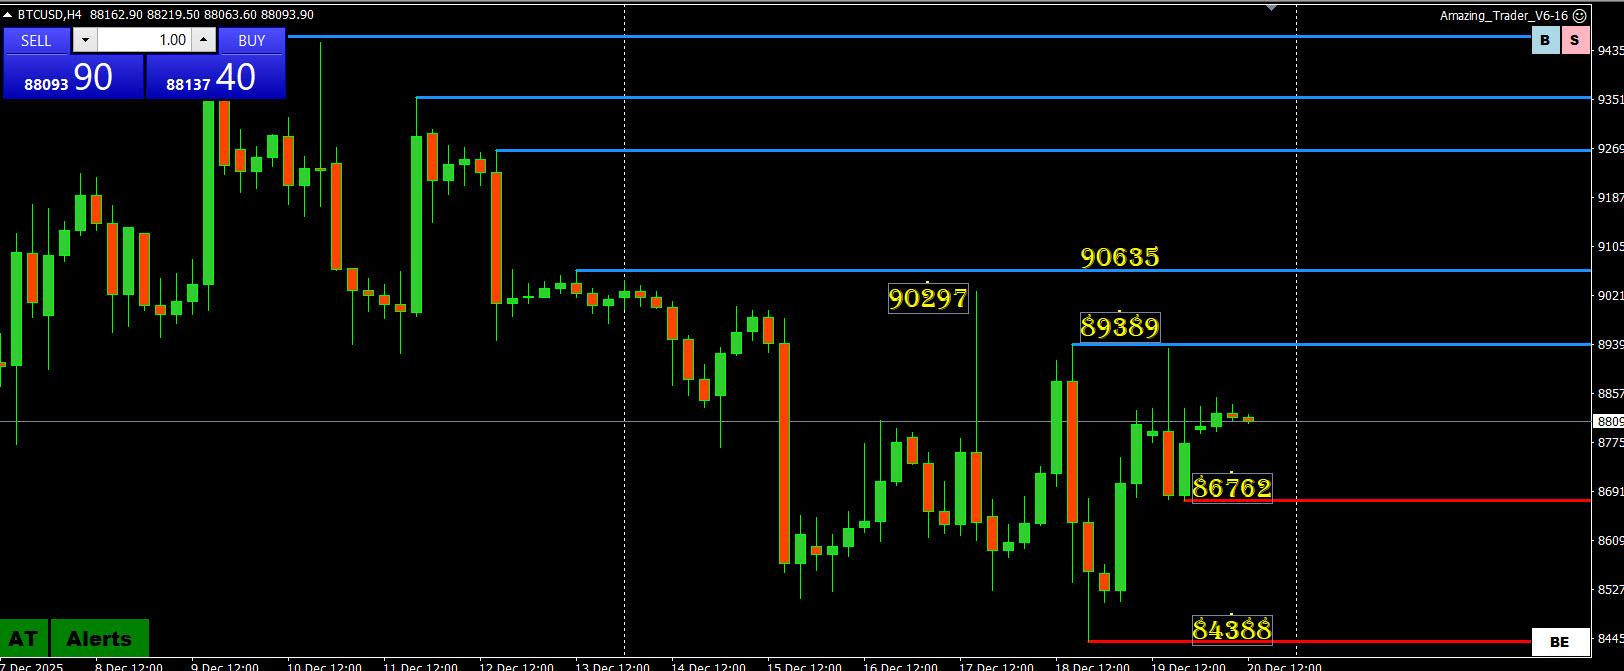
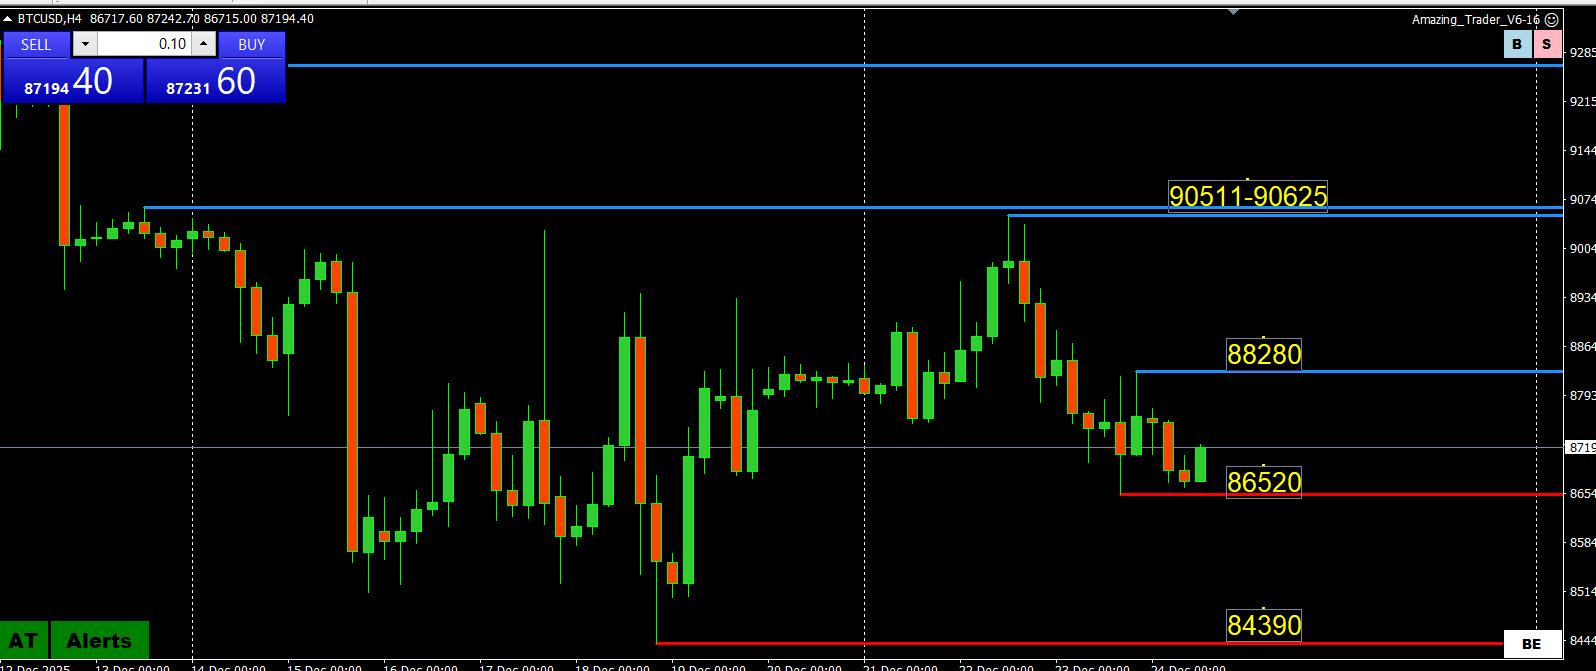
BTCUSD (BITCOIN) UPDATE
Fine tuning chart levels is a challenge given the intra-day volatility and I prefer to look for signs of momentum to pick the side to trade.
Chart levels:
-
- Supports: 86762, 84388
- Resistance: 89389, 90287, 90635
Chart pattern:
- 2 red support lines has potential to turn it into an uptrend if 86762 becomeS support followed by a 90297/90635 break.
- Otherwise, expect more chop as long as it trades within an 84/85-90/91 range,
BTCUSD 4 HOUR CHART
 December 19, 2025 at 1:46 pm #34687
In reply to: Forex Forum
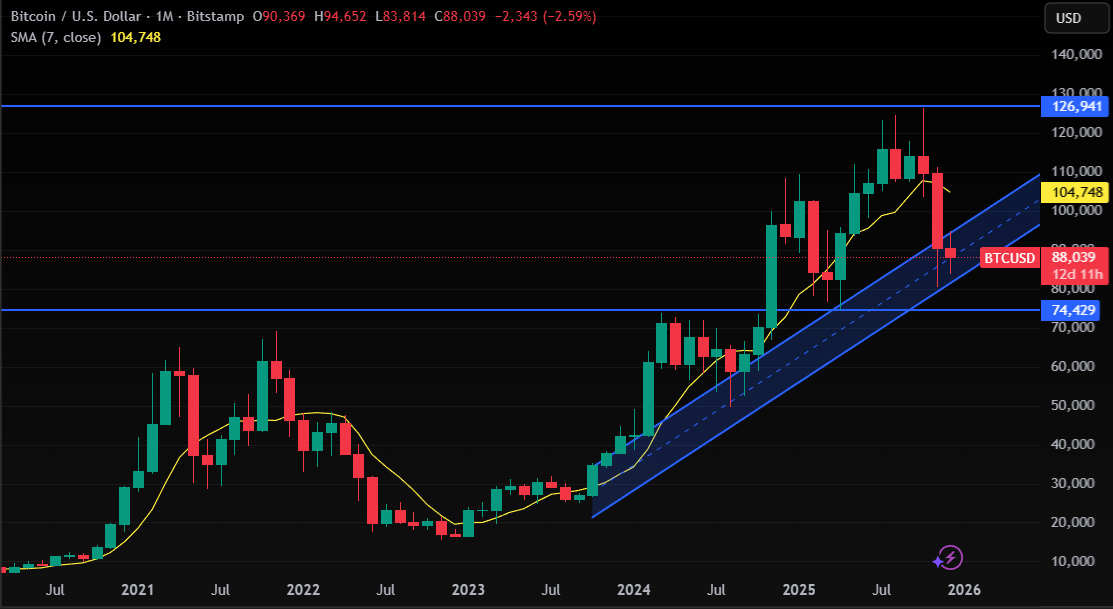
Bitcoin will climb to $143,000, according to this Wall Street forecast
Bitcoin is forecast by Citi to reach $143,000 next year.
Bitcoin will rally to $143,000 next year as investors continue to increase digital asset adoption through exchange-traded funds, according to a new Wall Street forecast.
Analysts at Citi said the $143,000 level is their base case for bitcoin’s price, with a bull model north of $189,000 and a bear estimate of around $78,500.
Bitcoin (BTCUSD) on Friday was trading around $89,000 – down about 30% from its late October peak.
 December 18, 2025 at 5:22 pm #34659
In reply to: Forex Forum
Market Update
A friend just sent me this: As time keeps running out into year end, I suspect techs are going to become less reliable and trading will see more bouts of failed momentum as players will be lurking to bag profits or minimize/null losses.
Update
- US stocks took a sudden hit, no news behind it
- GOLD following lower after failing to reach 4380
- Dollar catching a bid but within day’s ranges
- BITCOIN slammed as risk mood turns, shifting focus back to 85K
- US bond yields off the post-CPI lows but still down on the day
 December 18, 2025 at 3:44 pm #34655
In reply to: Forex Forum
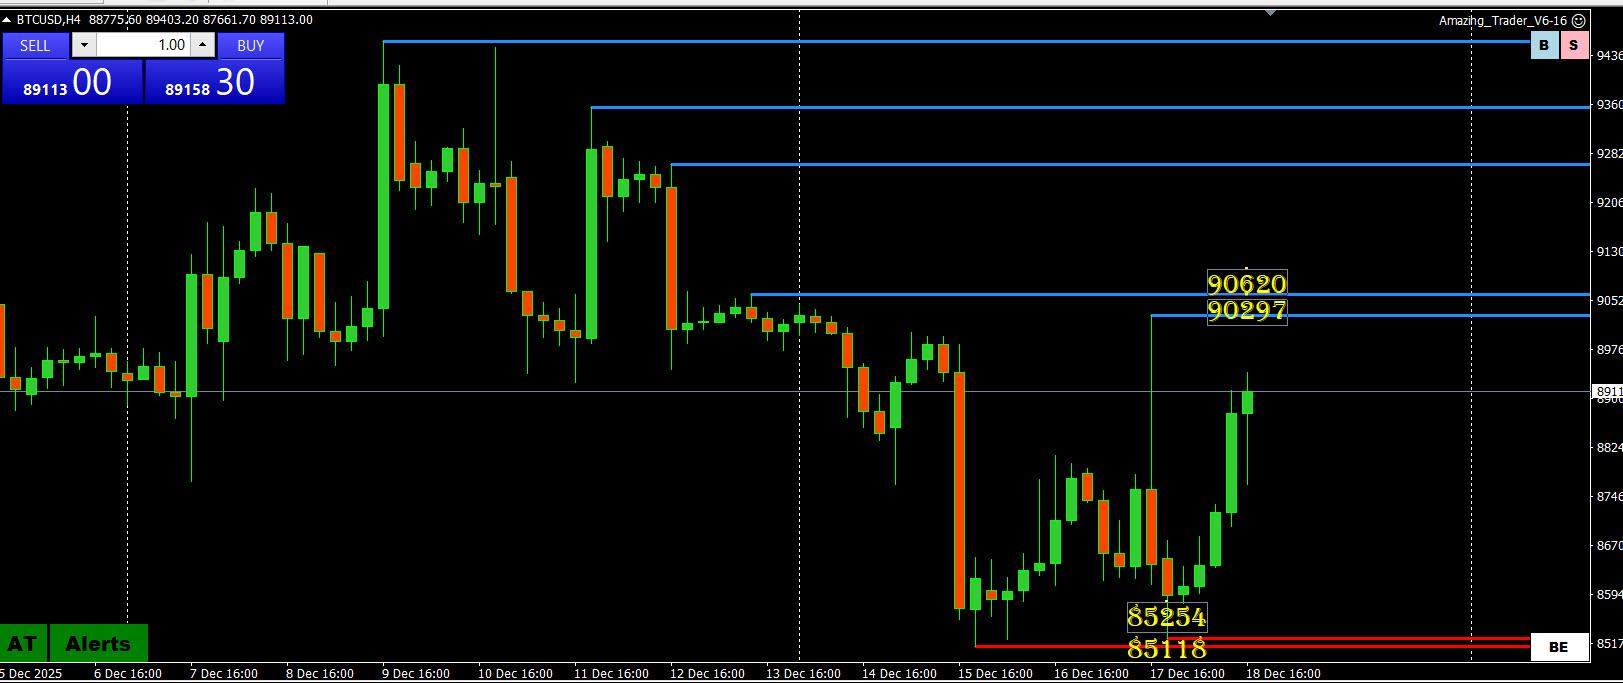
BTCUSD (BITCOIN) UPDATE
- Was the spike to 90270 yesterday (and just as quick reversal) a phantom move, an indication of thin liquidity or something more significant?
- In any case, it is a key level on a chart along with 90620, firm breaks of which would negate the downside risk and shift it to the upside.
- Below 90K keeps the range to 85K
- Note the correlation with the rebound in stocks, especially with the NAS100..
BTCUSD 4 HOUR CHART
 December 18, 2025 at 12:20 pm #34635
In reply to: Forex Forum
Is Bitcoin Carnage Tomorrow? ‘Quad Witch’ Phenomenon
“Quad witching,” one of the most structurally risky days on the calendar, is approaching for Bitcoin. Neither superstition nor X numerology apply here. The price movement of Bitcoin has already been significantly impacted by this recurrent, derivatives-driven event this year.
Bitcoin’s time coming
Four times a year, in March, June, September and December, stock index futures, stock index options, single-stock options and index options all expire simultaneously. This phenomenon is known as quad witching. This corresponds with large BTC options and futures expiries in the cryptocurrency space.
Take a look at the figures. Bitcoin saw a 16.6% decline in March. It dropped an additional 8.5% in June. September’s percentage was 7.9%. The same timing, but different market conditions. Every sell-off was in close alignment with quad witching expiries. That is a forced resolution of positioning, not a coincidence.
 December 17, 2025 at 4:50 pm #34616
In reply to: Forex Forum
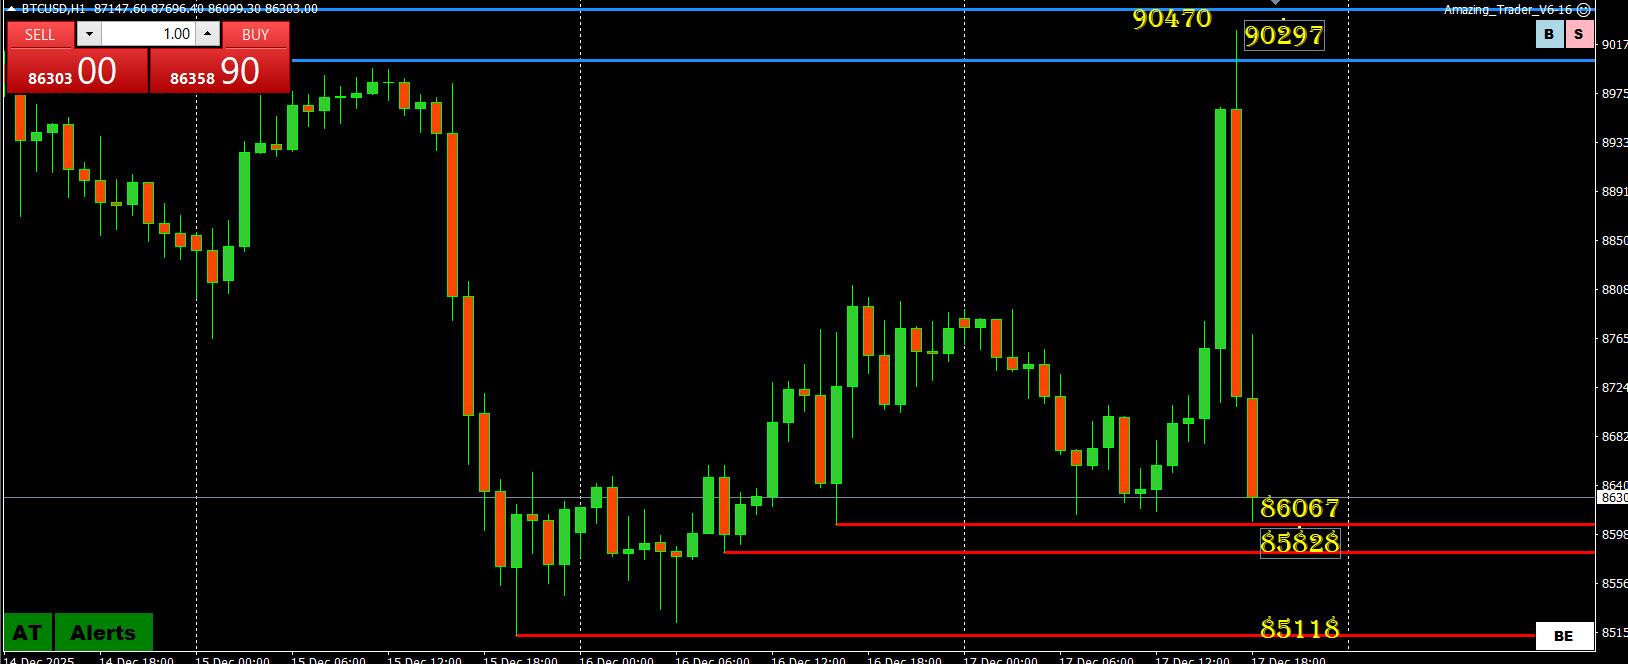
BTCUSD (BITCOIN) UPDATE
- I am not sure what to say about something that moves up 4.5% and down 4.5% in 2 one hour candles so let the chart do the talking. I could also say this is a good example of when a stop is not a stop.
- What chart shows though is 90k is the key on top an 85-86K needs to hold to contain the downside.
BTCUSD 1 HOUR CHART
 December 16, 2025 at 1:23 pm #34547
In reply to: Forex Forum
December 16, 2025 at 10:56 am #34531In reply to: Forex Forum
December 15, 2025 at 11:58 pm #34524In reply to: Forex Forum
December 15, 2025 at 4:28 pm #34505In reply to: Forex Forum
December 14, 2025 at 12:30 pm #34462In reply to: Forex Forum
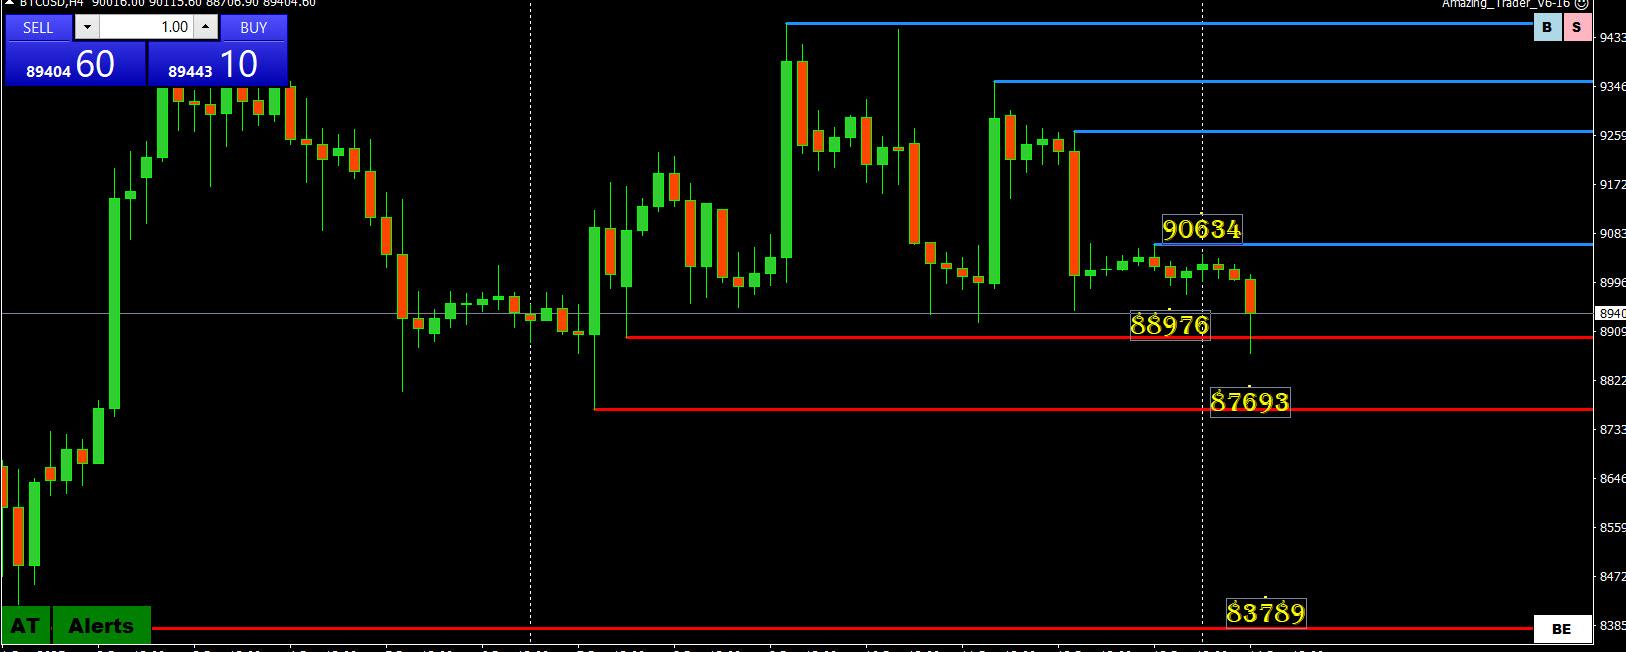
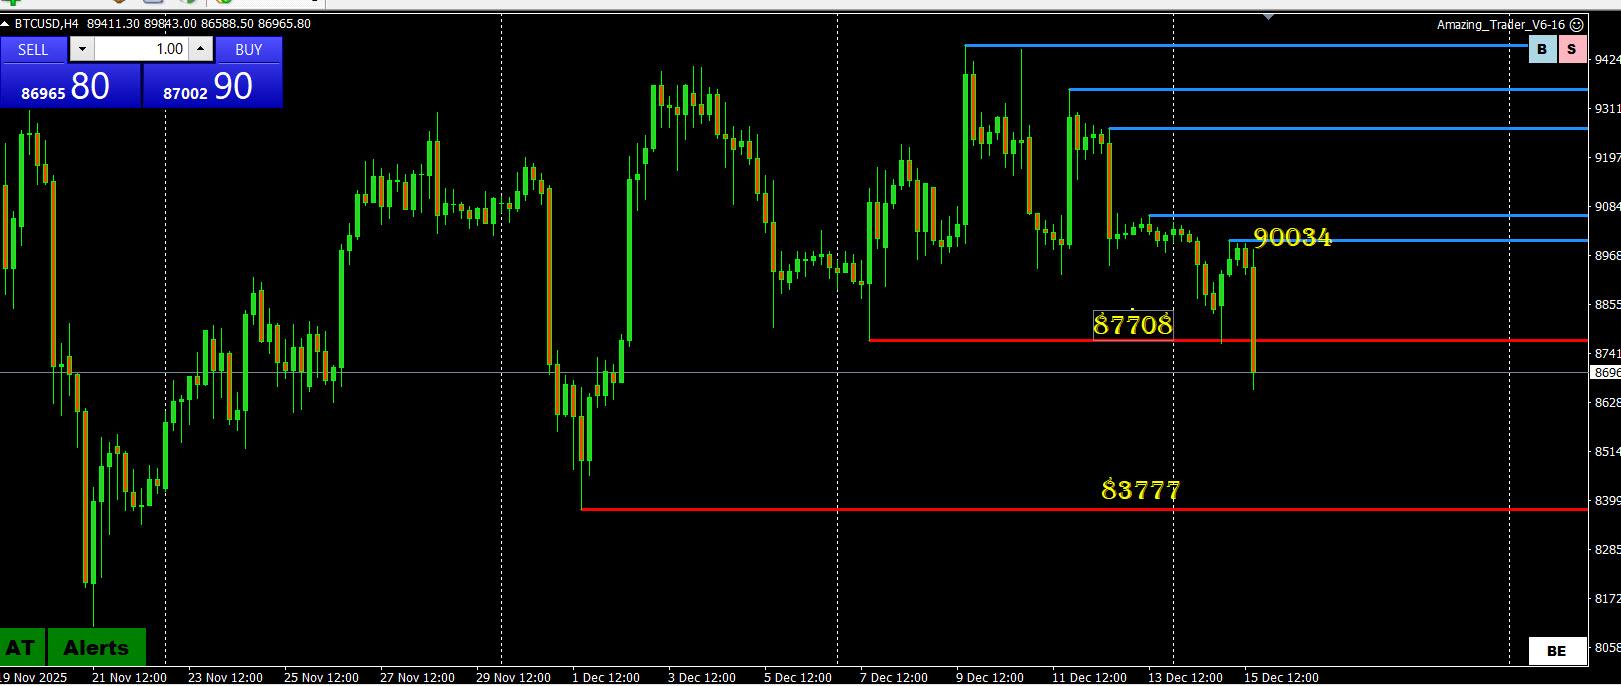
BTCUSD (BITCOIN) UPDATE
- It’s hard to draw conclusions from crypto moves during a weekend but given the way BTCUSD is correlating with risk (especially the NAS), the move back below 90K (and brief break of 89K) will put equity market traders on alert.
- While 87693 is chart support, I prefer to use 88K as firmly below it would open the door on the downside where 80-84K is the key support zone.
- Back above 90K is needed to cool the risk.
BTCUSD 4 HOUR CHART
 December 13, 2025 at 8:18 pm #34461
In reply to: Forex Forum
-
AuthorSearch Results



Search
© 2024 Global View