
- This topic has 27,907 replies, 54 voices, and was last updated 14 hours, 55 minutes ago by Mtl JP.
-
AuthorPosts
-
September 25, 2024 at 8:48 am #12036
I have been scanning the news looking for reasons for the bounce in USDJPY back to 144
I have so far come up empty but this caught my eye
The COT (futures) report showed a huge drop in long positions, which explains some of the recent USDJPY support
Open interest fell -47%, fastest weekly pace on record
177k contracts closed
Open interest at 376.5k contracts in the prior week was its second highest level on record
The Commitment of Traders (COT) report is a weekly market report that summarizes the holdings of participants in the US futures market. The Commodity Futures Trading Commission (CFTC) publishes the report every Friday at 3:30 PM Eastern Time, and it covers the previous Tuesday’s trading day.
(AI Overview)
September 25, 2024 at 8:48 am #12035I have been scanning the news looking for reasons for the bounce in USDJPY back to 144
I have so far come up empty but this caught my eye
The COT (futures) report showed a huge drop in long positions, which explains some of USSDJPY support
Open interest fell -47%, fastest weekly pace on record
The -177k contracts closed
Open interest at 376.5k contracts in the prior week prior was its second highest level on record
September 24, 2024 at 11:47 pm #12034The forex market is largely controlled by interest rates. In fact, the interest rate is generally the single most important factor when it comes to determining the value of that specific currency. Investors will constantly look at how the interest rate on one currency compares to another, and they will use this information to take action in the markets.
Interest Rates and Why they Matter to Forex Traders
 September 24, 2024 at 9:13 pm #12033September 24, 2024 at 8:11 pm #12032September 24, 2024 at 7:17 pm #12031September 24, 2024 at 7:04 pm #12030
When I mention price/value magnets these are either reoccurring values or range related values of importance to large firms. You won’t find that with an Macd it comes from experience in banking (Jay of GVI) or as a CTA. With Yen much of that is import/export related entities, especially in the Asian session. UsdJpy 143.20 and 142.90 are medium term cycle magnets. If the latter is definitively compromised then look out below. If it holds we see likely see 146 in time.
September 24, 2024 at 6:53 pm #12029September 24, 2024 at 6:26 pm #12028September 24, 2024 at 6:20 pm #12027XAUUSD 4 HOUR CHART – Another day, another record high
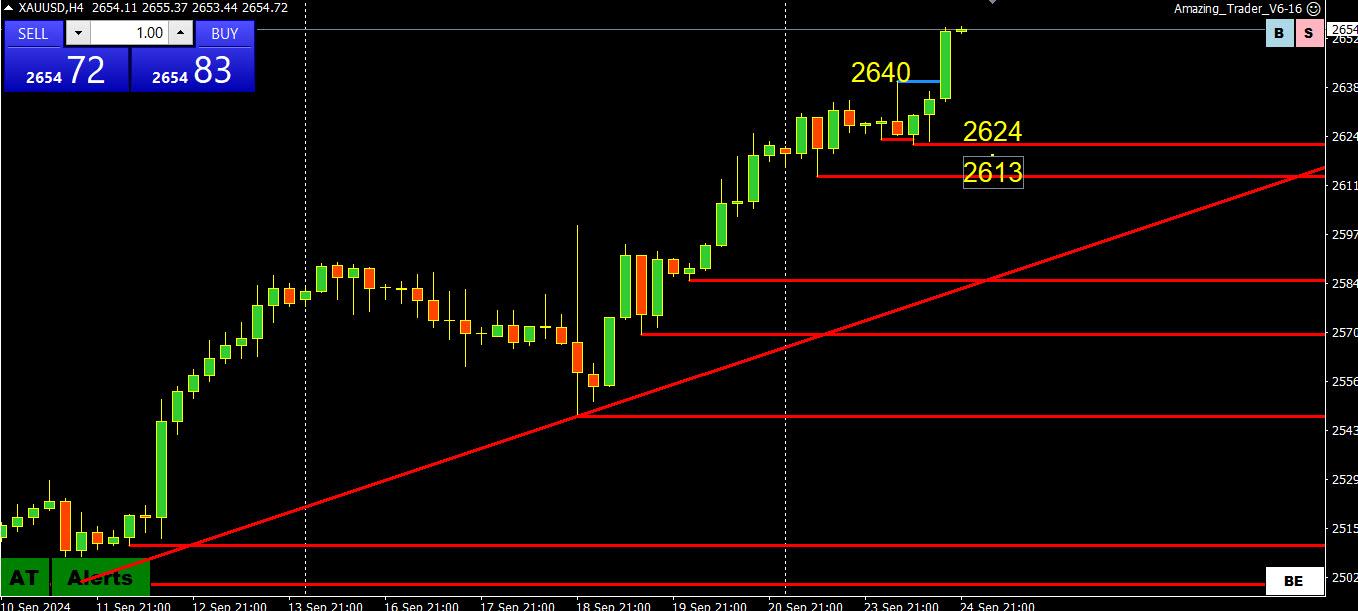
With another record high day, there is no change to:
When in unchartered record territory, resistance is only a guess so use the latest high as the only level that matters,
Otherwise, look for a strong bid if it stays above 2640, scaled down buy interest as long as it trades above 2600.
To suggest a pause, it would need a day without a new high.
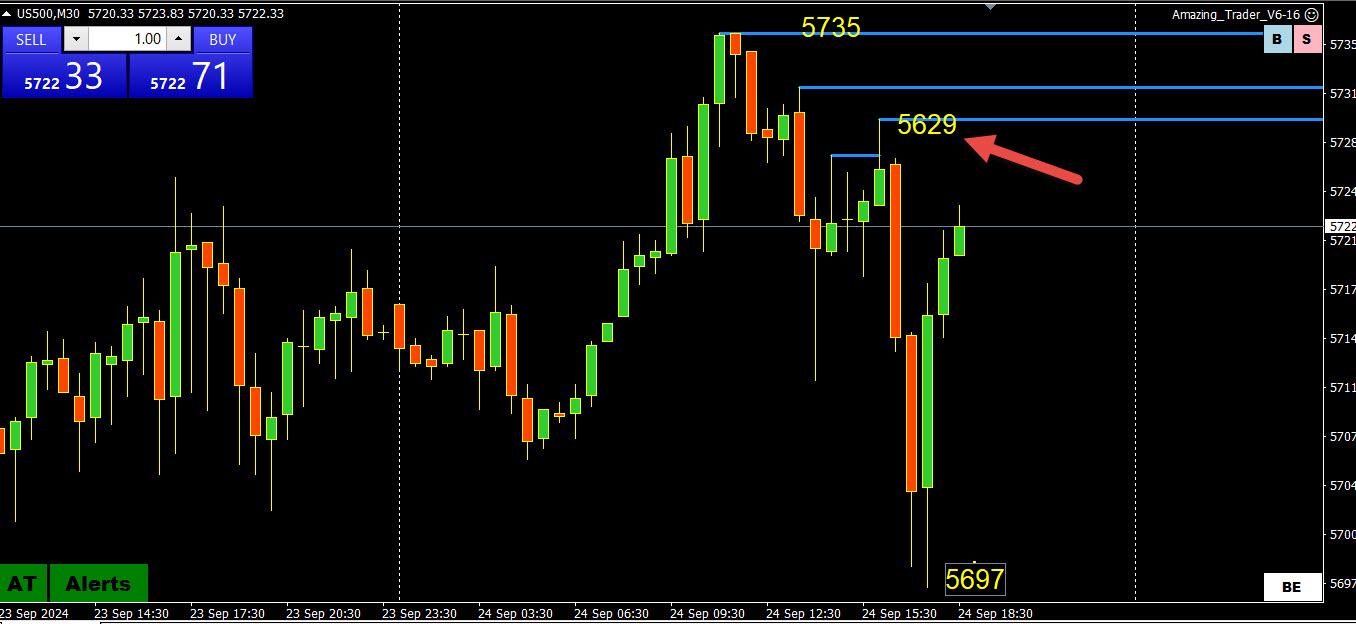
September 24, 2024 at 6:15 pm #12026US500 4 HOUR CHART – RESISTANCE?
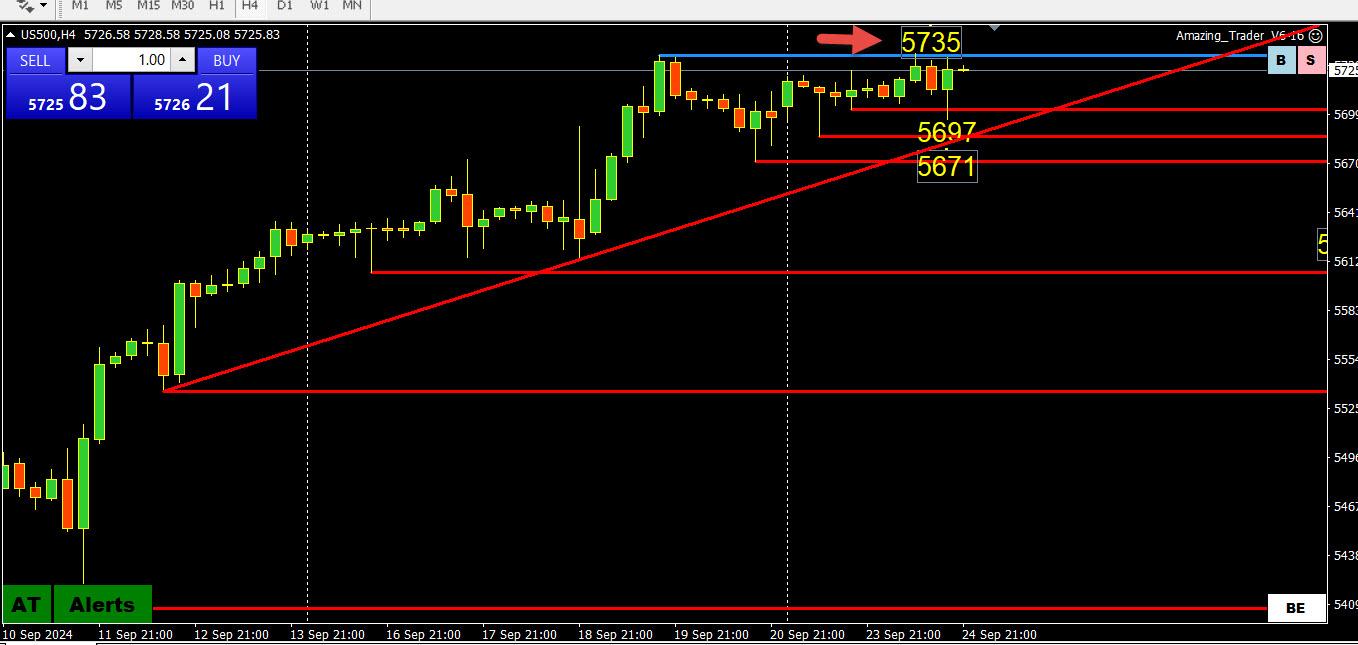
Note that CFD price feeds can differ between broker, even those using the same symbol. Ss, look at the chart pattern if the levels below do not line up with the prices on your chart.
US500 ran into resistance at yesterday’s record high (5735 on this chart).
As I have said, there is no reason to guess at a top when in record high territory but it pays to keep an eye on the high to see if it holds.
Supports 5697, 5671
Resistance, 5735, ?
September 24, 2024 at 5:04 pm #12025September 24, 2024 at 4:59 pm #12024September 24, 2024 at 4:12 pm #12021I use a very cycle driven algorithm model. In that model for UsdJpy the key areas are 143.10 and 144.10 (ironically) at present. 143.60 is the price magnet (at present) and is right in the middle.
I sold 143.80, I bought 143.55 and then sold 143.69. Already out of the sell but if I see 143.40 break I will likely jump on it for 143.
September 24, 2024 at 4:01 pm #12019September 24, 2024 at 3:55 pm #12018September 24, 2024 at 3:52 pm #12017September 24, 2024 at 3:38 pm #12016September 24, 2024 at 3:14 pm #12015September 24, 2024 at 3:07 pm #12014September 24, 2024 at 2:59 pm #12013September 24, 2024 at 2:58 pm #12012September 24, 2024 at 2:44 pm #12011DX 100.50 is a long standing value magnet in my model in recent times and the post data price activity bounced right off of it. Forwards and other components are decidedly negative UsdJpy and so if that area is compromised and holds it is curtains for that pair. If not it will likely see 100.90 in coming days.
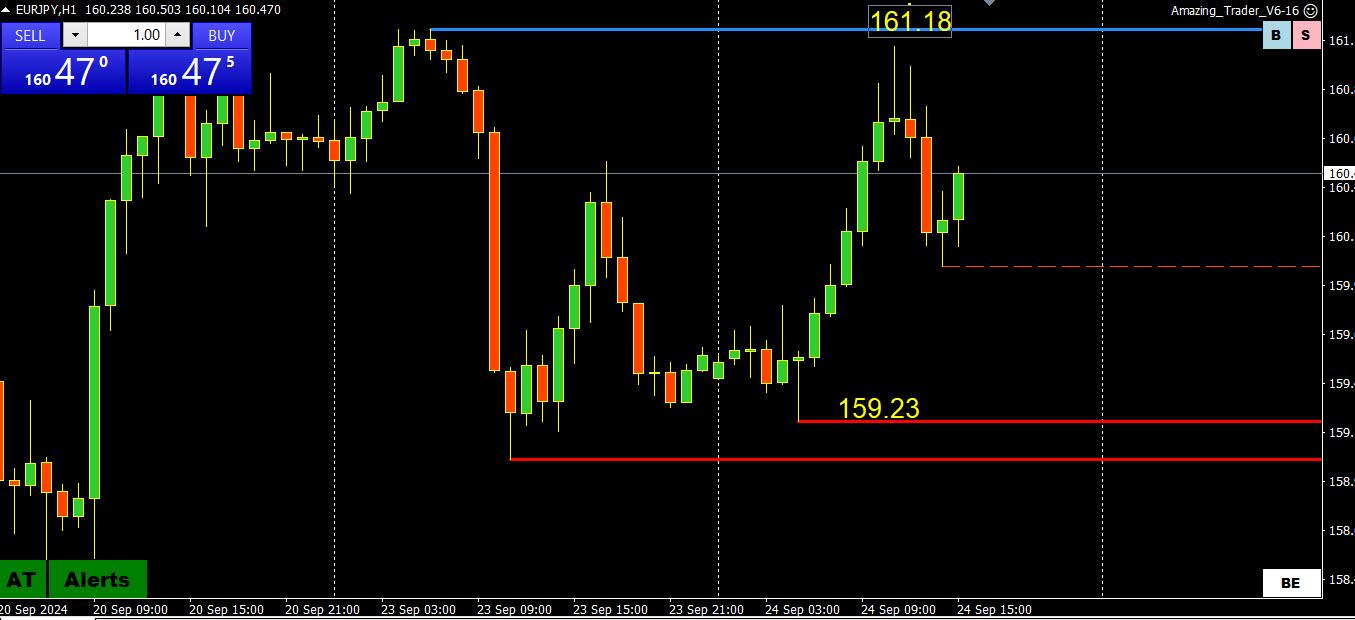
September 24, 2024 at 2:33 pm #12010September 24, 2024 at 2:05 pm #12009September 24, 2024 at 1:48 pm #12008September 24, 2024 at 1:07 pm #12007September 24, 2024 at 12:43 pm #12006September 24, 2024 at 12:30 pm #12005September 24, 2024 at 12:21 pm #12004EurJpy 161.40 has been an ongoing value magnet in my view and one where I have keyed positions on when price activity returns there after being active at other levels. Price failed to breach it 3 times now since Friday after pulling up from lows. As a standalone, the pattern of participation is forming what usually amounts to a breakout uphill from there toward 163. But that is only a pattern, albeit an ongoing and repetitive pattern across currencies. If not it looks like it might head for 158.
-
AuthorPosts
- You must be logged in to reply to this topic.
Search
© 2024 Global View