
- This topic has 27,907 replies, 54 voices, and was last updated 15 hours, 51 minutes ago by Mtl JP.
-
AuthorPosts
-
September 25, 2024 at 6:03 pm #12078
BTC 4 HOUR CHART – Stuck in a rut
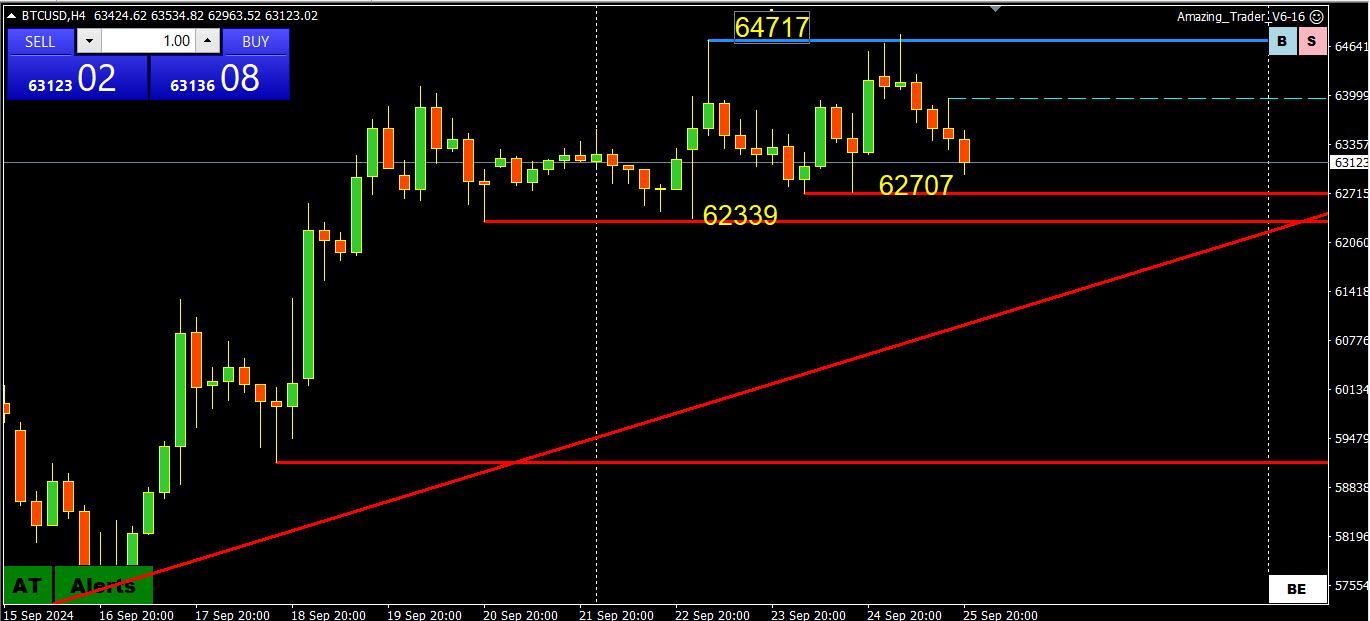
BTC remains stuck in 60-65K as it continues to trade sideways in a range. Given its history, the range is too tight to last for long but while within it expect more chop.
Looking at this chart, you have seen me mention my Amazing Trader charting algo, which even with a volatile crypto, forms patterns and levels (see the bounce off resistance) that can be used to trade.
September 25, 2024 at 5:59 pm #12077September 25, 2024 at 5:54 pm #12076September 25, 2024 at 5:51 pm #12075XAUUSD 4 HOUR CHART – Another record high
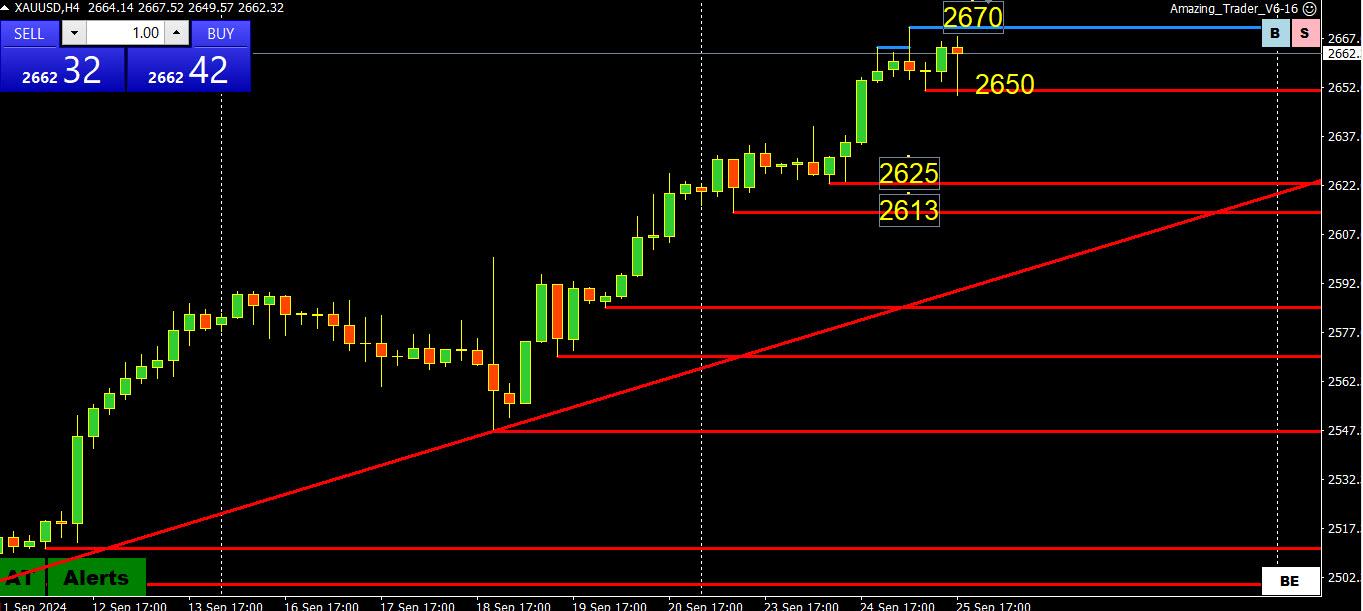
With another record high (2670), there is no change to what I have been saying
When in unchartered record territory, resistance is only a guess so use the latest record high as the only level that matters,
For day trading, watch 2650 as a pivotal (bias setting) level.
However, to suggest a pause, it would need a day without a new high.
September 25, 2024 at 3:56 pm #12074AUDUSD 4 HOUR CHART – FAILURE?
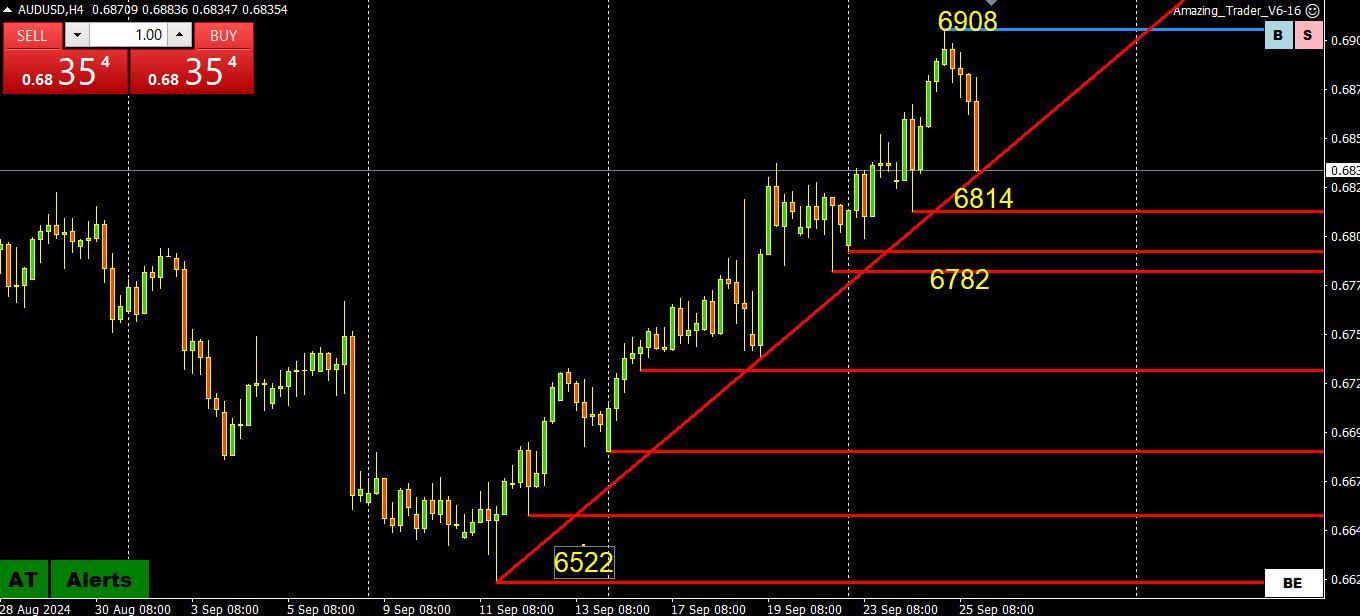
When we talk about failure, AUDUSD failed to sustain the break of .6899.
Now it is dependent on the trendline and .6814 holding (and .6782-00 as well) or momentum will be broken and the last leg up negated..
In any case, the deck is cleared of buy stops unless 6908 is broken.
September 25, 2024 at 3:39 pm #12073Global debt just reached $312 Trillion. The US is putting up $1 Trillion in debt every 100 days since, not saying anything, 2021. One might think with such out of control spending and more to come if Harris is elected that the top executives in every industry there is are hedging against that right now? A perennial icon in executive attitude surveys (not to be named here) indicates the vast majority favor the sell side of stocks worldwide if Harris becomes President. At an aggressive level. The reverse for Trump. Not making a political statement, just stating facts. Food for thought.
September 25, 2024 at 3:21 pm #12068September 25, 2024 at 3:19 pm #12066September 25, 2024 at 2:57 pm #12065September 25, 2024 at 2:17 pm #12061September 25, 2024 at 2:17 pm #12060September 25, 2024 at 2:10 pm #12059September 25, 2024 at 1:32 pm #12056September 25, 2024 at 1:31 pm #12055September 25, 2024 at 1:19 pm #12054September 25, 2024 at 1:11 pm #12053September 25, 2024 at 1:06 pm #12052EURUSD 5 MINUTE CHART – WHY I LOVE THE AMAZING TRADER
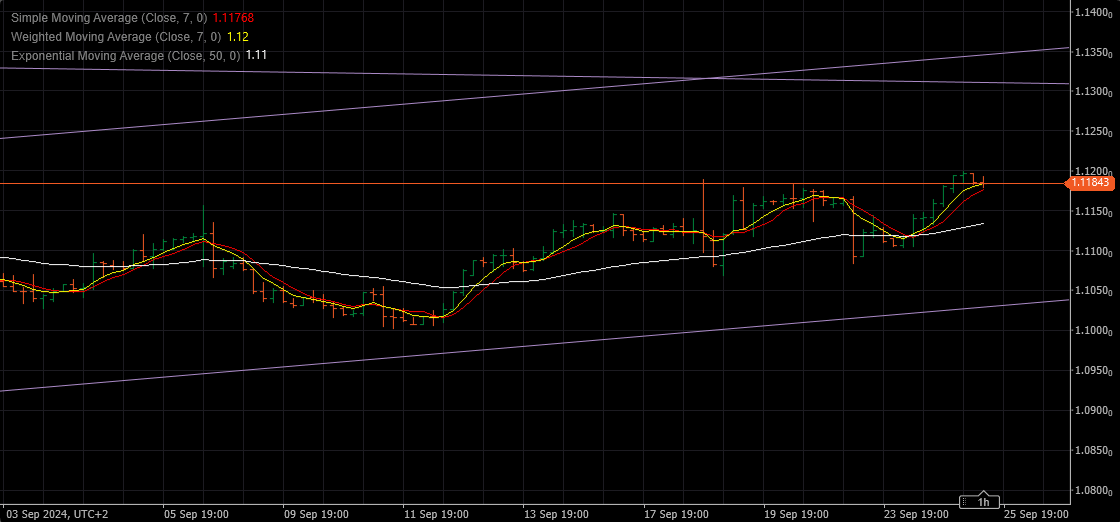
Look at the bounce off AT support at 1.11918… this is no coincidence…why it is called “Amazing”… same support on a 15 minute chart
 September 25, 2024 at 12:49 pm #12051September 25, 2024 at 12:46 pm #12050September 25, 2024 at 12:41 pm #12049September 25, 2024 at 12:36 pm #12048
Case in point on market internals – Yields opened up strongly moments ago but immediately began pulling back which carried over to UsdJpy seeing a sudden, albeit small shot downhill. I would pay attention to those internals today, which are mixed with a slight tint to the downside in the pair. Again, however, the geopolitical element today should have stocks apprehensive and buoy USD unless it becomes dramatic and we see safe haven flows into CHF and such.
September 25, 2024 at 12:12 pm #12046UsdJpy remains dominant on the buy side until 143.95 is compromised definitively. Why not just 143? This time, only this time, my cycle oriented system simply has that number this time. It is not stagnant. Entering the US day stock markets are apprehensive with the geopolitical turmoil and rightfully so. What could change that? Either some significant development or global markets simply revisiting the rate reduction effect in my view. Right now some components behind the scenes are negative Dollar so entirely possible. Yesterday they were decidedly positive but there was a delay in those orders filling through the market, which caused UsdJpy to run uphill overnight.
September 25, 2024 at 12:01 pm #12045September 25, 2024 at 11:30 am #12044September 25, 2024 at 11:09 am #12043September 25, 2024 at 11:02 am #12042A look at the day ahead in U.S. and global markets from Mike Dolan
The unexpected downturn in U.S. household confidence this month and growing anxiety about jobs has spurred aggressive interest rate cut bets anew – dragging Treasury yields, the dollar and stock futures lower into Wednesday’s open.
Morning Bid: US confidence wobble weighs, China buoyedSeptember 25, 2024 at 10:21 am #12041USDJPY WEEKLY CHART
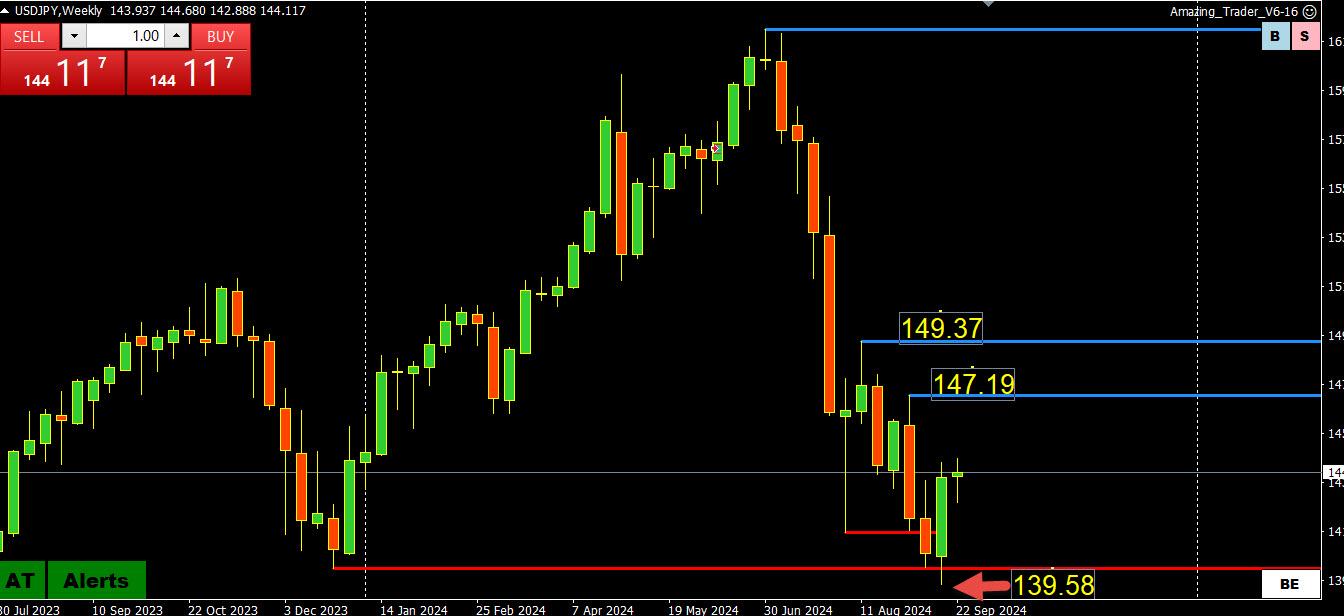
Let’s take a look at what technical traders are looking at.
Last week was an outside week and close to an outside week key reversal although I was told many years ago that it doesn’t work well with currencies.
I just took a look at a broker’s sentiment and it shows 50% of trader positions are short USDJPY.
So, looking at the COT report as well, short USDJPY positions no longer look extended so it might take a move outside of 140-145 to expose key levels.
In any case, this can still be considered a retracement phase with FIBOS for 161.93-139.58 shown below
 September 25, 2024 at 9:47 am #12039
EURGBP 4 HOUR CHART – BOUNCE FROM MULTI-YEAR LOW
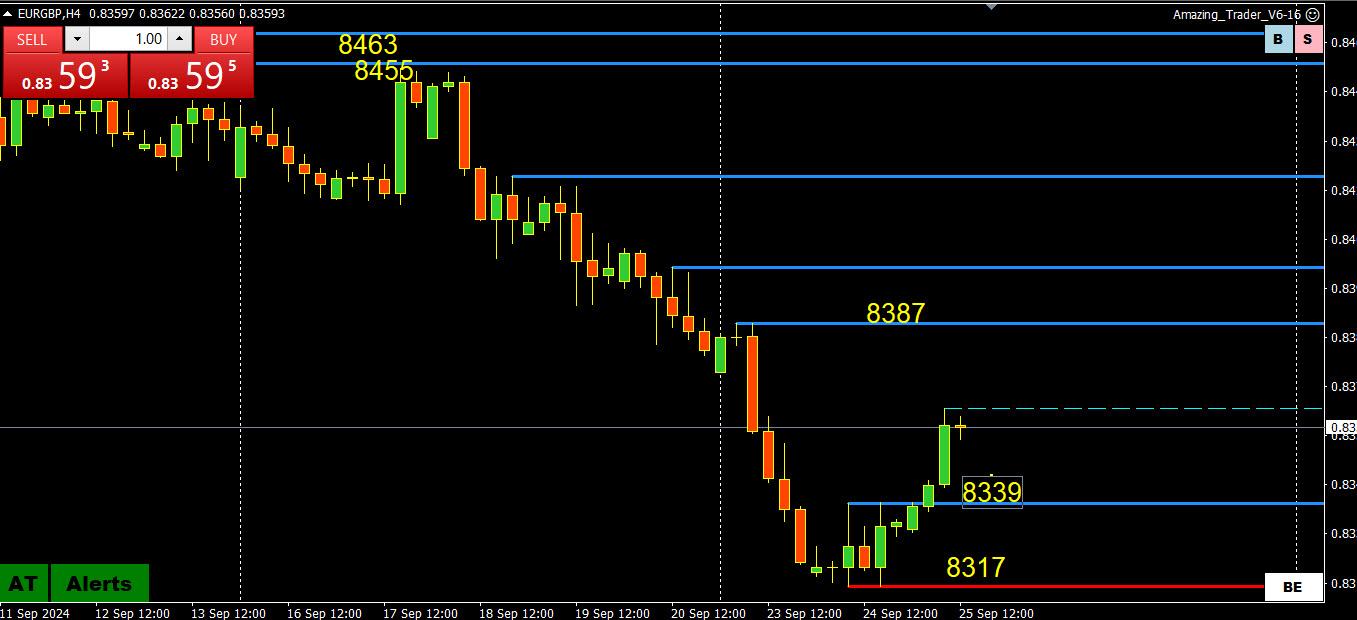
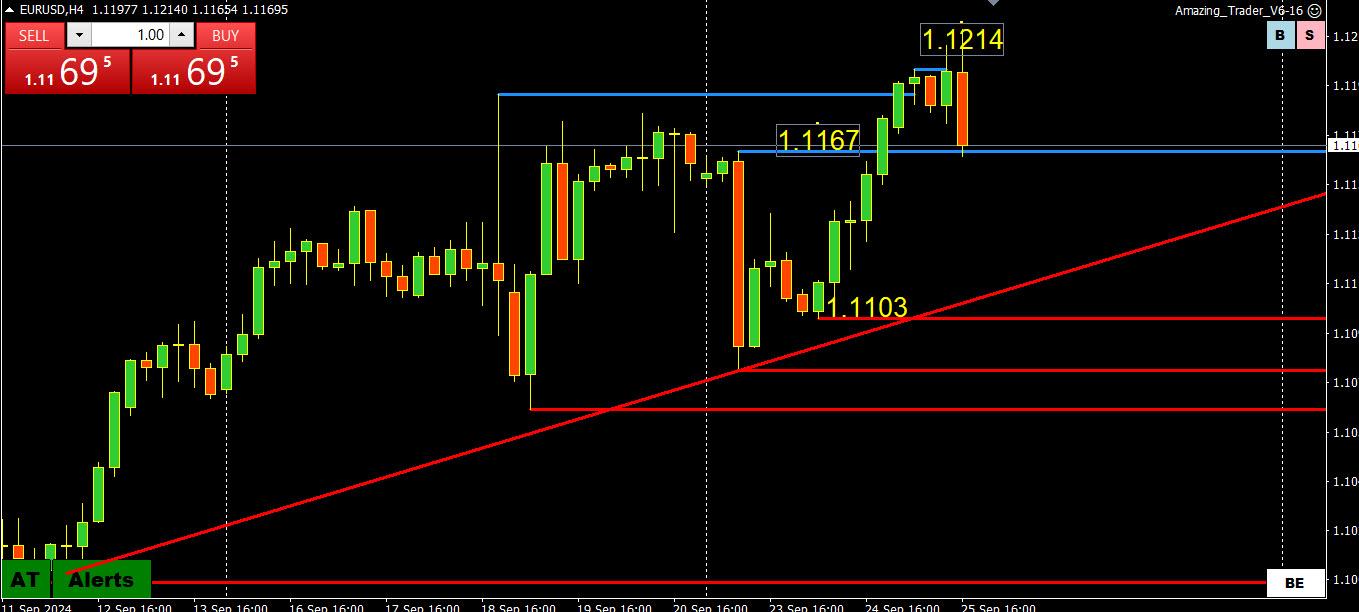
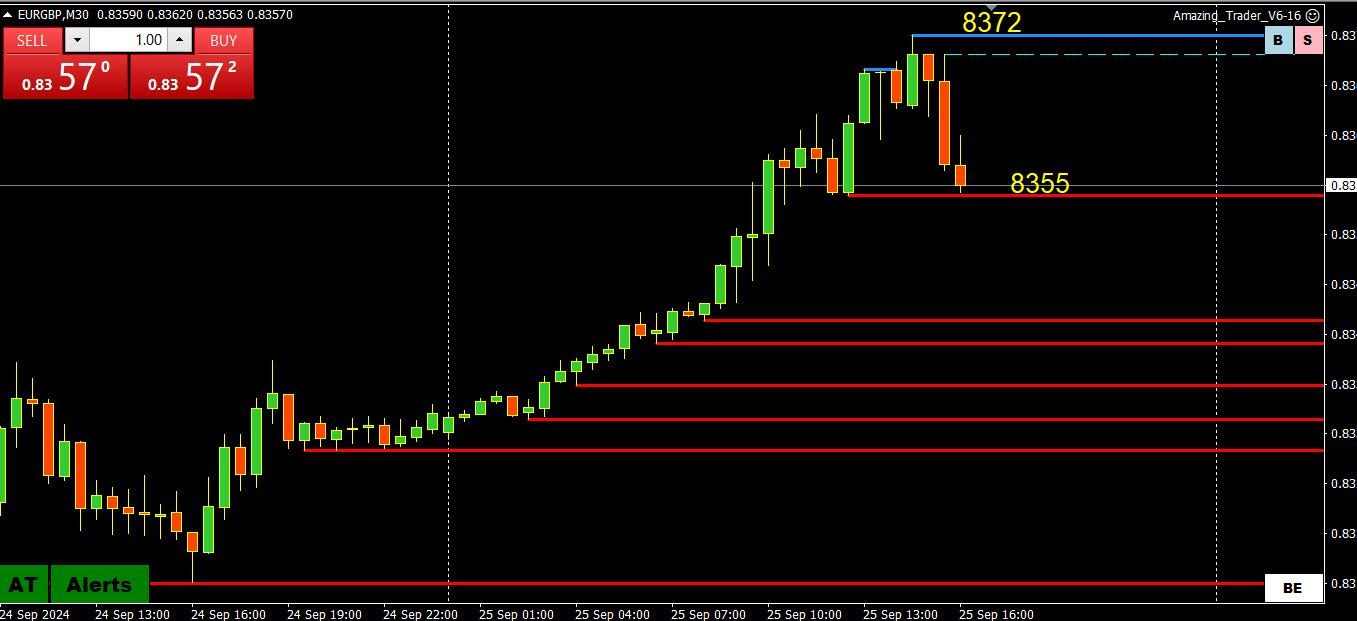
If trading EURUSD and GBPUSD, it pays to keep an eye on EURGBP, which is firmer today… weighing on GBPUSD while EURUSD follows with a lag
This follows a bounce from ,8317, lowest level since early 2022.
Supports: .8339, .8317
Resistance: .8389 (this week’s high)
September 25, 2024 at 9:37 am #12038September 25, 2024 at 9:14 am #12037 -
AuthorPosts
- You must be logged in to reply to this topic.
Search
© 2024 Global View