
- This topic has 28,410 replies, 54 voices, and was last updated 53 minutes ago by GVI Forex 2.
-
AuthorPosts
-
November 13, 2024 at 6:52 pm #14372November 13, 2024 at 6:39 pm #14371November 13, 2024 at 5:41 pm #14370November 13, 2024 at 5:12 pm #14364November 13, 2024 at 4:55 pm #14361November 13, 2024 at 4:35 pm #14360
EURGBP 1 HOUR CHART – Chart speaks for itself
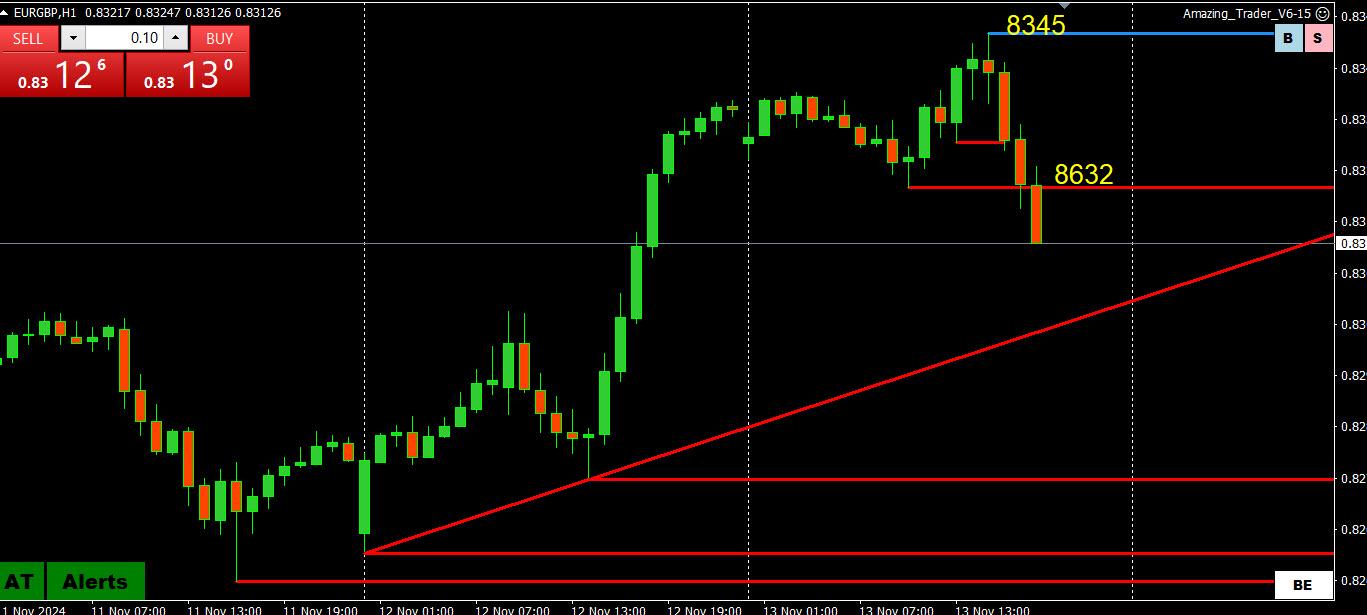
You have seen me focus on this cross as a clue to trading EURUSD and/or GBPUSD o I will let the chart speak for itself to explain the weak EURUSD and lagging GB=PUSD.
As I haver offered before, feel free to contact me (link in the top menu bar) if you want me to elaborate.
November 13, 2024 at 4:28 pm #14359US500 4 HOUR CHART – CONSOLIDATION?
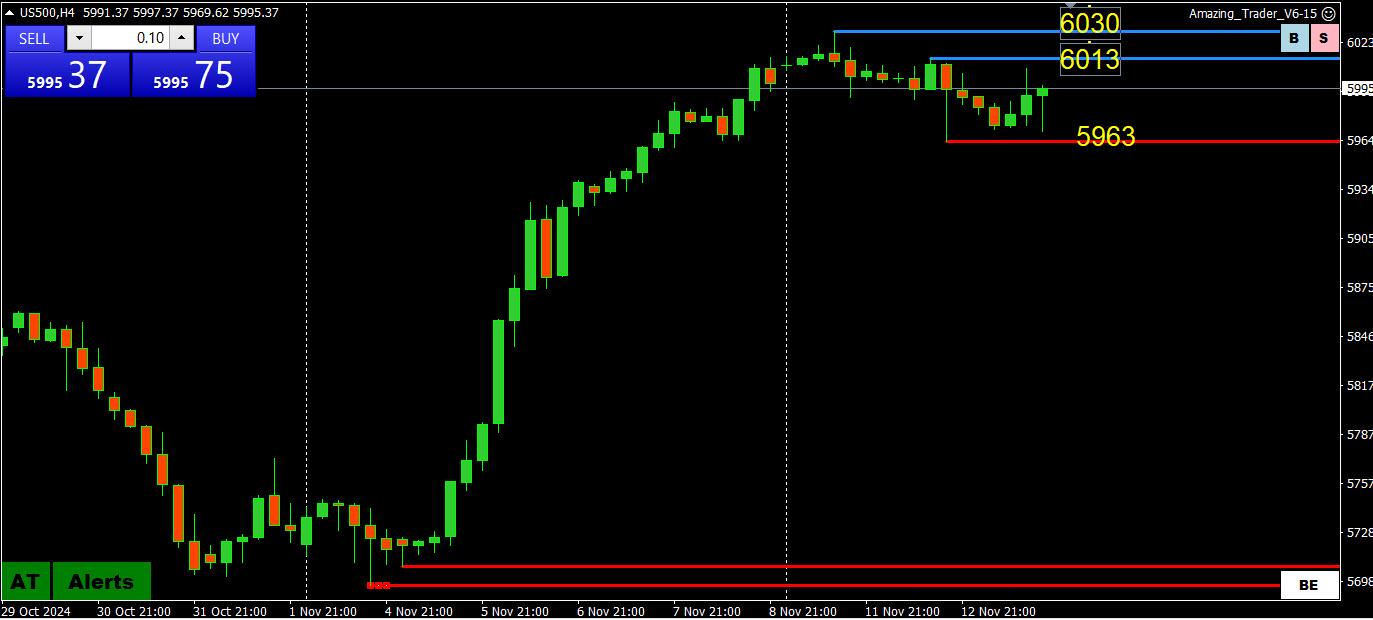
I posted this late yesterday and so far, this is just consolidation.
Keep an eye on 5963 as a break would suggest a pause and risk of a retracement.
On the other side, 6000 is clearly a majo pivotal level that will dictate whether this is just consolidation or risk of a deeper retracement.
November 13, 2024 at 4:23 pm #14358November 13, 2024 at 4:15 pm #14357November 13, 2024 at 3:07 pm #14350November 13, 2024 at 3:02 pm #14349November 13, 2024 at 2:36 pm #14348November 13, 2024 at 2:35 pm #14347MUST READ
I suggest reading this article in our blog, especially when the dollar dip after the CPI report, which ran some stops to take out weak longs, did not follow through. It was like a mini retracement.
Forex Trading Tip: How to Use Retracements to Your Advantage
 November 13, 2024 at 1:34 pm #14346November 13, 2024 at 1:26 pm #14343November 13, 2024 at 12:06 pm #14341
Thinking out loud… If stocks are taking a breather from the Trump Trade, will FX follow?
Reaction to US CPI will give a clue… See our Economic Calendar
November 13, 2024 at 11:45 am #14340NEWSQUAWK US OPEN
Dollar & USTs flat ahead of US CPI and a slew of Fed speakers
Good morning USA traders, hope your day is off to a great start! Here are the top 4 things you need to know for today’s market.
4 Things You Need to Know
European bourses are mostly on a modestly firmer footing; US futures are incrementally lower ahead of US CPI.
Dollar is flat, JPY marginally underperforms with USD/JPY briefly topping 155.00.
USTs are incrementally firmer and ultimately in stasis ahead of US CPI; Gilts continued to underperform.
Crude and precious metals gain but base metals remain subdued.
Not signed up to our squawk service yet?
Listen to our team of analysts broadcast the news that will impact the markets as it happens, and never be caught off guard again.
November 13, 2024 at 10:58 am #14338November 13, 2024 at 10:42 am #14337November 13, 2024 at 10:22 am #14336EURUSD 1 HOUR CHART – WAITING FOR US CPI


This chart is very clear…
1.0630 is a key resistance… BUT would need become support and then renew 1.0665 (former support) to shift risk away from 1.06
Extended low by 2 pips to 1.0593, suggests there were not a lot of stops below yesterday’s 1.0594 low….still at risk as long as it trades below 1.0630
November 13, 2024 at 6:51 am #14334November 13, 2024 at 12:29 am #14333Suggest reading this article in our blog
Forex Trading Tip: How to Use Retracements to Your Advantage
 November 12, 2024 at 9:34 pm #14332November 12, 2024 at 9:16 pm #14330
USDJPY 4 HOUR CHART – 155 OR BUST

The key level is clear at 155, not only a major pivotal level but 155.20 is just above it.
I am not saying there was a hidden hand protecting 155 but price action suggest there was someone protecting this level.
On the downside, only back below 154.40 would deflect the focus from 155,
November 12, 2024 at 9:10 pm #14329November 12, 2024 at 9:04 pm #14328November 12, 2024 at 8:59 pm #14327November 12, 2024 at 8:02 pm #14326NIO Inc.
NIO Down Nearly 9%, on Pace for Largest Percent Decrease Since December 2023
Targets 3.50 area
NIO Inc. Sponsored ADR Class A (NIO) is currently at $4.61, down $0.45 or 8.89%
· On pace for largest percent decrease since Dec. 20, 2023, when it fell 10.2%
· Worst three day stretch since the three days ending April 16, 2024, when it fell 14.57%
· Down 9.61% month-to-date
· Down 49.17% year-to-date; on pace for worst year since 2022, when it fell 69.22%
· Down 92.66% from its all-time closing high of $62.84 on Feb. 9, 2021
· Down 51.11% from its 52-week closing high of $9.43 on Dec. 28, 2023
 November 12, 2024 at 7:25 pm #14325November 12, 2024 at 5:49 pm #14324
-
AuthorPosts



- You must be logged in to reply to this topic.
Search
© 2024 Global View