
- This topic has 28,050 replies, 54 voices, and was last updated 1 hour, 21 minutes ago by Adam Global.
-
AuthorPosts
-
October 24, 2024 at 2:33 pm #13384October 24, 2024 at 2:05 pm #13383
With the dollar retracing today, this article posted in our blog yesterday is a timely one
In our blog
As those who have followed my thinking know, I believe trading is common sense. When you think of trading this way you can make sense of what many take as blind faith and learn how our logic takes advantage of retracements to trade. This is why I say embrace the retrace,
 October 24, 2024 at 2:00 pm #13382October 24, 2024 at 1:49 pm #13381
Slight upside beat Flash S&P Global PMI… not as important as the ISM PMI but markets seem to try and react to any data
October 24, 2024 at 1:47 pm #13380October 24, 2024 at 1:43 pm #13379October 24, 2024 at 1:26 pm #13378October 24, 2024 at 1:14 pm #13377EURUSD 4 HOUR CHART – Watch 1.08

Using Amazing Trader charts and logic, the 1.0770 low indicated a potential change in direction that was followed by the move up that tetted a resistance at 1,0807.
While 1,08 is clearly the bias setting level, treat any move that fails below 1.0838 as a retracement.
October 24, 2024 at 12:33 pm #13374October 24, 2024 at 12:21 pm #13372October 24, 2024 at 11:21 am #13359October 24, 2024 at 10:52 am #13355NEWSQUAWK US OPEN
TSLA +10%, Autos gain on China reports, PMIs mixed, USD & US yields soft into data
Good morning USA traders, hope your day is off to a great start! Here are the top 4 things you need to know for today’s market.
4 Things You Need to Know
European bourses are entirely in the green and reside just off session highs; US futures also gain, with NQ outperforming after strong TSLA (+10.7%) results.
Dollar is on the backfoot giving back some of this week’s gains, JPY outperforms with USD/JPY scaling back to a 151 handle.
USTs/Bunds are on a firmer footing, with EZ PMIs continuing to paint a dire picture in Europe; Gilts are the clear underperformer amid reports that Chancellor Reeves will announce major changes to fiscal rules releasing GBP 50bln for spending.
Crude continues to pick up, catching a bid following unconfirmed reports which indicated a fire in proximity to an Iranian nuclear facility in Karaj; XAU/base metals are firmer
Not signed up to our squawk service yet?
Listen to our team of analysts broadcast the news that will impact the markets as it happens, and never be caught off guard again.
October 24, 2024 at 10:45 am #13348A look at the day ahead in U.S. and global markets from Mike Dolan
Markets caught a break on Thursday as the white heat of the corporate earnings season saw a beat for megacap Tesla that sent its shares surging 12% before the bell while bond yields beat a retreat on soft business surveys overseas.
There was also some wariness that recent pre-election trades betting on a win for Republican Donald Trump in next month’s White House race may be a tad premature. There’s still no clear indication from polling on how the close contest will break, with nearly 25 million early votes already cast, according to tracking data.
October 24, 2024 at 9:59 am #13341October 24, 2024 at 9:51 am #13340I guess looking back, it was too much to expect a one way market given the current geopolitical and political (US election uncertainties,
In any case, there were some failures worth noting
EURUSD failed to stay below 1.0777
USDJOY failed to reach 153.39 (61.8%)
AUDUSD failed ti hold breaks of .6621 and the 200 day mva (6626)
XAUUSD failed in the 2700-14 support zone
US500 failed to sustain break below 5805However, so far this has just given the market a breather. To suggest anything
More than this EURUSD would need to solidly regain 1.0800, GBPUSD 1.30 and/or USDJPY stay below 152 and move back below its 200 day mva.October 24, 2024 at 9:45 am #13339October 24, 2024 at 6:20 am #13336October 24, 2024 at 12:28 am #13335BTCUSD 4 HOUR – CHOP

PAUSING JUST ABOVE THE 100 PERIOD MVA (BLUE) IN WHAT REMAINS CHOP TRADING UNLESS EITHER SIDE OF 65-70k IS TAKEN OUT.
I CAN MAKE IT EVEN TIGHTER AT 65-68k BUT HISTORY SHOWS THIS IS TOO NARROW TO LAST FOR LONG.
MOVES lBELOW THE 100 AND 200 (YELLOW) MVA WOULD LIKELY BE NEEDED TO SHIFT THE FOCUS THE OTHER WAY.
October 24, 2024 at 12:20 am #13334October 24, 2024 at 12:16 am #13333In our blog
As those who have followed my thinking know, I believe trading is common sense. When you think of trading this way you can make sense of what many take as blind faith and learn how our logic takes advantage of retracements to trade. This is why I say embrace the retrace,
 October 23, 2024 at 8:47 pm #13309October 23, 2024 at 8:10 pm #13308
AUDUSD DAILY CHART – TARGET AREA

The 200 day mva (6626) and 6621 support were cited by us as the key target area on the downside.
The brief break below this area (low .6614) but subsequent close back above it has not negated the risk but offset some of the damage.
A move back above 6645-50 would be needed to cool the risk
October 23, 2024 at 7:51 pm #13307Size of cleared Yen futures, forwards and options have been clearly dominant on the buy side today. BOJ may see that among other things and not say anything about Yen tonight in Asia. There are times they pay attention to the little things, and those things are fairly little for them to observe. If the activity holds then I wrestle with the thought of them providing verbal warnings.
October 23, 2024 at 7:26 pm #13306USDJPY 4 HOUR CHART – WHERE ISW THE BOJ?

If I was the BOJ I would be concerned over the pace of the USDJPY move so don’t be surprised to see some verbal intervention.
Key levels:
155.20 key daily resistance
153.39 = 61.8% of 161.94-139.58
153.19 = Wed high
152 = pivotal bias setting level
151.40= 200 day mva
150.49 = base of last leg up
October 23, 2024 at 7:17 pm #13305US500 4 HOUR CHART – Amazing!

Look at how the Amazing Trader 5764 support held dead on. I created this charting algo and it still amazes me how well its lines/levels work
The break of 5805 was significant, suggesting back above 5800-05 would be needed to ease the risk.
In any case, high is likely in for now. Key level is at 5672, treat any move down as a retracement unless this level is broken.
October 23, 2024 at 7:14 pm #13304Yen option buyers started coming in around 8:30 PST / 11:30 EST. The result has not yet seen results to cause absolute conviction of Yen pairs selling off and sticking but a decent start in terms of positioning. To this point it has been a one day sell. The same timing took place for US stocks and they lifted at the same times but to this point it could just be bottom feeding or hedging or portfolio adjustments. Fairly convincing week however and today especially to consider the sell side having staying power for Yen pairs.
October 23, 2024 at 7:02 pm #13303XAUUSD 4 HOUR CHART – UP LIKE AN ECALATOR DOWN LIKE AN ELEVATOR

Close below 2719 would create an outside day key reversal but not sure how well that works with metals.
High (2758) is likely in for now at least and dependent on 2700 holding to contain the retreat.
On the downside, treat any move down as a retracement unless 2601 is taken out.
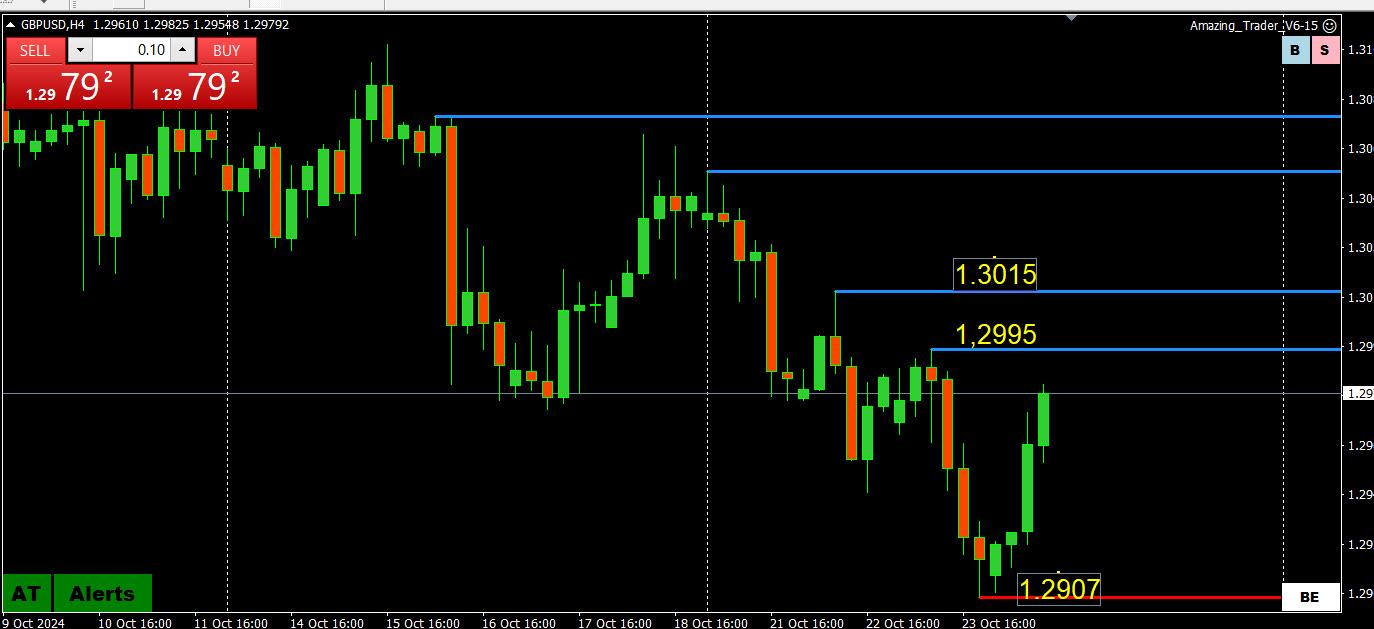
October 23, 2024 at 6:52 pm #13302GBPUSD DAILY CHART – 1.30 breakdown

If you followed my posts about EURGBP you would have seen the driver of GBP selling.
Now, the 1.30 breakdown makes this the key level, below which downside stays exposed.
Key level is around 1.28, where the 200 day mva resideS..
Otherwise, in the absence of any obvious nearby support, use the most recent low as the first level of support.
October 23, 2024 at 6:08 pm #13301October 23, 2024 at 5:54 pm #13300 -
AuthorPosts


- You must be logged in to reply to this topic.
Search
© 2024 Global View