
-
AuthorSearch Results
-
August 23, 2024 at 3:19 pm #10873
In reply to: Forex Forum
August 19, 2024 at 8:18 pm #10695In reply to: Forex Forum
August 19, 2024 at 10:53 am #10673In reply to: Forex Forum
August 19, 2024 at 12:19 am #10662In reply to: Forex Forum
August 15, 2024 at 10:40 am #10542In reply to: Common Sense Trading
How Markets Work – Trading the News
You need to understand the dynamics of the market and how it works so you can evaluate the reaction to a news event or a news headline.
There are news algos that are programmed to react to keywords. So, if a news headline comes out, such as a geopolitical news headline, the algos would react by buying or selling even if it eventually turned out to be a non-event.
Now, let’s get down to what most traders look at, which are economic data reports. No matter how fast a news feed you have, the news algos, programmed to react to economic reports, will be faster. I have a fast news feed and before I even see the data, markets have already reacted.
This was the case overnight and is a classic example.

As this chart shows, AUDUSD was trading at .6588 prior to the release of the July employment report. fell to .6556 on the release and then quickly rebounded, currently trading at.6627.
This is commonly called a whipsaw, which can be painful to seasoned traders but disastrous to retail traders without deep pockets.
Whipsaw: In trading, a whipsaw is a slang term that describes a volatile market where price suddenly moves in one direction and then quickly reverses.
Why did it react that way?
News algos reacted to the headline, including a tick up in the jobless rate but on closer inspection, it was not a weak report. This was no solace to those who saw their stops get run on the initial reaction only to see the market quickly reverse.
This is why I do not hold positions into economic data releases, as stops are not safe, even if you have the right idea as witnessed by the AUDUSD reaction to the data.
So, bottom line, if you want to be a player in the global trading market, you have to understand how it works and why you see sharp reactions to data that sometimes follow through and other times quickly reverse. News algos are mindless, and react first while traders evaluate the moves afterwards.
Feel free to ask questions.
August 15, 2024 at 9:47 am #10539In reply to: Forex Forum
AUDUSD 4 HOUR CHART – HOW DO YOU SPELL WHIPSAW?

Whipsaw: In trading, a whipsaw is a slang term that describes a volatile market where price suddenly moves in one direction and then quickly reverses.
AUDUSD jobs report whipsaw: .6588 => .6556 => .6627
Key resistance Wed’s .6643 high and then a void (major level .6713)
Nothing to speak of on the downside in way of support so look for a bid if it can stay above .66–.
August 15, 2024 at 1:43 am #10538In reply to: Forex Forum
August 14, 2024 at 5:00 pm #10526In reply to: Forex Forum
August 14, 2024 at 4:57 pm #10525In reply to: Forex Forum
August 12, 2024 at 12:26 pm #10391In reply to: Forex Forum
August 12, 2024 at 9:41 am #10380In reply to: Forex Forum
AUDUSD 4 HOUR CHART – JPY CROSSES

AUD and NZD both outperforming while JPY is weaker (USDJPY higher) suggest JPY crosses are at play.
AUDUSD .6610 is a key resistance
Support below the market as long as it trades above .6545.
Whatever the case, the blowout to the downside (just one week ago) indicates the bottom is in.
August 7, 2024 at 11:35 am #10209In reply to: Common Sense Trading
How You Can Use Currency Crosses to Trade Spot Forex and Carry Trade (follow ups)
How do we know that cross flows are driving the market?
When two currencies move in opposite directions you can assume there are real money cross flows
Look at USDJPY and USDCHF (both up sharply) vs firmer commodity currencies and GBP is up as well once the carry trade unwinds ended.
Currently:
USD STRONGER
USDJPY +2.0%
USDCHF +1.4%USD WEAKER
GBPUSD =0.3%
USDCAD -0.3%
AUDUSD +0.7%
NZDUSD +1.1%August 7, 2024 at 9:38 am #10199In reply to: Forex Forum
AUDJJPY 4 HOUR CHART – On the rebound

As I have been noting, with JPY carry trade unwinds appearing to be over for now and the deck cleared of JPY buy stops, the mood in markets has changed.
This has seen JPY give back some ground, especially vs. the commodity currencies.,
This has lifted AUDUSD as AUDJPY recovers although NZDJPY is the outperformer today.
As this chart shows, key level is not until 98.72, a break would confirm the low is in.
In any case, expect support on dips as long as above 95.49
August 6, 2024 at 8:20 pm #10190In reply to: Forex Forum
AUDUSD 4 HOUR CHART – Focus on ,6500

Same levels on this chart posted yesterday with .6547-59 the key area needing to be broken to confirm the low is in.
AUDUSD came close but paused below it as a late day swoon in US stocks took away some of the risk on mood.
In any case, .6500 is one of those pivotal levels that will dictate whether this rebound has legs.
NOTE, .6500 HAS TRADED 5 DAYS IN A ROW. LOOK FOR THE RISK OF A DIRECTIONAL MOVE ONCE THIS PATTERN IS BROKEN.
August 6, 2024 at 2:35 pm #10165In reply to: Forex Forum
August 5, 2024 at 10:16 pm #10132In reply to: Forex Forum
AUDUSD 4 HOUR CHART – RBA ON DECK

The spike down to .6348 has wiped the deck of stops on the downside.
On the upside, a move above .6547-59 (use .6545-60) would be needed to confirm the low is in and shift the risk to the upside..
Next up is the RBA decision where ,6500 will dictate whether this rebound has legs.
July 31, 2024 at 1:59 pm #9845In reply to: Forex Forum
I would like to see AudUsd 6450 or lower to provide an opportunity to load up on the buy side for 6650. That pair and Gold have stable fundamentals. People thought I was far fetched a month ago when UsdJpy was in pure buy mode and I said we would hit 153 or even 150 in coming weeks. Are we there yet?
July 31, 2024 at 8:19 am #9828In reply to: Forex Forum
July 30, 2024 at 10:15 am #9780In reply to: Forex Forum
July 29, 2024 at 10:39 am #9737In reply to: Forex Forum
EURUSD came with a pip of 1.0871 resistance before reversing to come within a haor of redent 1.2825 support.
Note how 1.0850 is setting its tone.
AUDUSD lagging and trading both sides of .6550. Aussie CPI report is due on Wednesday and will be watched closely as RBA as interest rates are seen on hold for the foreseeable future.
July 26, 2024 at 1:02 pm #9678In reply to: Forex Forum
July 26, 2024 at 9:39 am #9666In reply to: Forex Forum
AUDUSD DAILY CHART – GREEN CANDLE

I AM ALWAYS ON THE LOOKOUT FOR PATRTERNS.
I have been watching AUDUSD and AUDJPY for signs of carry trade unwind pressures.
AUDUSD so far has first green candle after 9 red ones in a row.
AUDJPY has second green canbdle in Past 12 session (other green candle was abrief one day pause).
This has implications for markets in general.
With that said, THIS IS STILL JUST A BOUNCE SO watch .6550 as it will set the tone in AUDUSD (i.e. needs to trade above it to give it a bid).
July 25, 2024 at 2:35 pm #9649In reply to: Forex Forum
July 25, 2024 at 10:06 am #9618In reply to: Forex Forum
AUDUSD DAILY CHART – .6500 LOOMS

Current patterm (which I have been noting) 9 down days in a row
Key supports are a6 .6464 and .6361
.6500 may become important if it holds but depends on whether there is more selling in AUDJPY
Technical damage: It closed below the 100 day mva yesterday (blue) and has broken below the 200 day mva today.
To slow the risk, AUDJPY needs to find support and the 200 day mva, at a minimum would need to be recovered,
July 23, 2024 at 11:26 am #9512In reply to: Forex Forum
July 22, 2024 at 1:14 pm #9467In reply to: Forex Forum
AUDJPY DAILY CHART – RED CANDLES!
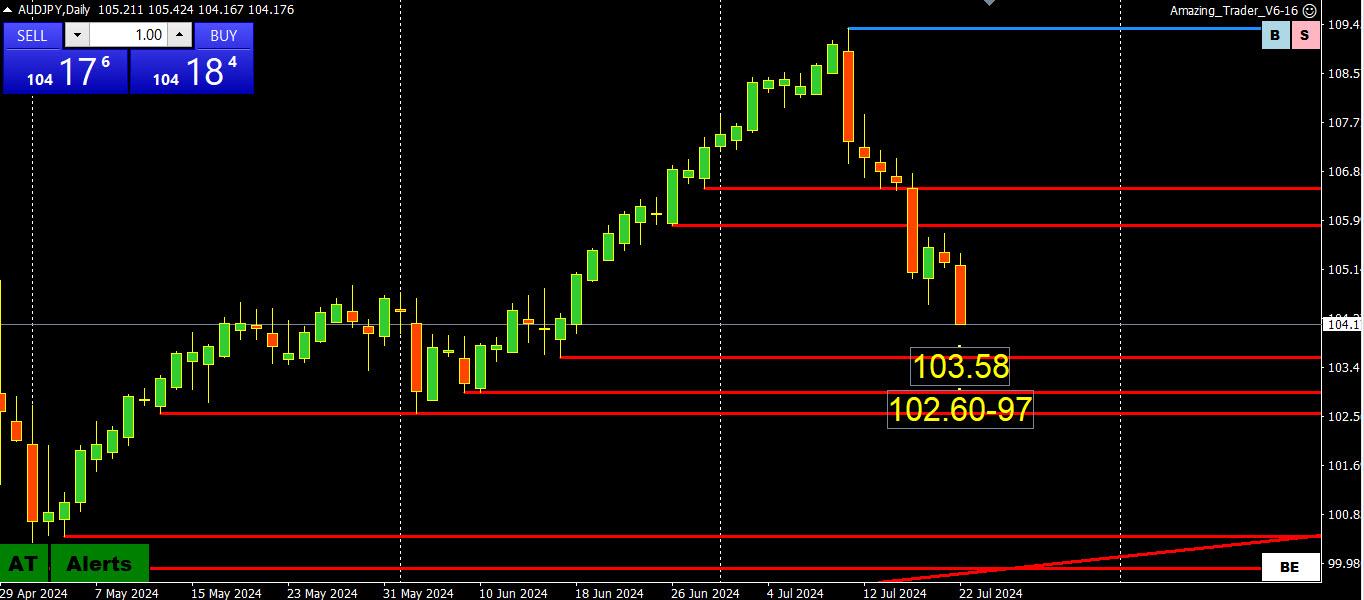
Chart shows 7 red candles out of the opast 8 days with key supports shown on the charts.
aUD weakness ius also evident on an AUDUSD daily chart where there are 6 red candles in a row. As I noited, keep an eye on these patterns if looking for a sign of a pause or bottom.
July 19, 2024 at 12:11 pm #9362In reply to: Forex Forum
July 17, 2024 at 12:14 pm #9265In reply to: Forex Forum
Pauses below EURUSD 1.0950 and GBPUSD 1.3050, AUDUSD brief blip above .6750 and USDCAD pause above 1.3650 means it is time to revisit
My Favorite Trading Secret: The Power of the 50 Level
 July 16, 2024 at 1:52 pm #9203
In reply to: Forex Forum
Post data
USD firmer but so far
EURUSD still above 1.0860
USDJPY staying below 159 (intervention threat?)
USDCAD tested 1,37 post-CPI but did not come close to key level (see update below)
AUDUSD extended fall throiugh .6750 but held .6710 support (scroll to see uodate)US stocks firmer, again led by Russell
US bond yields back to 4.20% but still down on the day
July 15, 2024 at 8:10 pm #9165In reply to: Forex Forum
-
AuthorSearch Results





Search
© 2024 Global View