
- This topic has 57 replies, 3 voices, and was last updated 1 year, 7 months ago by GVI Forex 2.
-
AuthorPosts
-
August 11, 2024 at 11:05 am #10363August 7, 2024 at 9:41 pm #10241August 7, 2024 at 11:35 am #10209
How You Can Use Currency Crosses to Trade Spot Forex and Carry Trade (follow ups)
How do we know that cross flows are driving the market?
When two currencies move in opposite directions you can assume there are real money cross flows
Look at USDJPY and USDCHF (both up sharply) vs firmer commodity currencies and GBP is up as well once the carry trade unwinds ended.
Currently:
USD STRONGER
USDJPY +2.0%
USDCHF +1.4%USD WEAKER
GBPUSD =0.3%
USDCAD -0.3%
AUDUSD +0.7%
NZDUSD +1.1%August 6, 2024 at 8:00 pm #10187What is a Carry Trade?
Trading can be more than jusf looking at charts as real money flows are often driven by more than just technicals.
This has been the case of late with the sharp drop in USDJPY has been fueled by unwinding of carry trades.
What is A carry trade?
Strictly speaking, carry trade is a strategy used in the financial markets where an investor borrows money at a low-interest rate in one currency and uses it to invest in another currency or financial instrument that offers a higher return. The primary goal is to profit from the difference between the interest rates, known as the “interest rate differential.” Here’s a basic rundown of how carry trades work:
Borrowing in a Low-Interest Currency: The investor borrows funds in a currency with a low-interest rate, such as the Japanese yen (JPY) or the Swiss franc (CHF).
Investing in a High-Interest Currency: The borrowed funds are then converted into a currency with a higher interest rate, such as the Australian dollar (AUD) or the New Zealand dollar (NZD), and invested in financial instruments like government bonds or other assets that yield a higher return.
Earning the Differential: The investor earns the difference between the higher interest earned on the investment and the lower interest paid on the borrowed funds.
Example of Carry Trade
Borrow: Borrow 1,000,000 JPY at an interest rate of 0.5%.
Convert and Invest: Convert the 1,000,000 JPY into AUD and invest in Australian government bonds yielding 5%.
Profit: Earn the interest from the Australian bonds (5%) and pay the interest on the Japanese loan (0.5%), keeping the difference as profit. (Full transparency, I used ChatGBT for the carry trade definition)However, in reality, hedge funds, for example, borrow low yielding currencies such as the JPY and CHF and use the proceeds to buy bonds, stocks, cryptos, metals and commodities. So, when these massive positions unwind, as happened recdently, it can affect all markets.
The following is an article worth reading so you will understand the impact of carry trades.
Global market rout has more to do with end of cheap funding than US economy
This may be alot to digest but it is important to be aware of what drives what you are seeing on your charts and times that those exiting positions care more about liquidity than price.
If you have any questions, post them in the Q&A
August 5, 2024 at 12:13 pm #10082The Market Isn’t Your Enemy
In the current one way markets, the temptation to try and pick a top or bottom can be very strong. So, I am posting the article as a warning, one I learned many years ago the hard way and hopefully you will be able to avoid it. I suggst reading Bobby’;s Risk mangament update in the Trading Academy along with this article.
The Market Isn’t Your Enemy
One of my favorite articles I wrote as a warning to all traders is entitled, The Market Isn’t Your Enemy and it is worth repeating in the current market. I posted this (see below) several years ago to go along with the article and if it was today, I would not be surprised to see traders trying to fight the current trend the other way and sell the JPY with similar results. This is an article that has stood the test of time.
(November 2014)
I saw the trade recap of a trader I know for a long time, who I believe possesses good skills, and took a double take. I was really surprised by his trading sheet to say the least. It was last Tuesday when the JPY fell sharply. On that day, he lost on 13 consecutive trades either selling EURJPY or GBPJPY. You heard it right, 13 losers in a row until he finally gave up for the day.
While I cannot get inside his head, the trade recap suggested he lost discipline and got into a battle with a mindless market. It appears he fell into the trap I warned about in The Market Isn’t Your Enemy. It can happen to even experienced traders and for that reason I am repeating the article below for all to read:
The Market Isn’t Your Enemy
Have you ever had one of those trading days? Have you ever lost money trading and gotten mad at the market? Have you ever taken it personally, lost discipline and tried to convince yourself the market is wrong? Did this make you feel like the market was your enemy? Did this have you fight the trend in order to beat the market only to see your efforts repeatedly stopped out? This has probably happened to most traders at one time or another but it is not something you want to repeat.
The market is not your enemy. It is not a living organism although sometimes it might feel that way. The market is just a place where trades are transacted. Price action may sometimes seem illogical, even irrational but the market is never wrong as it does not have an opinion. It is only a place where forex rates are set. It is the collective will of those trading the market.
There is a term used in forex trading, the trend is your friend. When you catch a trend right, there is little stress, especially if you manage stops so that there is no risk of a loss. When you fight a trend, the market may feel like your enemy if you make it a battle of wills, yours against a place that has no will or opinion. .
Now, this is where the “market is my enemy” can take over. You can’t believe the market is acting irrationally and keep selling at every pause. Each time you get stopped out you get angry, not at yourself but at the market. You can’t believe the market is doing this to you and stiffen your back. You forget about what charts are saying, throw discipline out the window and become determined to catch the top by selling when charts are telling you to buy. By the time the move stalls out, you are beaten, having taken your lumps in what has been an emotionally draining day battling with an unemotional market. The market corrects without you on board.
Does this sound familiar? If so, then don’t repeat it. Step back when that feeling comes and take a deep breath. Walk away and come back with a clear head. Remember, the forex market is not your enemy. It is not a living organism. It is only a place where trades are transacted and prices set. When that feeling comes, remember the adage, “the market can remain irrational longer than you can remain solvent.”.
July 31, 2024 at 8:28 am #9829July 30, 2024 at 11:49 pm #9825How You Can Use Currency Crosses to Trade Spot Forex
If I told you that there was a large order in the market to buy EUR and sell GBP would you be looking to sell EURUSD and buy GBPUSD, do the opposite or step aside as the order gets executed?
We are just outsiders in the forex market
As outsiders, we are not privy to the flows in the market. Due to increased regulation, banks that are executing the orders are no longer able to pass on information. In addition, the increased use of online platforms makes it even more difficult to get information on order flows.
As a result, all we are left with is guesswork. However, the price action in major crosses, such as EURGBP, EURJPY, GBPJPY, etc., can give a clue to the order flows driving the price action in respective currency pairs. The focus of this article is on how to use this information to trade spot forex.
What is a currency cross?
Before I go on to the current trading world, let me define a currency cross.
A cross is the relationship between two currencies. It is simple algebra. There are two variables and one product that do not directly involve the dollar as that portion gets netted out. In all cases, the dollar portion is netted out and you are left with one currency vs. another with no US dollar component.
Example 1: EURGBP is calculated by EURUSD/GBPUSD = EURGBP. Let’s say EURUSD is trading at 1.0650 and GBPUSD at 1.2450. Then 1.0650/1.2450 = EURGBP .8554.
Example 2: EURJPY is calculated by EURUSD x USDJPY = EURJPY. Let’s say EURUSD is trading at 1.0650 and USDJPY at 154.60. Then 1.0650 x 154.60 = EURJPY164.65
The difference in the calculations where we divided the two currency pairs in example 1 and multiplied in example 2 is the way each currency pair is quoted vs. the US dollar.
For example, EUR and GBP are quoted as dollars per one EUR (or GBP) while USDJPY is quoted as Japanese Yen per US dollar.
However, this does not mean, as you will soon see, that the dollar is not impacted by cross trades as the market has to go into and out of the US xurrency (as the case may be) to create the cross.
No longer a dollar-centric world
When I first started trading in the forex market it was a dollar-centric world. The dollar was the center of all transactions and currencies rarely moved in opposite directions from one another. Most times currencies moved in the same direction in line with the prevailing dollar trend but not necessarily at the same pace. For example, if there was a EURGBP sell order and the dollar trend was up, both EURUSD and GBPUSD would both move down but the EURUSD might move farther and faster than the GBPUSD
Now, we no longer live in a US dollar-centric trading world but a multi-currency world. What I mean by that is while the dollar is still the dominant trading currency, cross-currency flows have become a large part of forex trading and more often than not drive the spot market. It is not unusual to see two currencies move in opposite directions direction against all currencies.
How to take advantage of crosses to trade spot forex
So, the question is how do you take advantage of cross flows, even if you do not trade the crosses directly? In other words, you do not have to trade the crosses to use them to your advantage in trading a spot currency, such as EURUSD or GBPUSD.
Let’s say there is a flow in EURGBP to buy EUR and sell GBP in a market where the overall dollar trend in both is up. By looking at EURGBP, you may assume there is buying of EURUSD and selling of GBPUSP to execute an order. In this example, the overall dollar trend is up but more so vs. the GBP than vs. the EUR. The EURUSD initially trades higher and GBPUSD tries to follow as the order gets executed. The EURUSD buying is easily absorbed as there are willing sellers as the trend is down ivs. the dollar. Once EURUSD hits resistance, the GBPUSD sell component of this flow takes over and GBPUSD falls sharply.
Why? The answer is that the market has less capacity to absorb the GBPUSD selling than the EURUSD buying to execute the buy order in EURGBP. Once the order is completed and/or EURGBP meets resistance, EURUSD will lose its cross-related bid.
If the EURUSD was in a strong uptrend and that was the dominant side, GBPUSD would have initially dipped but would not have gone that far. EURUSD demand out of this cross-flow would have then taken over and pushed it higher as that was the side where flows were less easily absorbed.
As we all know, trading rarely works like a textbook but in this simple example, you can see how crosses can give a clue to trading spot fx. They tell you what flows are going through the market in what can often look like a tug-of-war with respective currencies pulling in opposite directions. When the dollar trends are mixed, you can see currencies trade in opposite ways with the dollar only acting as an intermediary. As a general rule, one currency will have less capacity to absorb the flows and this is the side of the cross-trade that tends to be most vulnerable.
One way to confirm that there is real money driving a cross is when two currencies move in opposite directions vs. the dollar.
Real-time illustration
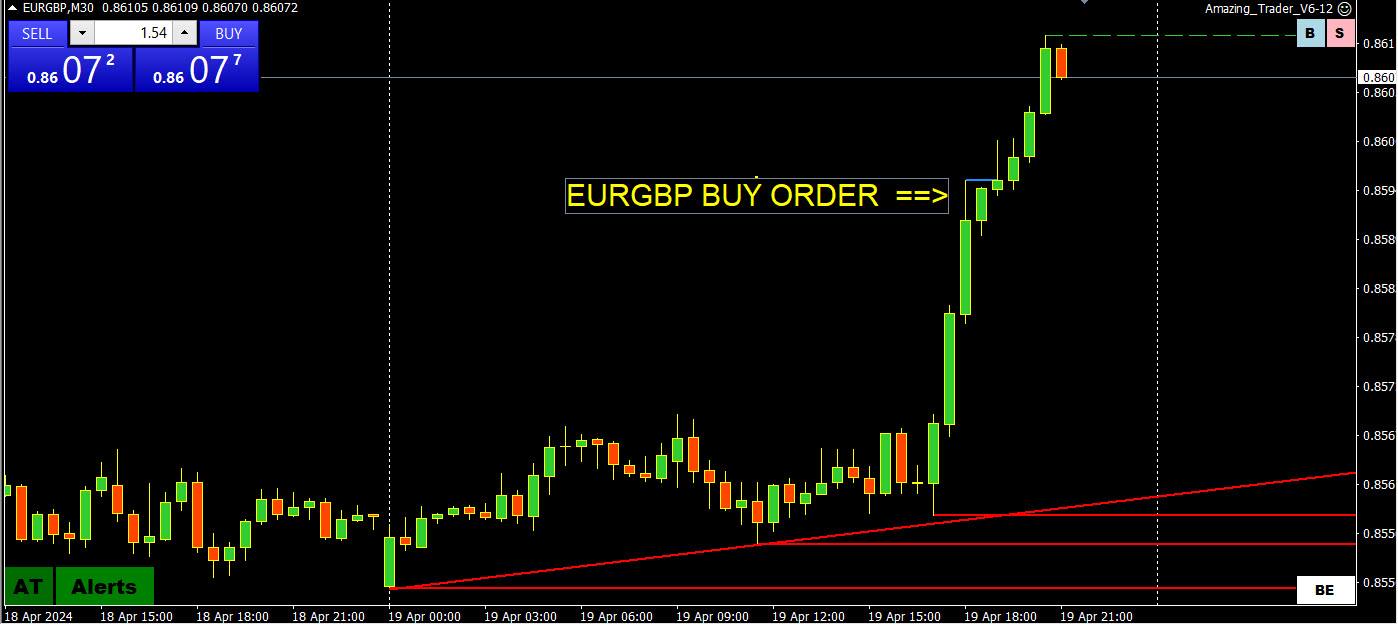
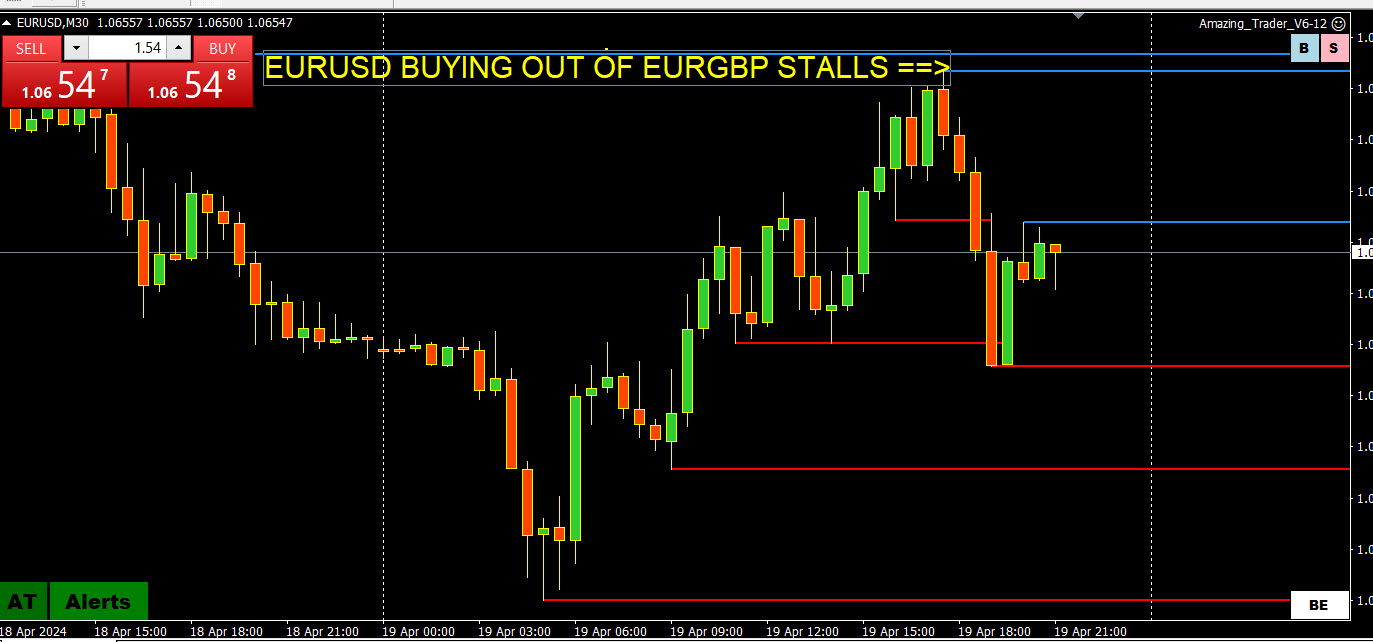
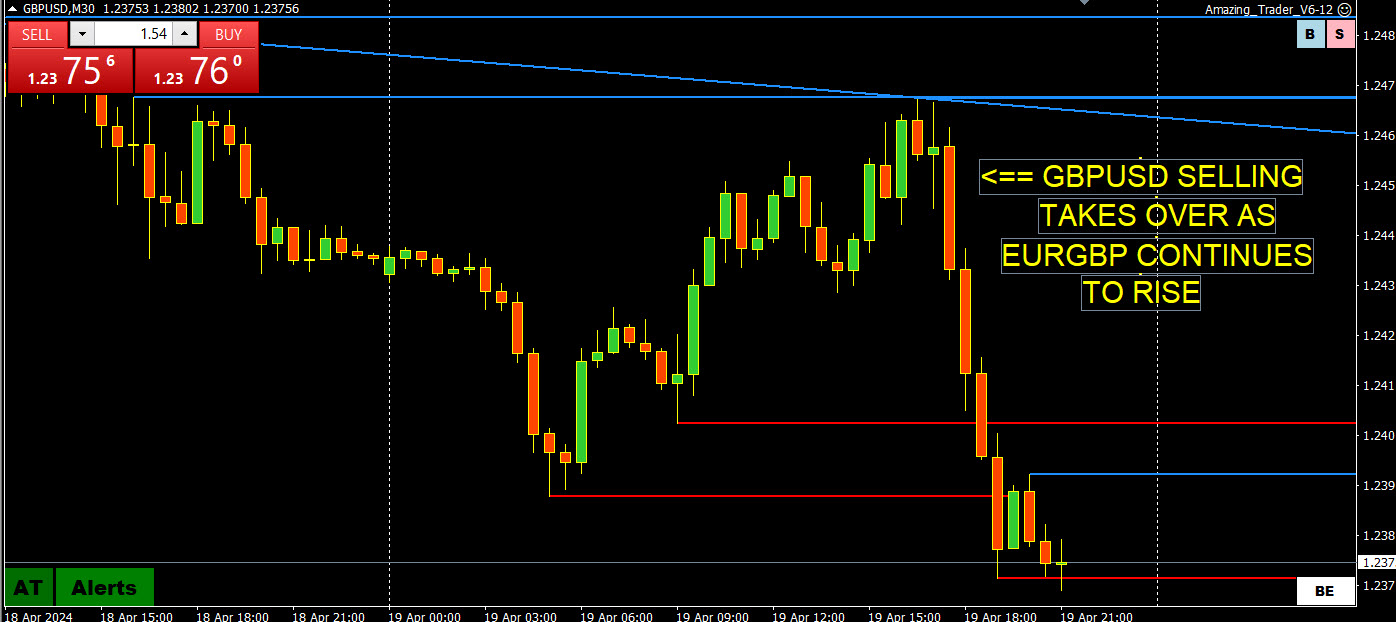
Here is a real-time illustration from April 19, 2024, where a move up in EURGBP has a greater impact on GBPUSD (sell) than EURUSD (buy)
EURGBPUSD MOVES HIGHER
EURUSD TESTS UPSIDE AND THEN STALLS
GBPUSD SELLING TAKES OVER
So, let’s conclude with the same question I asked initially:
If I told you that there was a large order in the market to buy EUR and sell GBP would you be looking to sell EURUSD and buy GBPUSD, do the opposite, or step aside as the order gets executed?
This just scratches the surface but should give you an idea of how to use crosses to trade spot forex.
Feel free to contact me with any questions or comments.
July 28, 2024 at 10:48 pm #9730Let me explain further
Capital preservation is a key to retail trading. Without it you have no capital to trade.
When placing a trade, you must always use a stop. Otherwise you risk not preserving your capital so you can live to trade another day.
This is an issue for trading on news.
Stops are not safe!
Even with the idea you can get stopped out on a news reaction.
Wirth the wrong idea, a market can run and never turn back.
There can be slippage on your stop if there is a gap on the news.
You can also get stopped by a spread widening.
TThis is just common sense if you want to stay in the trading game for the long haul.
July 28, 2024 at 1:28 pm #9715Do Fundamentals Matter? They do in the coming week.
Pure technical traders will tell you that fundamentals do not matter, it is all in the charts.
While most new traders rely on their charts, you need to be aware of news that affect fundamentals. You no not have to become an economist but you must be aware of what news is coming out (see our Economic Calendar),
Ask anyone who has tried to trade purely on charts and gotten whipped by a surprise economic or news event.
As I said, you do not have to become an economist but you need to be aware of what markets are focusing on. To keep it simple, the reason why markets react to news is the extent to which it affects expectations of changes in monetary policy.
In the current market, the focus, except for Japan (focus is on tightening monetary policy) , is on the number and pace of interest rate cuts.
We can discuss fundamentals in more details but the reason for this update is to make you aware that the upcoming week has more kep news events that I can ever remember.
My suggestion is to stay flat into these key events and then decide after whether to go with the flow or fade the reaction. This is how I trade news events.
So let’s take a look at the week ahead. The previews in this report may be too much to digest so be aware of the day/time/and the consensus forecasts.
See full detailed previews
‘
Newsquawk Week Ahead 29th July-2nd August: Highlights include FOMC, BoJ, BoE, NFP, ISM Mfg. PMI and OPEC+ JMMC July 25, 2024 at 3:19 pm #9650July 25, 2024 at 12:01 pm #9630
What is a Liquidating Market and How to Trade It
Not all markets should be treated the same. It is therefore tmportant to identify whether you are in a trend, correction, consolidation or what I call a liquidating market.
What is a liquidating market?
A liquidating market is one where the flows are looking to exit positions and not add to existing ones.
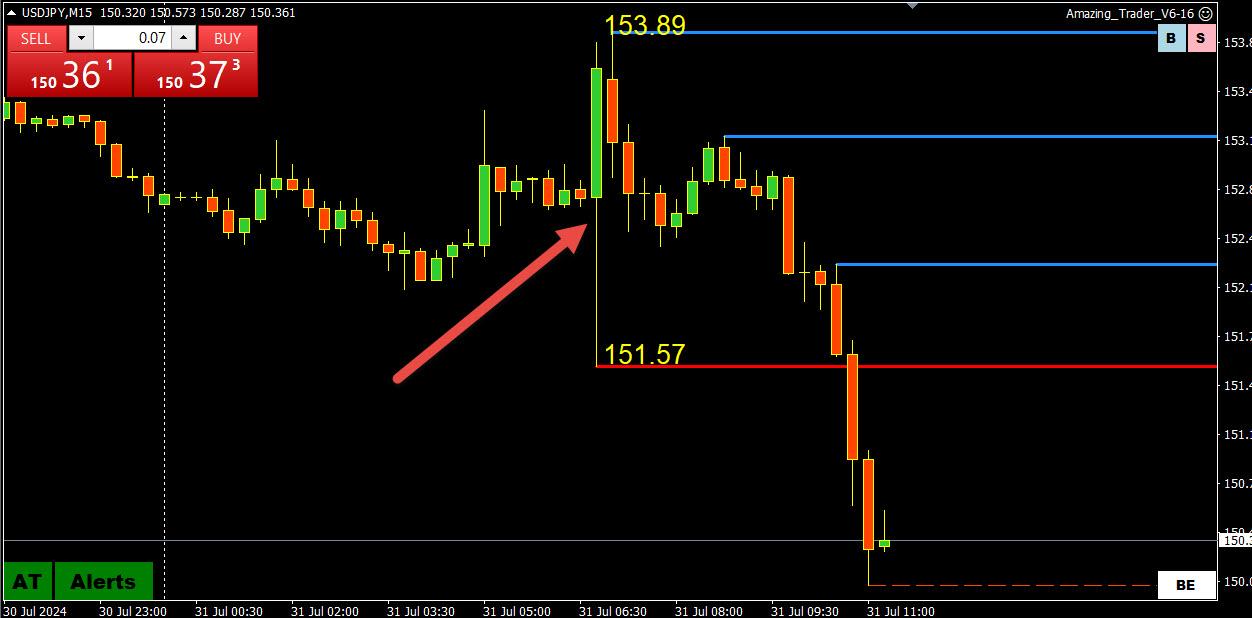
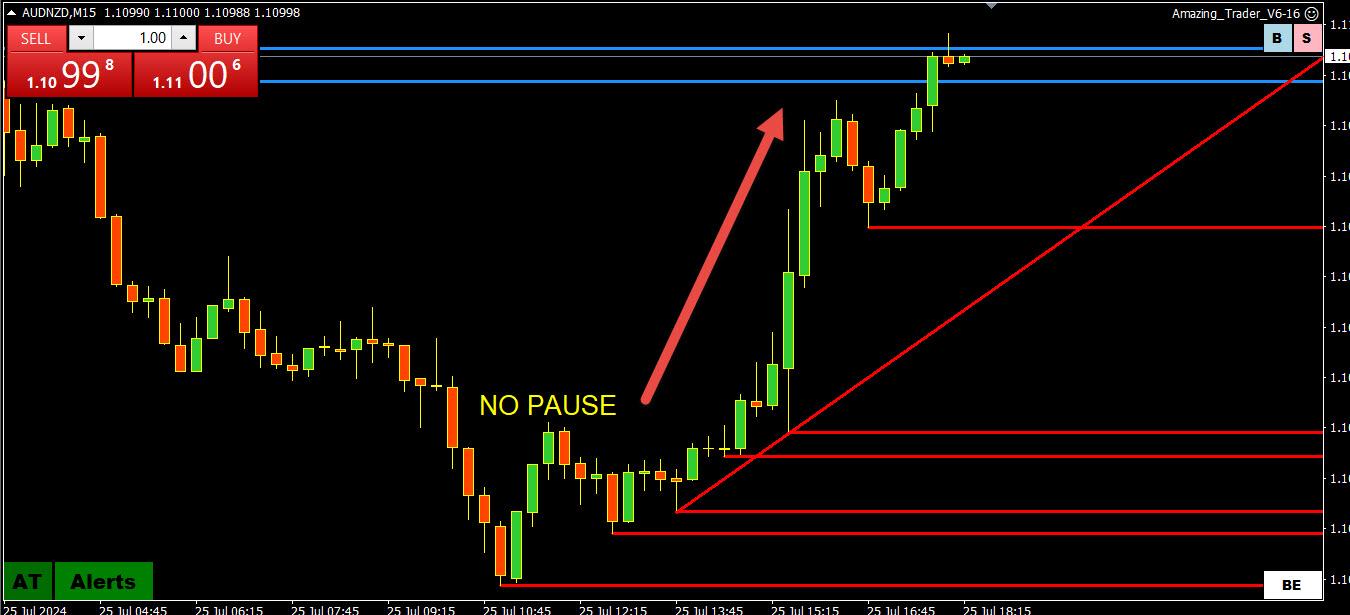
For example, take the current market where short JPY carry trade positions (we will discuss carry trades) are unwinding in forex, gold, stocks. One of the lead in fx is AUDJPY, which is down 11 days in a row. See this 15 minute chart from July 25, 2024 and not how at each pause, there is a minor uptick followed by a push to fresh lows.
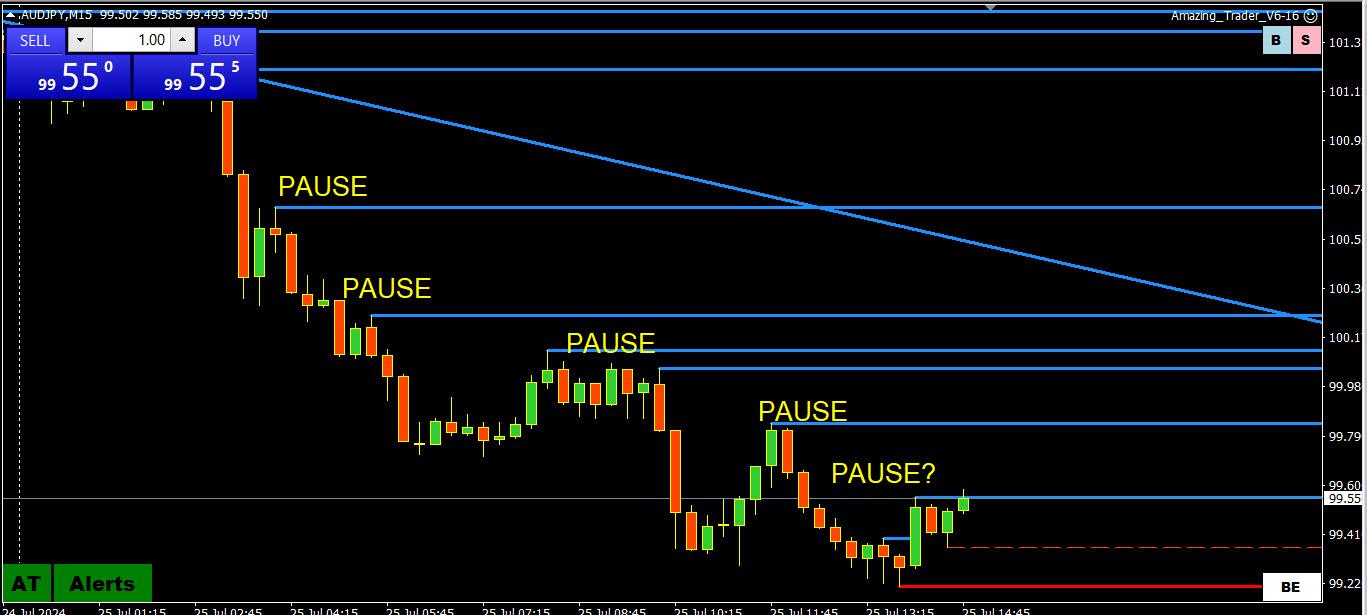
So the question is once you recognize the market is in a liquidating mode, how do you trade it?
IDENTIFYING THE TYPE OF MARKET YOU ARE IN IS ONE OF MY KEY FOREX TRADING TIPS.
The way these types of markets tend to trade is that they move in spurts as orders get executed and positions liquidated. Once the order is done, you may see some backing and filling as selling (as in the above case) is done and bottom pickers come in. (and vice versa when short positions are liquidated).
This often gives a false sense of a bottom as the market backs away from the low until the next wave of sell orders. This squeezes those trying to pick a bottom as they get stopped out by fresh selling and a new low.
Much depends on whether key technical levels get triggered as this can accelerate the move and bring in fresh selling. Liquidating markets will eventually exhaust themselves and finally reach a bottom, either by a key technical level holding or by the selling just running out of steam.
How to trade a liquidating marker
The way to trade a liquidating market is either to sell (or buy as the case may be) on the backing and filling but that is often difficult as it is hard to find a nearby stop if the chart is like a one-way street.
Another way is to put a stop entry at the low or high to go with the next wave of sell (or buy =0 order liquidations.
The other way is to wait it out and only go against the move if you sense it has completely lost steam.
However, the tendency is to buy at each pause, hoping to catch the falling knife after a new low. The danger in this approach is that by the time a low is in place you may be too beaten up to catch the bottom.
The key point is to recognize the type of market you are in and that the hardest trade is often the right trade. The easy and in this case the wrong trade is to buy the easy to get filled at what looks like an attractive level trade.
Note I used a market that is liquidating long positions as an example. The same principle applies to when short positions get liquidated.
July 23, 2024 at 10:59 pm #95598-forex-trading-tips-for-a-lower-volatility-market
It seems it has been eons ago the forex market was characterized by higher volatility, with average daily ranges exceeding 1% of the spot price more the norm than the exception.
If you are currently trading the forex market, it is hard to not recognize the lower volatility and choppy trading that have frustrated not only trend traders but day traders as well. I look at volatility as a market characterized by tight daily ranges and limited follow through with choppy trading, limited trends and often false starts in both directions. It is a matter of adapting in this environment to take advantage of opportunities to trade.
8 Forex Trading Tips for a Lower Volatility Market
 July 23, 2024 at 10:16 am #9507July 19, 2024 at 4:53 pm #9383
A taste of things to come
Look at this chart and you get a taste of what you will see here going forward.
This is a chart with my Amazing Trader program running on it. It is the definition of a liquidating marlket.
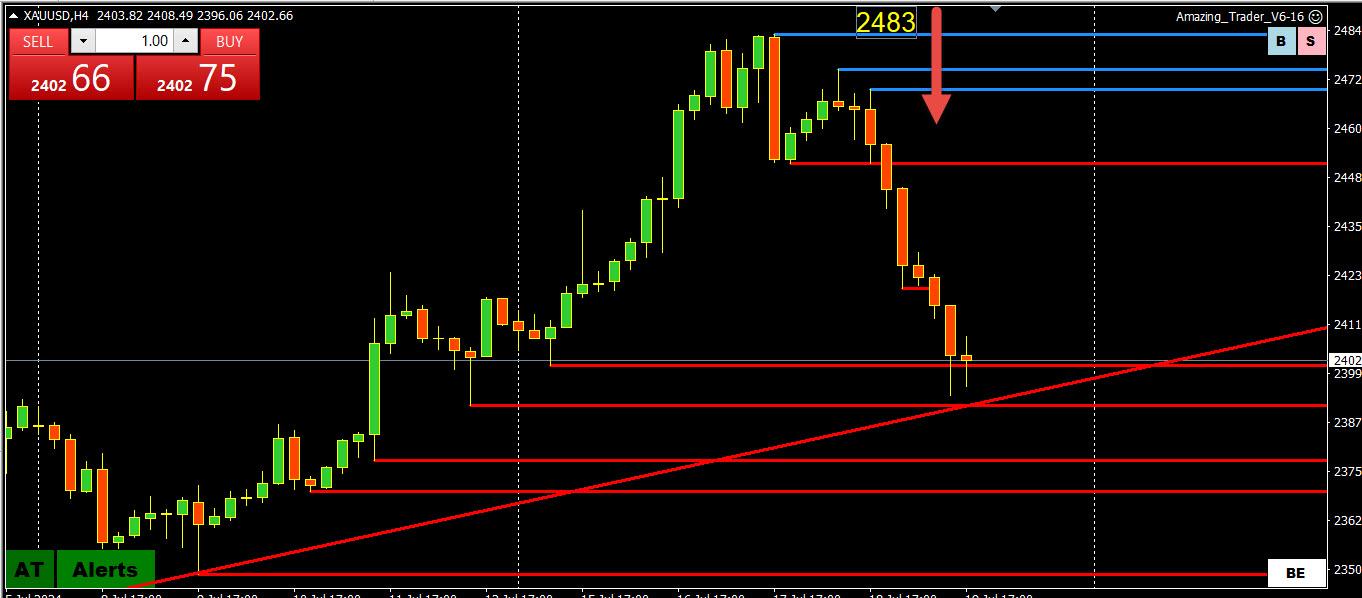
Note the top 2 blue lines, the first indication of a potential top and change in direction.
Often after a third line, you will see an acceleration, in this case to the downside and you can see what followed.
This is a 4 hour chart but the same patterns work on any time frame, 5. 15. 30 etc.
Now let me tie this together.
Do you remember what I said about the importance of the high and low of the day or time frame chart.
This is the only level where there are stops to run., If the market cannot break to a new high or low, it will lose interest on that side and probe the other side in search of stops.
This is what happened in gold after breaking to a new record high.
This is a simple and common sense way of looking at trading. You can use any charting application to apply it. I find The Amazing Trader is the clearest way to identify a pattern.
We will cover the finer details in a later discussion/
July 18, 2024 at 7:51 pm #9338LIQUIDATING MARKET
As we are in the early stages of the club and before I start going into specific strategies, I want to re-emphasize that my main goal when I trade is to identify what side to trade and that includes what type oif market.
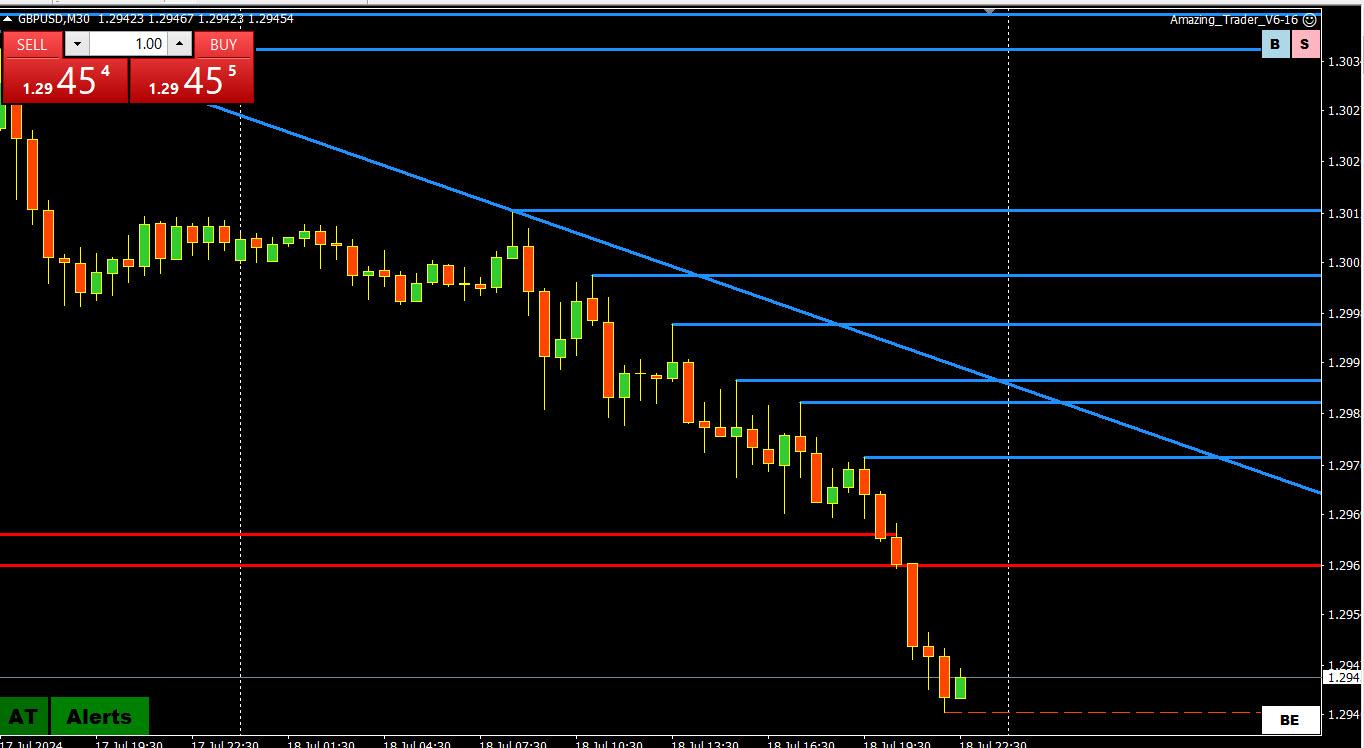
The following 30 minute chart is from July 18, 2024 and is typcial of a liquidting market. Trend has been strong up and after topping out yesterday, we saw a liqudating market today.
Notice how each pause and blip failed, forming another blue Amazing Trader line, which was then followed by a new low. At each poause GBPUSD looked like it was bid. So, you tell me what side of the market was most at risk. Trying to pick a bottom was a sucker bet.
T
I suggest reading this article as it explains what I mean by a liquidating market.What is a Liquidating Market and How to Trade It?
‘July 17, 2024 at 11:56 am #9263Why News Matters Follow Up
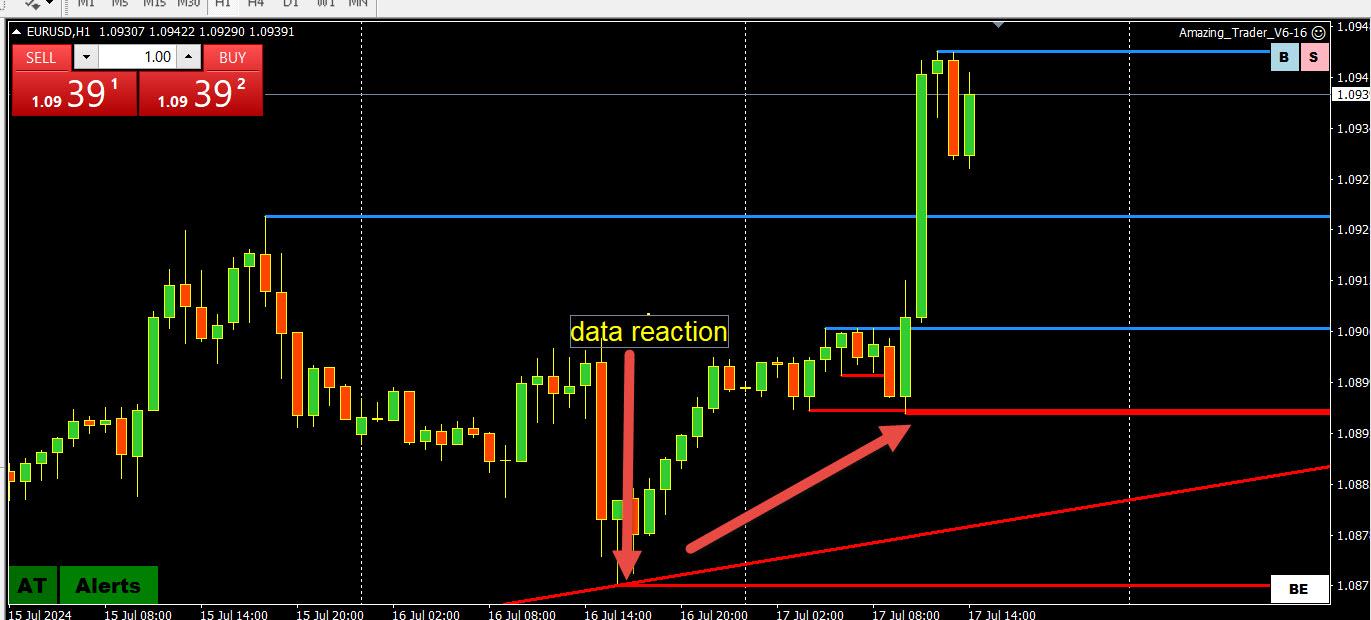
As you can see by this chart the initial reaction to the news did not follow through and an AT Directional Indicator gave a strong signal to the upside, which remained at risk as long as EURUSD stayed above 1.0860 (low was 1.0872)
It is easy to post this with hindsight but the takeaway is if you were on the wrong side when US retail sales came out you would likely have been stopped out.
By keeping your powder dry, you could decide whether to go with the reaction or wait for a sign to go the other way.
‘July 16, 2024 at 12:39 pm #9200Why News Matters
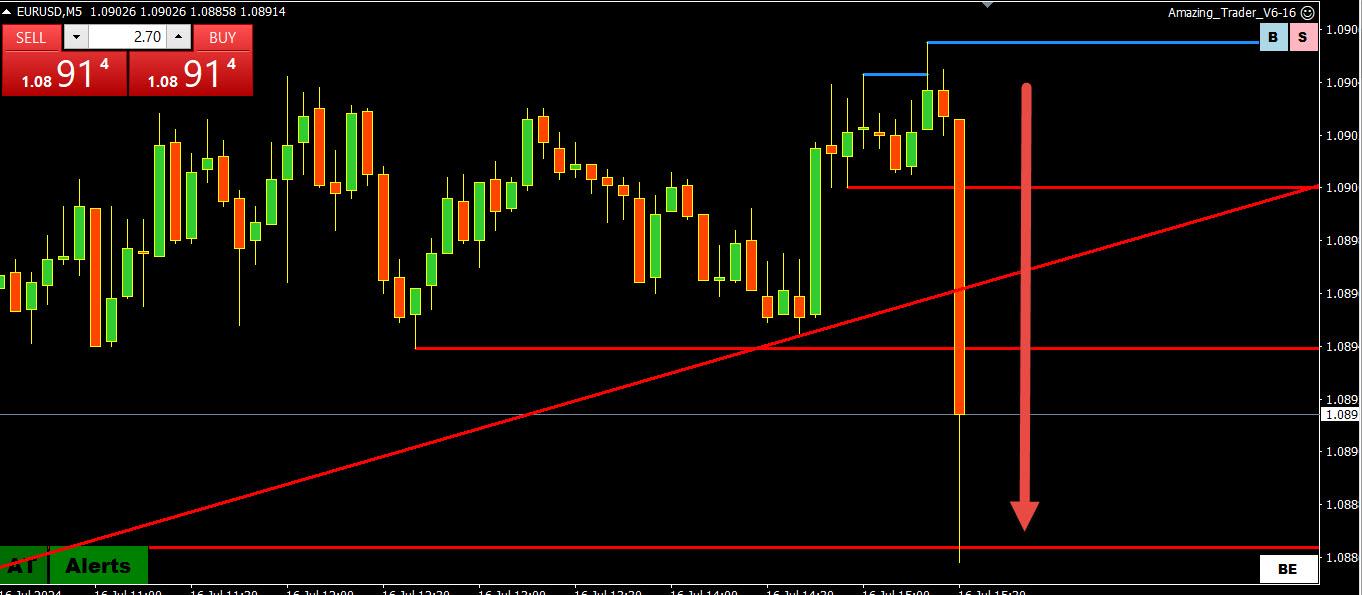
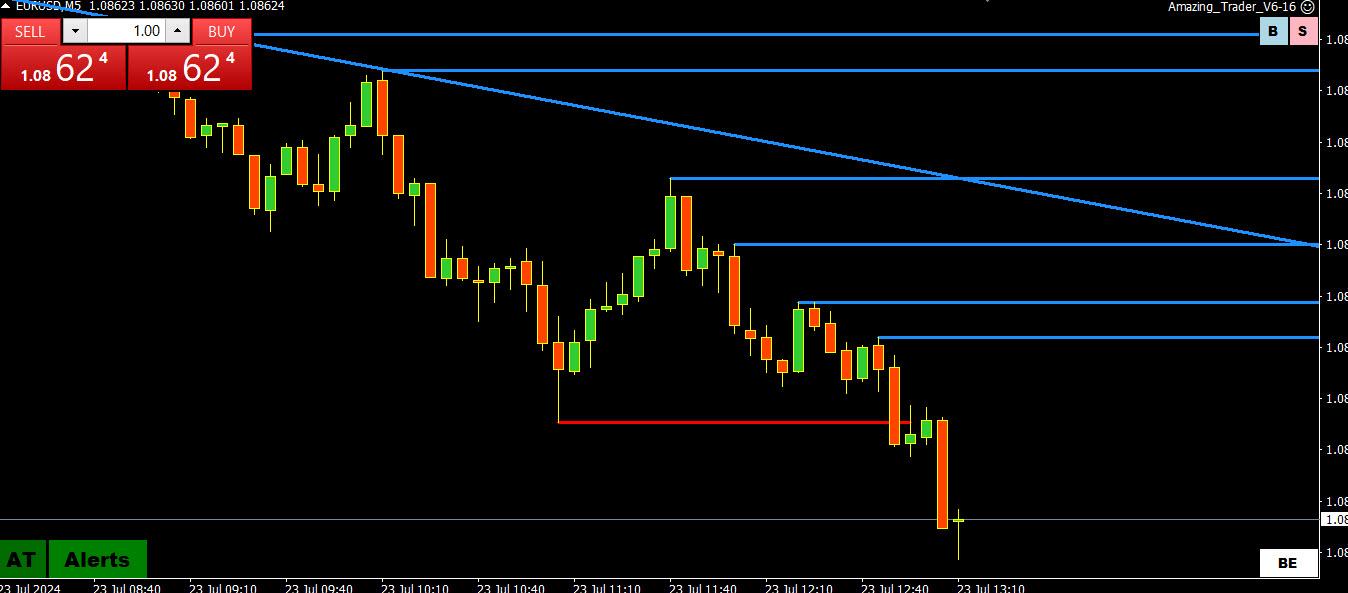
One of my personal trading rules is not to hold positions into data as it only takes a surprise to catch you the wrong way. I prefer to keep my powder dry and then determine whether to go with the reawction oir fade it.
Here is an illustration with a 5 minute EURUSD chart from July 16, 2024 where the market was setup for a weak US retail sales report and then got caught out when the data came in above the consensus
 July 15, 2024 at 10:16 am #9133July 12, 2024 at 2:23 pm #9058
What is Common Sense Trading?
As a trader, you have 3 choices.
1) 100% fundamentals
2) 100% technicals
3) A combination of fundamentals and technicals.
I will assume that most mainly follow technicals and this is where common sense trading comes in.
Many follow technicals, whether it be moving averages, patterns, Elliot waves or anything else with a touch of blind faith.
My approach is to explain why markets move, why what I will share with you works and what the logic is behind it. The more you understand why something works the more confidence you will have using it in live trading.
This is why I call it Common Sense Trading
July 12, 2024 at 11:16 am #9029Let me sum up a common sense approach to trading with 2 statements of fact.
1. Identifying the side to trade is more than half the battle in putting on better odds trades
2. Forex market is always looking to run stops
In forex, I focus on specific chart levels
Why?
Because forex has a common price feed. This means everyone sees around the same prices on their charts. Therefore, one can predict a market reaction if a level holds or is broken since everyone is looking at the same levels on a chart.
FACT: In forex, there is a never ending quest to run stops
You want to position by identifying the side least likely to see stops run against your position. Identifying where stops may be lying is a skill you can develop, especially by using The Amazing Trader.
Where do you find stops?
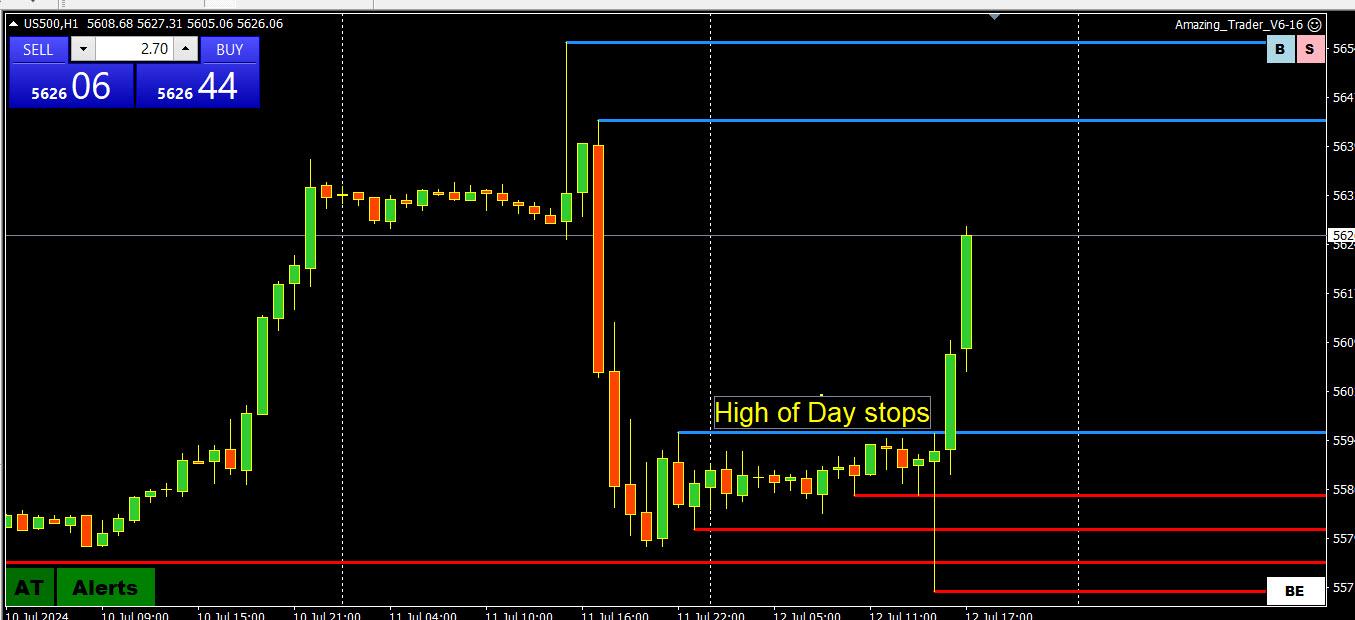
1) Above/below the high/low of the day. Algos will probe the high/low of the day to see if there are stops or not and react accordingly.
2) Above/below the high/low of the current week, prior week, prior month.
3) If in a trend stops often rest above/below the recent high/low in the direction of a trend after there is a retracement off those levels.
4) Stops are often are placed at prior support or resistance after a currency retreats from a high if bounces off a low
5) Market will often probe for stops around the “50” level (e.g. 1.0850, 1.2850, eyc). We will discuss this at a future time.
Here is a a illustration oif stops being run above the high of the day after a retracement of a major uptrend ended.
It is different with CFDs.
Brokers can have different symbols (e.g. NAS100 and NDX100) for the same underlying instrument.
They can also have different price feeds for the same symbol.
So I focus on patterns for CFDs rather than specific levels as there is not a common price feeds.
This just scratches the surface surface but gives you an idea what can drive the forex market,
We will see how to take advantage of this knowledge as we continue this journey.
July 9, 2024 at 11:39 am #8789July 8, 2024 at 9:51 pm #8764July 8, 2024 at 12:56 pm #8724July 7, 2024 at 9:49 am #8665Opening Week Gaps
(Reply to a Q&A)
In addition to using The Amazing Trader to illustrate and discuss the market, I will also share insights you might not find elsewhere.
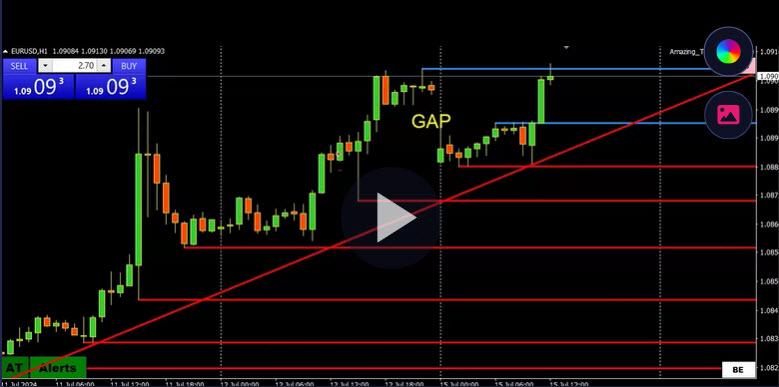
There is a long-time Global-View member who says that opening week gaps in the price of a currency are more often than not filled. He is specifically referring to a gap between the closing week price and the opening price of the next week.
Take a look at this EURUSD chart for the week of July 1, 2024 and note the opening gap on the upside, moved down to fill the gap and then moved sharply higher in the following days.
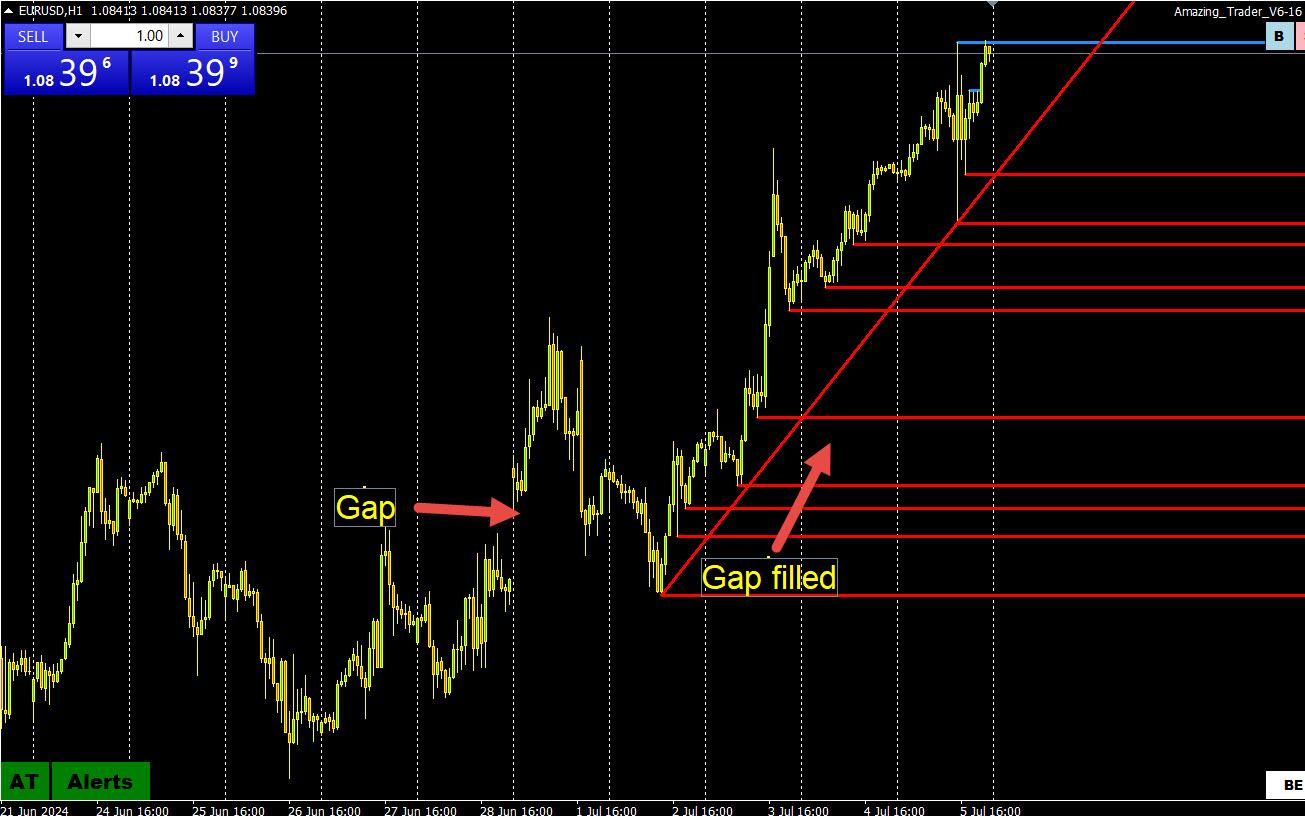
The Amazing Trader charting pattern (red lines) gave confirmation to a bullish risk after the gap was filled (for another discussion).
July 7, 2024 at 7:52 am #8651Why Does Technical Analysis Work?
Most traders use charts to trade but my guess is that few have stopped to ask why the technicals that they use work. Once you understand why, you will be able to anticipate which levels or tehnical indicators should produce a market response, as you will see in this short video and the write up below it.
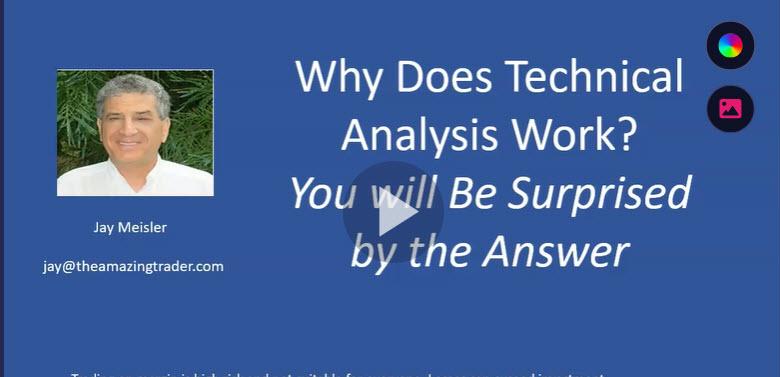
Why does technical analysis work?
The answer may come as a surprise but it will help you to use technical analysis to predict future price action. This is a concept I want you to understand so you can use technical analysis and charts to your advantage.
Some pure chartists may want to take me out and burn me at the stake for heresy as I have a different view of why technical analysis works. Some see it as predictive, like Elliott waves. I see it the opposite. It is not predictive by itself but rather you can use it to predict price behavior and here is the reason why.
There is nothing magic about technical analysis. It works because those who trade and follow markets use it. If they didn’t use it, then it would not be considered useful for trading. Let’s say the 173 day moving average was considered to be more important than the 200 day moving average. There is nothing magic about this level other than it becomes significant because more people use it in their trading.
In other words, the more people who use the same technical indicator, the more significant it becomes, I personally prefer to focus on chart levels, as I explain below, as it becomes easier to predict the reaction when a level holds or is broken.
Models by themselves do not predict future price behavior. Anticipating how technical traders will react to changes in price can give a clue as to market direction and momentum. This is common sense.
So if I am the only one looking at a specific level, does it really matter?
I prefer to focus on specific chart levels as they are more likely to appear on most traders’ charts. As an example, I am keen on using trendlines but I have to keep in mind that my line may differ from others based on my data differing or how I draw it. The same is true for moving averages (depending on what closing rates are used) and retracements (depending on what range and time frame is used). This is why I focus mainly on chart levels as it is easier to predict the reaction knowing others are looking at the same points as well.
For example, let’s say the key support/breakout level on the downside in the EURUSD is 1.0660 seen across multiple time frames. You can then assume there will be a reaction by technical traders if this level holds or is decisively broken.
So why does technical analysis work?
It works because people use it. The more people who use it the more significant it can become. How can you predict price behavior? The first step is to identify key chart levels and then anticipate the reaction if they hold or are broken.
You can find ways to identify key levels on your own but I find the best way for me is by using The Amazing Trader charting algo, which is programmed to use my uncanny ability to identify key chart levels and deliver them to charts in real-time.
In my updates in the Trading Club, I plan to show how to use this knowledge to take advantage of predictable behavior by technical traders and use it to trade.
July 5, 2024 at 2:40 pm #8617Day Trader’s Guide to Beating the Market
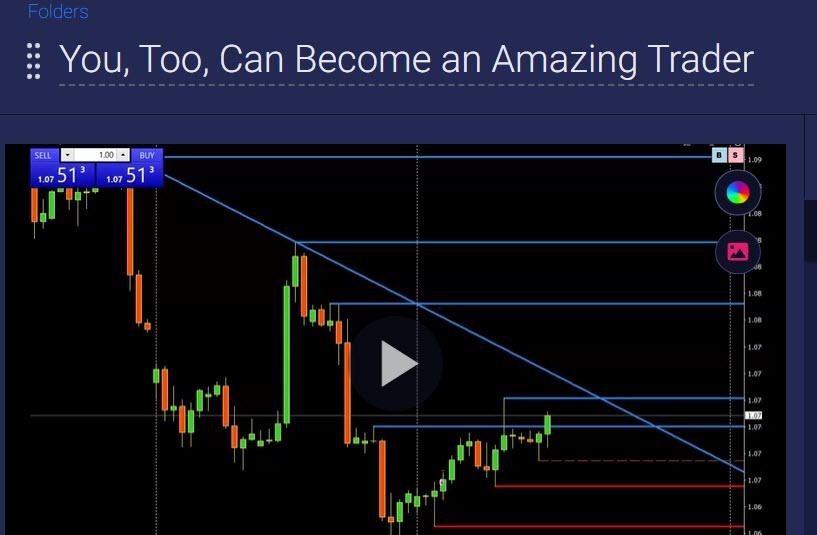
Let’s get started with a video I created to show you a way to look at the market and identify what I call the strong side to trade.
You will find that I take a common sense approach to trading and one that should make sense to you.
If you have any questions post them in the Q&A forum.
If you would like to take a trial for The Amazing Trader, Click Here.
To watch the video click on the image below.
July 4, 2024 at 10:49 am #8576Introduction to the Amazing Trader Classes
and
(A Key to Successful Trading)
Trading is not rocket sciecne.
It is all about odds and the ability to put them in your favor by identifying what I call the strong side (i.e. side least likely to get stopped out) at any point in time.
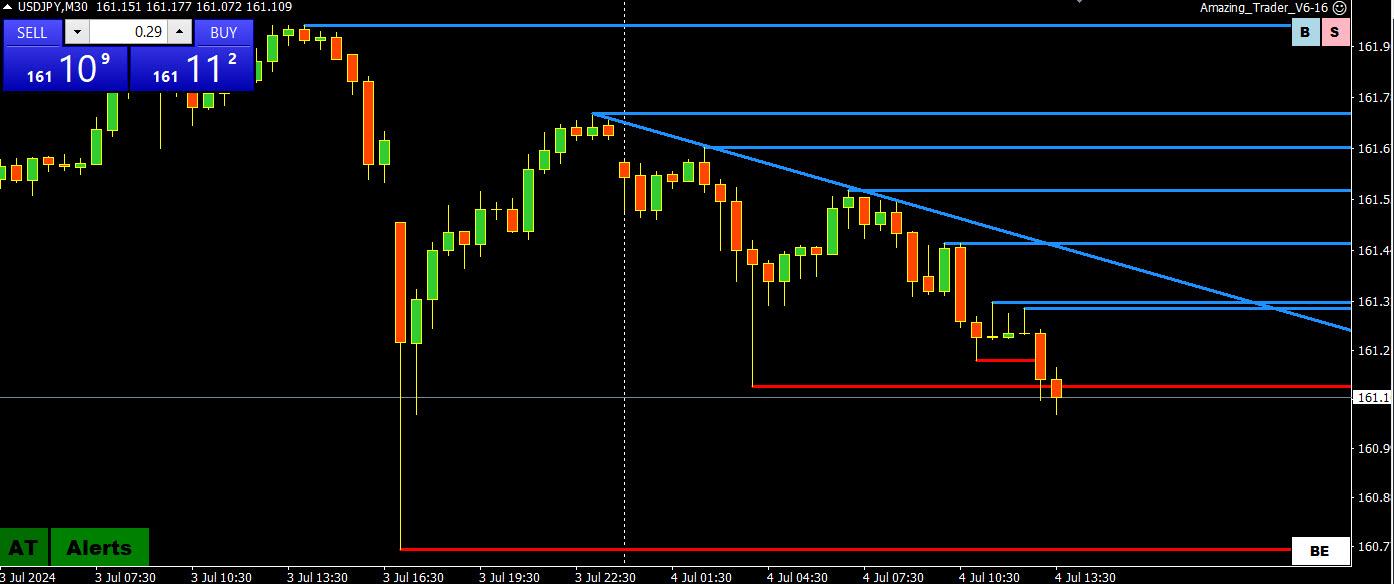
In my discussions you will see me using my Amazing Trader charts, which come from an algo I created.
My approach is to keep it simple with a logic that will make sense and is easy to follow.
I will also share insights from my many years of trading that you might not find elsewhere.
I will share how to identify the risk, what side to trade, and a strategy to put this knowledge into practice. You can use the same logic with your charts but you find it easier using The Amazing Trader program.
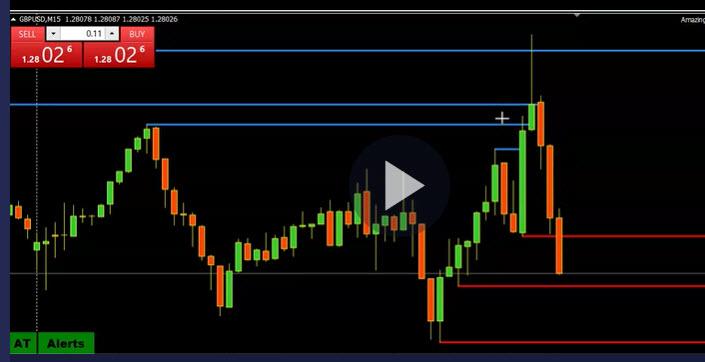
This is what one of my charts looks like.
And here is what I see as… (click on the image below)
 July 3, 2024 at 6:40 pm #8547
 -
AuthorPosts

- You must be logged in to reply to this topic.
Search
© 2024 Global View