
-
AuthorSearch Results
-
November 5, 2026 at 10:29 am #45090
In reply to: Forex Forum
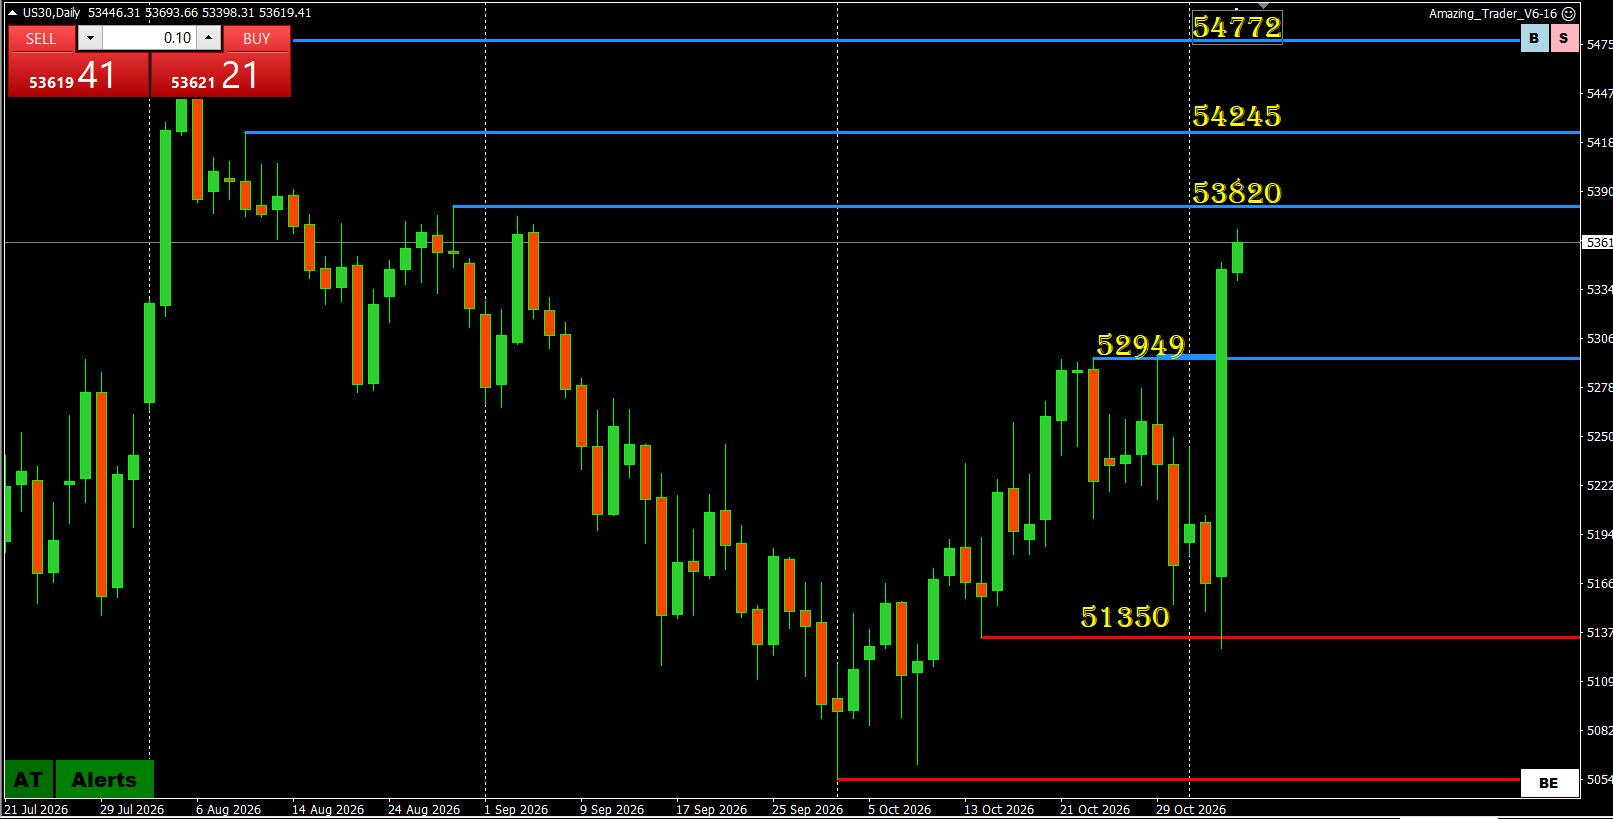
US30 (DJIA) DAILY (CFD): Outperforming
After outperforming yesterday with the best post-midterm day performance in 44 years, US30 is so far doing the same today. This has put it into a critical zone with 53820 and 54245 as obstacles to the record 54662 high. On this chart, needs to hold above 52949 to keep a bid pointed at key levels.
 October 27, 2026 at 2:04 pm #44857
In reply to: Forex Forum
October 22, 2026 at 3:39 pm #44792In reply to: Forex Forum
August 4, 2026 at 5:16 pm #42388In reply to: Forex Forum
July 28, 2026 at 6:38 pm #42105In reply to: Forex Forum
July 27, 2026 at 8:52 pm #42067In reply to: Forex Forum
July 2, 2026 at 7:27 pm #41397In reply to: Forex Forum
June 29, 2026 at 1:52 pm #41283In reply to: Forex Forum
Market Updatre
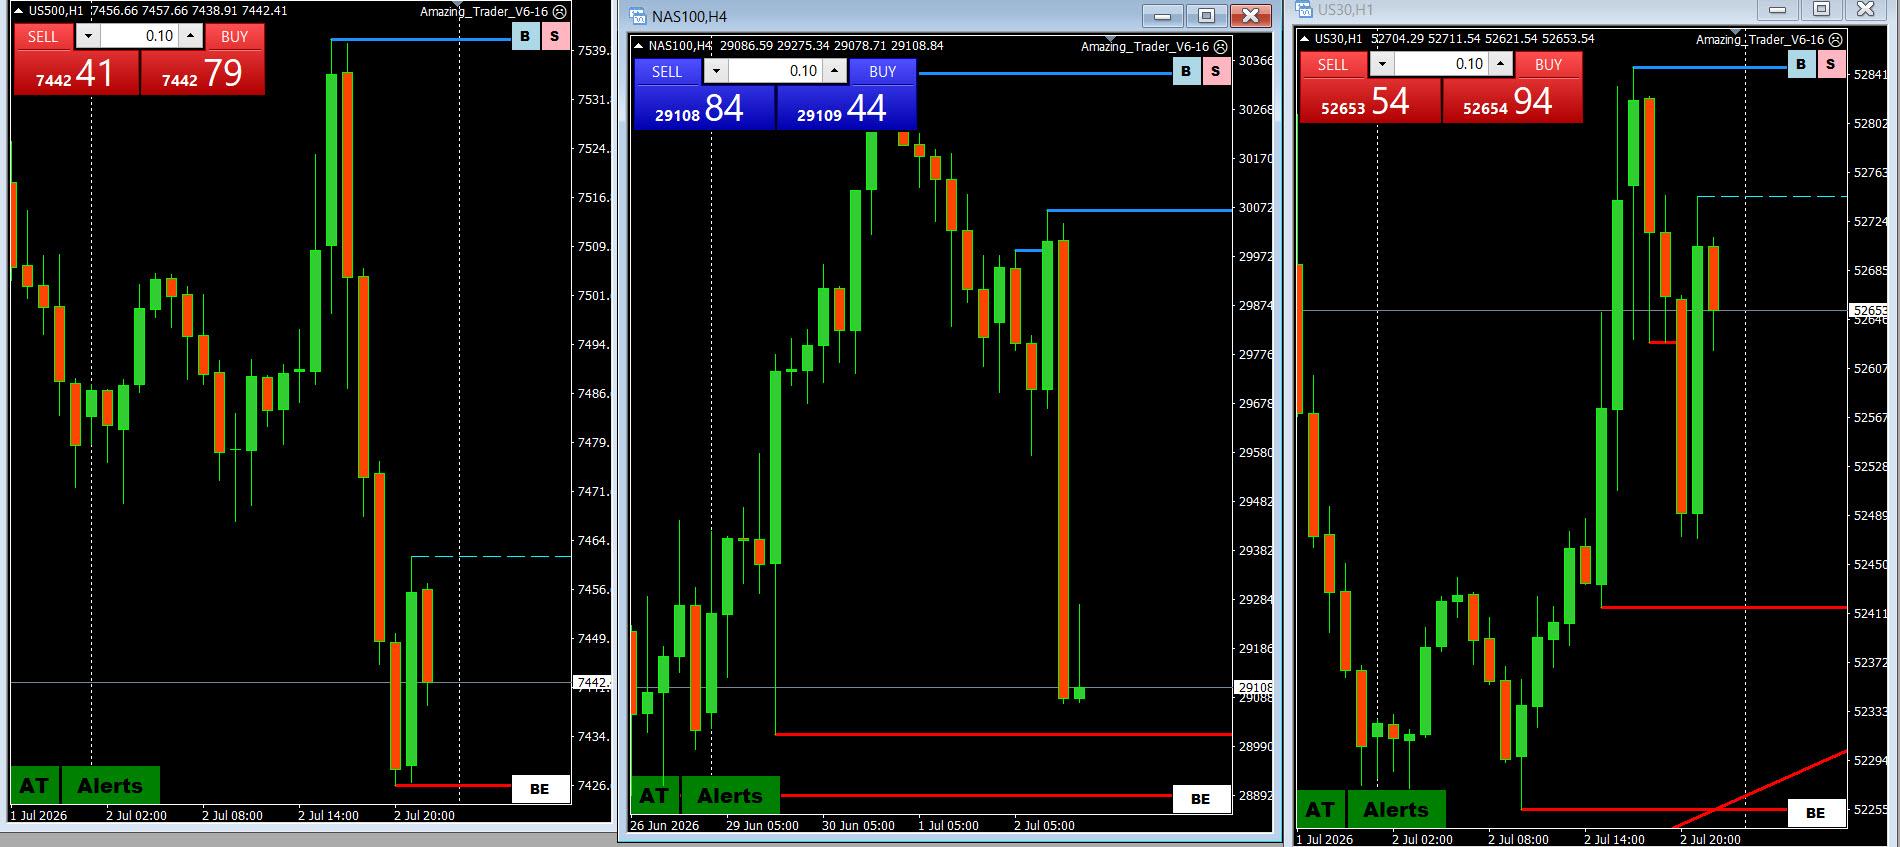
US stocks trading firmer (only Russsell is down) as last week’s rotations (into DJIA and away from tech) take a breather. Moves so far seeing limited follow trhrough (see charts) with geopolitical uncertainty and month/quarter end looming.
mODEST UPTICK in yields and crude oil non-factors in equities so far.
US500 NAS100 US30
\ June 24, 2026 at 12:08 pm #41186
In reply to: Forex Forum
US PRE-MARKET MOVERS: Mag-7, HTZ, CBRS, FDX, GOOG, GME, TTWO, MU, Samsung Electronics
ES +0.2% NQ +0.5% RTY +0.2%Mag 7: AAPL +0.8% NVDA +0.7% TSLA +0.6% GOOGL +0.5% META +0.1% AMZN -0.1% MSFT -0.6%
HTZ -20.5%: Files for offering of up to $100mln shares of common stock & disappointing guidance
CBRS -13.5%: Sees decline in GMs, overshadowing strong rev. growth
FDX -7.5%: Weaker-than-exp. profit guidance overshadowed stronger Q4 results & mgmts. positive comments on transformation efforts
GOOG +0.3%: To replace $VZ in the DJIA, effective BMO on June 29th
GME +0.8%: CEO Cohen will forgo potential $35bln performance pay package to focus on his bid to acquire EBAY
TTWO +3%: Pre-order of GTA 6 begins on June 25th
MU +3.5%: Ahead of earnings after-hours
Samsung Electronics plans a $58.61bln share buyback linked to employee stock bonuses
<p style=”text-align: center;”>Source: Try Newsquawk free for 7 days</p>May 6, 2026 at 5:03 pm #39860In reply to: Forex Forum
February 6, 2026 at 8:58 pm #36150In reply to: Forex Forum
Feb 6 (Reuters) – Wall Street jumped on Friday and the Dow Jones Industrial Average hit a record 50,000 points, while Nvidia and other chipmakers soared and Amazon tumbled after the cloud heavyweight forecast a sharp increase in spending on AI infrastructure….
…Chip stocks rallied on expectations they would benefit from increased spending on AI data centers by Amazon and Alphabet….
US30 (DJIA) DAILY CHART
 February 6, 2026 at 7:25 pm #36142
In reply to: Forex Forum
February 5, 2026 at 9:00 pm #36101In reply to: Forex Forum
January 10, 2026 at 5:08 pm #35202In reply to: Forex Forum
2026 Global Markets Scorecard
Consensus forecasts to start 2026 were calling for firmer US stocks, firmer Gold, a weaker dollar, most notably vs the JPY based on divergent monetary policies between the BoJ and the Fed, and a dollar and sharply higher Bitcoin,
Scorecard after the first full week of trading (focus in 2nd week will be on whether momentum builds further):
- US stocks (up): DJIA and US500 setting record highs while NAS100trying to play catch up.
- Gold: Closed the week at 4500, putting the record 4549 high on the radar.
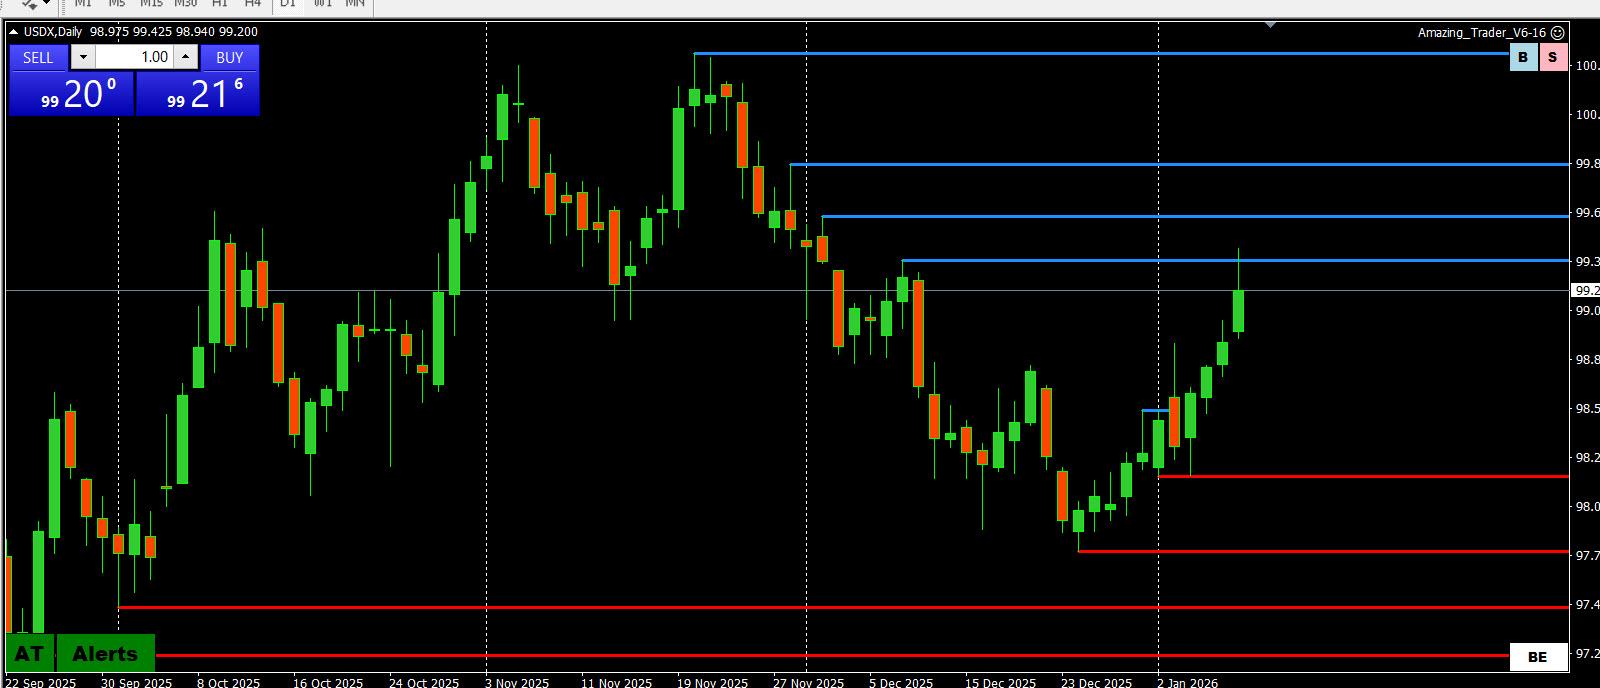
- US dollar: Confounding the consensus by ending the week on a firm note.
- Bitcoin: Disappointing start after not able to sustain a breakout from its congestion range.
Test now comes in the second week where SCOTUS will issue its ruling on the legality of tariffs on Wednesday. In addition, Trump’s choice of a new Fed Chair can be announced at any time (perfect for a distraction).
USDX (US DOLLAR INDEX) DAILY CHART
 January 7, 2026 at 2:35 pm #35097
In reply to: Forex Forum
December 11, 2025 at 10:39 pm #34405In reply to: Forex Forum
November 14, 2025 at 6:56 pm #33313In reply to: Forex Forum
November 12, 2025 at 6:57 pm #33198In reply to: Forex Forum
November 12, 2025 at 1:20 pm #33183In reply to: Forex Forum
November 12, 2025 at 12:12 pm #33179In reply to: Forex Forum

Trading tip: Testing strength of trend
-
- The test of the strength of a trend is whether a retracement is followed by a new high (low) with the trend.
- If not, then it gives a clue as well the other way (i.e. retracement or consolidation)
- The same principle applies to intra-day trendS
Test of trend strength:
-
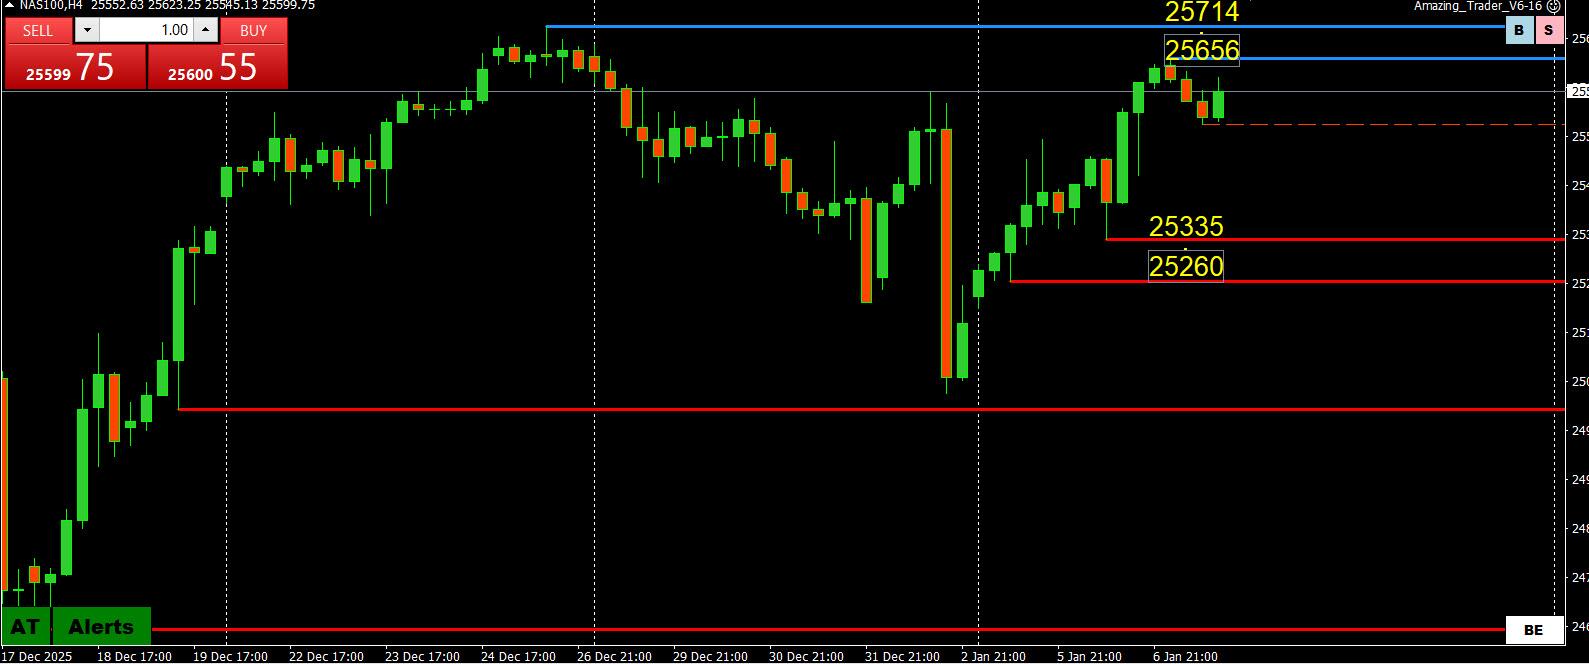
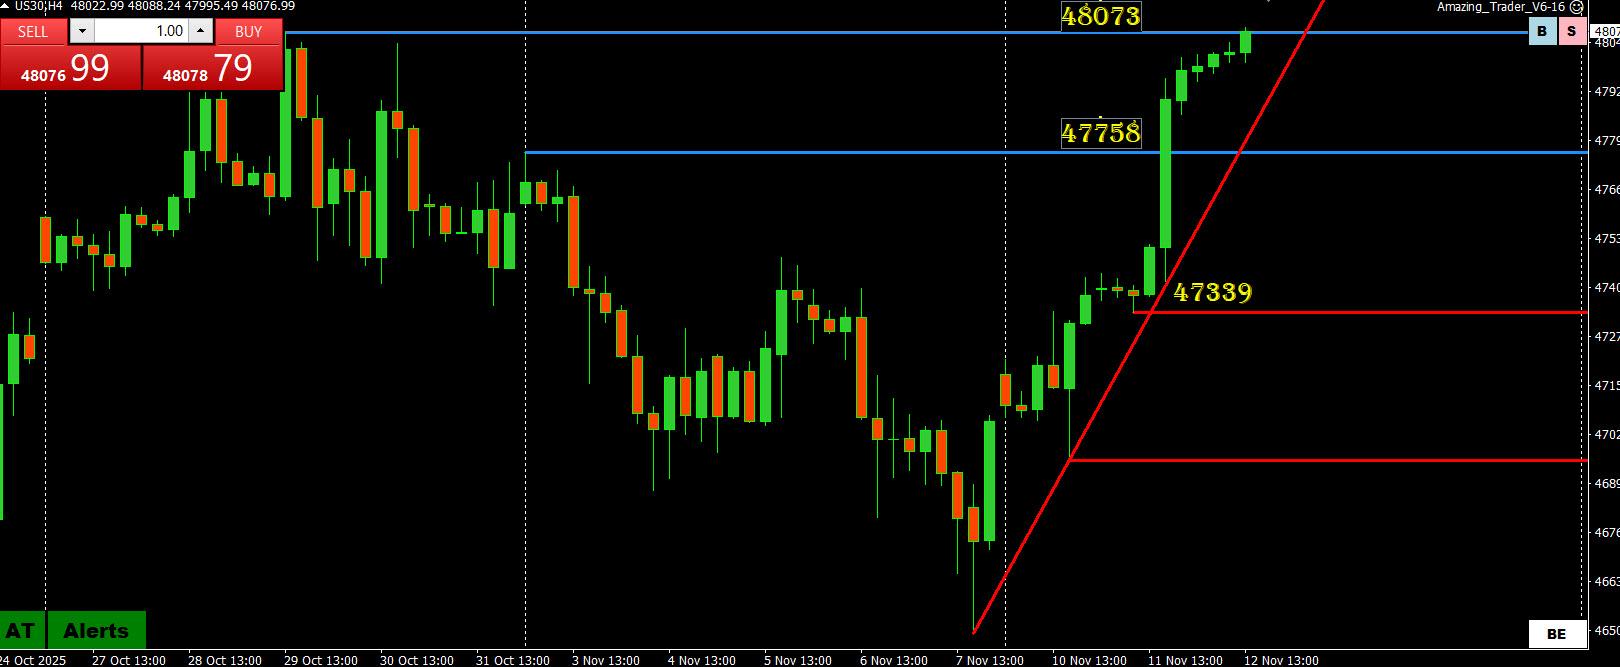
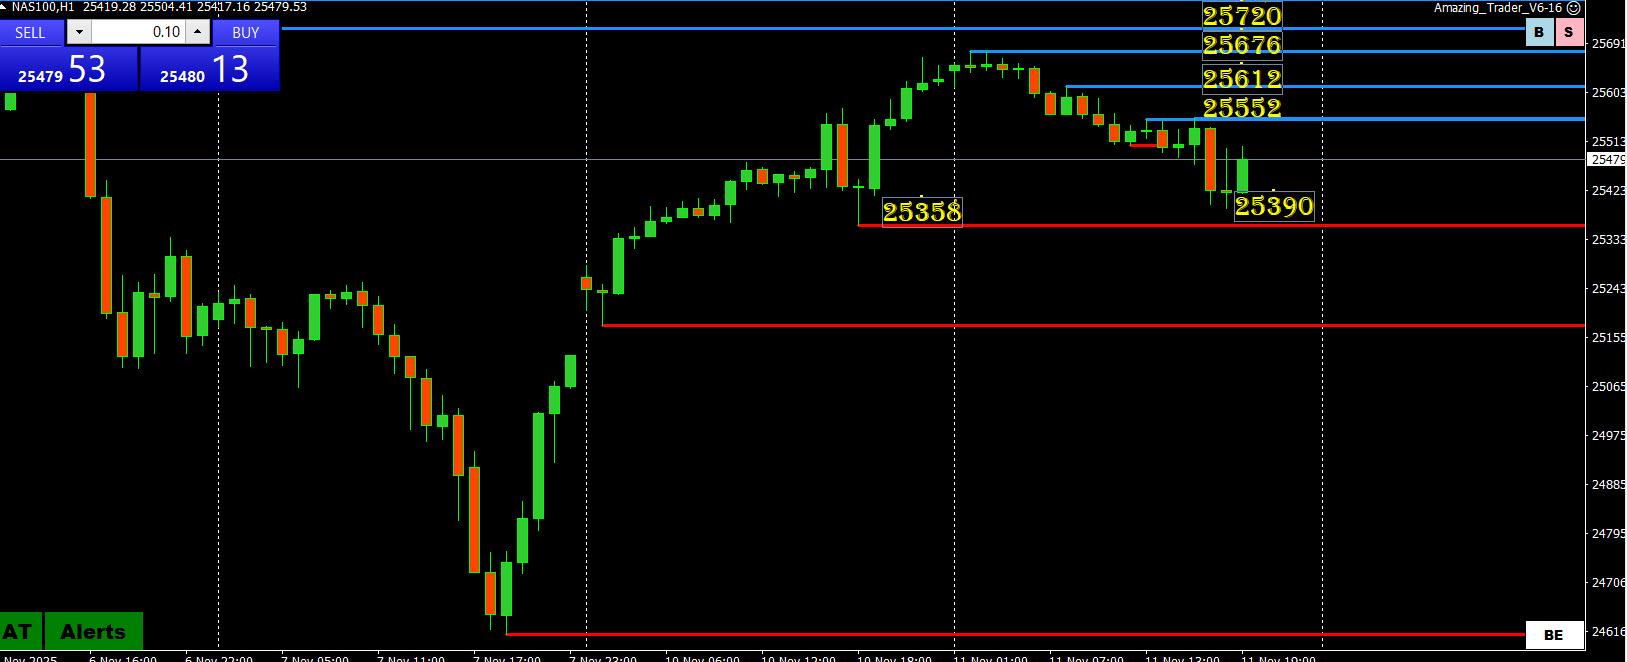
- DJIA has passed with a new record high (ON CASH BUT NOT US30)
- Jury is out on US500 and NAS100 as they rebound from the recent retracements
November 11, 2025 at 5:39 pm #33151In reply to: Forex Forum
September 12, 2025 at 3:28 pm #30667In reply to: Forex Forum
What’s hot and what’s not?
Feels like a TGIF market
What’s hot?
Dollar fis up on the day but off highs
Gold is up but still consolidating
Crude oil is up
What’s not?
Currencies are weaker on the day vs. the USD but off the lows
Bonds are down (yields are up)
What’s hot/not?
Stocks are mixed: NASDAQ up, DJIA down, SP500 about flat
 August 20, 2025 at 3:28 pm #29331
In reply to: Forex Forum
What’s hot and what’s not?
What’s hot?
The dollar is mixed with winners (hot) and losers (cold) in a risk off market
Winners: CHF, JPY, EUR
GOLD is up
Bitcoin is up
US bonds are firmer (yields down)
What’s not?
Losers: GBP, AUD, NZD are weaker vs the USD
US stocks are down again (except DJIA)
Next focus: FOMC minutes
 August 11, 2025 at 3:03 pm #28797
In reply to: Forex Forum
What’s hot and what’s not?
What’s hot?
USD is firmer across-the-board… EURUSD has dipped back below 1.16, USDJPY testing 148
US bonds (yields down slightly but off earlier lows)
Bitcoin is up but off earlier high after spiking higher
What’s not?
All currencies other than the dollar
Gold is down sharply after failing to hold 3400
What’s Hot/Not?
US stocks mixed, NAS up, SP500 and DJIA down slightly
Will see if US CPI is hot or not on Tuesday.
 July 8, 2025 at 3:09 pm #27236
In reply to: Forex Forum
July 1, 2025 at 4:53 pm #27005In reply to: Forex Forum
June 27, 2025 at 3:33 pm #26858In reply to: Forex Forum
Nike Up Over 15%, Best Performer in the DJIA and S&P 500 SO Far Today
NIKE, Inc. Class B (NKE) is currently at $72.07, up $9.53 or 15.23%
· Would be highest close since March 19, 2025, when it closed at $72.99
· On pace for largest percent increase since June 25, 2021, when it rose 15.53%
· Currently up five of the past six days
· Currently up two consecutive days; up 18.47% over this period
· Best two-day stretch since the two days ending March 25, 2020, when it rose 25.81%
· Up 18.94% month-to-date; on pace for best month since Dec. 2000, when it rose 30.94%
· Down 4.76% year-to-date
· Down 59.4% from its all-time closing high of $177.51 on Nov. 5, 2021
· Down 4.38% from 52 weeks ago (June 28, 2024), when it closed at $75.37
· Down 19.42% from its 52-week closing high of $89.44 on Sept. 27, 2024
· Up 35.29% from its 52-week closing low of $53.27 on April 8, 2025
· Traded as high as $72.84; highest intraday level since March 20, 2025, when it hit $73.65
· Up 16.47% at today’s intraday high; largest intraday percent increase since Dec. 17, 1999, when it rose as much as 21.47%
· Best performer in the DJIA today
· Best performer in the S&P 500 today
· Second most active stock in the S&P 500 today
· Contributed 58.58 points to the DJIA so far today
 June 5, 2025 at 2:15 pm #25883
In reply to: Forex Forum
May 13, 2025 at 6:06 pm #24793In reply to: Forex Forum
April 17, 2025 at 4:11 pm #22763In reply to: Forex Forum
-
AuthorSearch Results






Search
© 2024 Global View