
- This topic has 27,906 replies, 54 voices, and was last updated 3 hours, 8 minutes ago by GVI Forex 2.
-
AuthorPosts
-
March 26, 2024 at 1:12 pm #3624
Light calendar but some US data is coning out (Durable Goods, Ci=onsumer Confidence)
See our Economic Calendar
March 26, 2024 at 11:53 am #3622March 26, 2024 at 11:45 am #3621March 26, 2024 at 11:20 am #3620GBPUSD 4 HOUR CHART – Pre-Easter trading continues
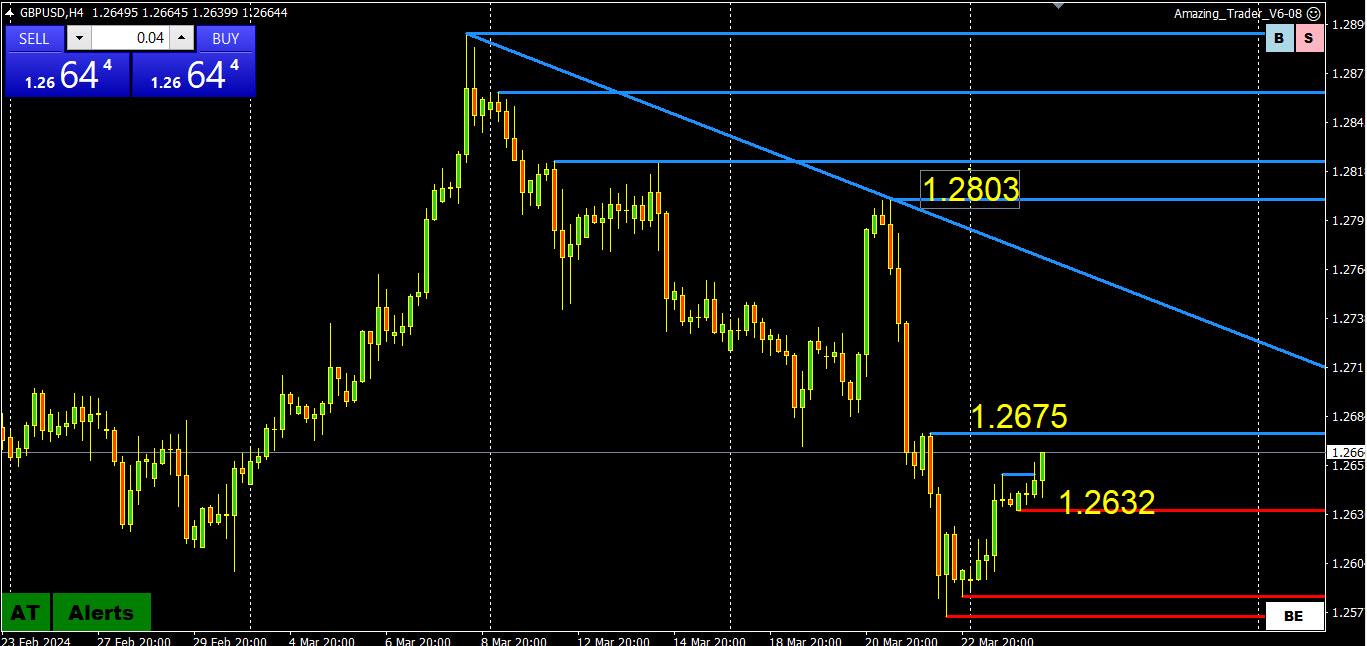
GBPUSD remains in a retracement mode and as this chart shows key levels are not until the trendline and 1.2803
Immediate resistance is at 1.2675, an inviting but so far elusive target..
Support at 1.2632 needs to hold to keep thoughts away from 1.26.
March 26, 2024 at 10:18 am #3609EURUSD 1 HOUR CHART – BID IN AN OFFERED MARKET OR WHAT?
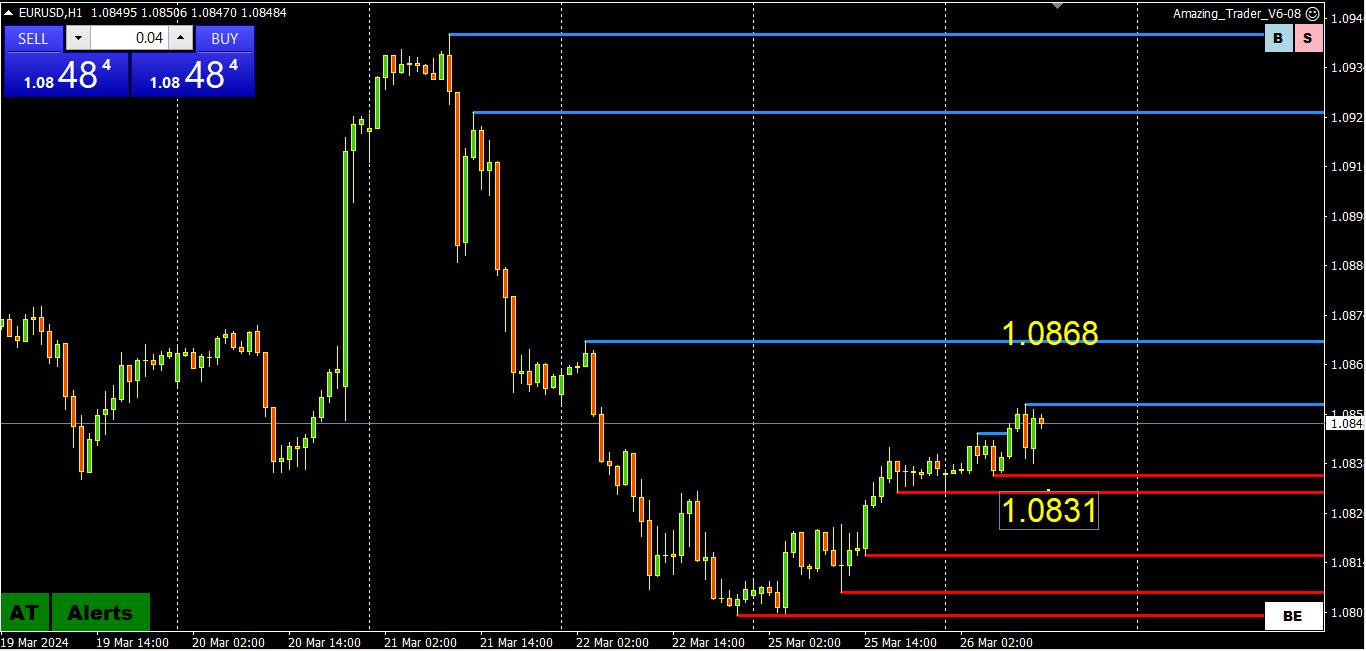
Having held a test of 1.08 EURUSD gas tested the pivotal 1.0850 level in a pre-Easter week, the bounce has tested the pivotal (more psychological than technical) level at 1.0850, also the midpoint of 1.08-1.09.
There seems little incentive to push too hard unless a solid 1.0850+ trades, which would put the key 1.0868 level in play.
Otherwise, range is to 1.0831, which was also a resistance from Friday with support seen as long as it holds..
March 26, 2024 at 2:48 am #3608USDJPY Update: Trend Line Break and Support Levels
The recent price action in USDJPY has seen a break below the ascending trend line on the 4-hour chart, indicating that a prolonged consolidation phase for the uptrend starting from 146.47 is currently in progress.
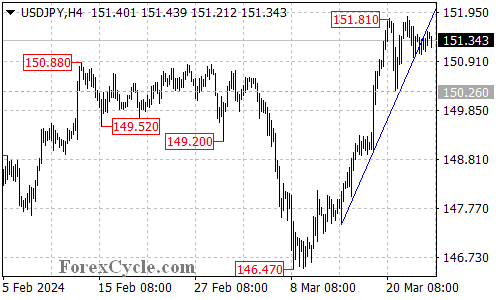
As long as the critical support level at 150.26 remains intact, there is potential for the upward momentum to resume, with the possibility of further advancement towards the 170.00 region following the consolidation period.
The initial support level to monitor is at 150.95. If this level is breached, it could lead to a test of the key support at 150.26. Only a decisive breakdown below this pivotal level would suggest the potential completion of the uptrend that originated from 146.47.
March 26, 2024 at 12:42 am #3606March 25, 2024 at 9:57 pm #3605AUDUSD 4-HOUR CHART – Consolidation or Correction?
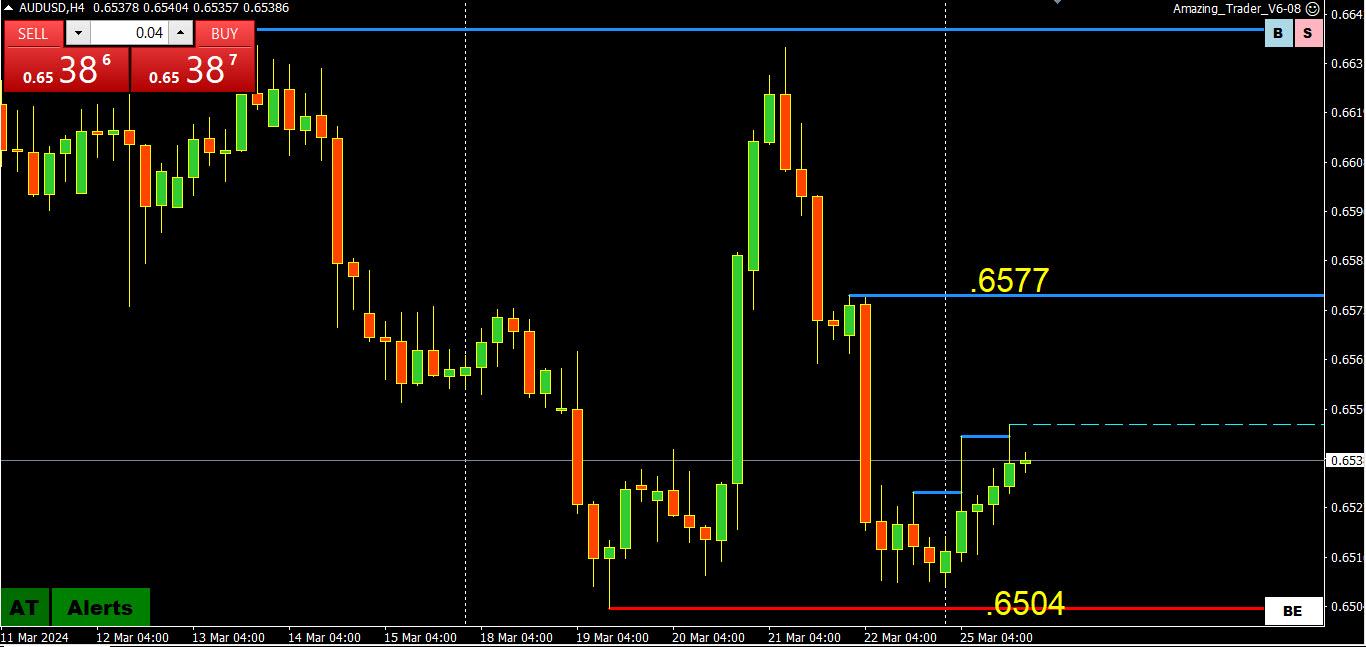
The market has started out in typical pre-Easter week fashion with some position adjustments dominating.
AUDUSD failure to test .6500 has seen a modest retracement that would need to take out .6577 to give it some legs.
Otherwise, expect some choppy consolidation trading while within .6599094 and .6577.
March 25, 2024 at 8:53 pm #3603March 25, 2024 at 6:42 pm #3602March 25, 2024 at 6:35 pm #3601March 25, 2024 at 5:36 pm #3596March 25, 2024 at 4:52 pm #3594March 25, 2024 at 4:43 pm #3592I filled sells in Usd vs Chinese Yuan and Signapore Dollar just before the close Friday (see post that day) which paid off nicely with the Chinese Central Bank making their announcement in Asia Sunday. I now have resting buy side orders below current market in Usd vs both, and Swedish Krone. Dollar is in sell mode but it won’t last forever in my view.
March 25, 2024 at 3:47 pm #3586March 25, 2024 at 3:34 pm #3585March 25, 2024 at 3:30 pm #3584BTC 4-HOUR CHART
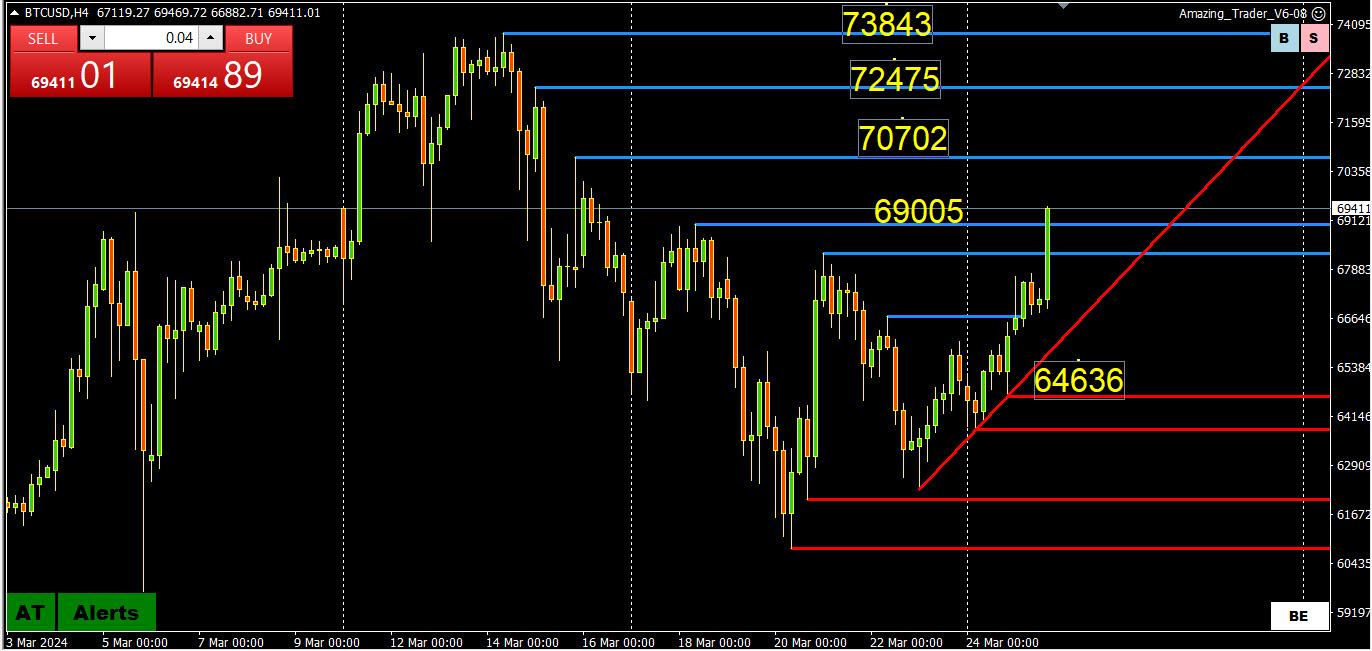
i was asked to post a BTC chart.
‘
The move up looks logical using the AT red lines, but it feels more like a video game than trading in the forex market.
‘
In any case, it has held off a retracement aboce 60000 but would need to take out the record high to signal a new leg up.As I have said before, using my magic numbers (60000, 65000, 70000), they act as a good guide beyond just looking at technical levels in this crypto pair.
March 25, 2024 at 3:16 pm #3583March 25, 2024 at 2:01 pm #3582March 25, 2024 at 2:00 pm #3581March 25, 2024 at 1:56 pm #3580May see buyers around S/P futures 5263 if seen which would support the potential for EurUsd 1.0800 holding. Market appears to be headed for Dxy 104.05 which would support the potential for EurUsd to cap if/when it does. Key close in points in our model. If compromised that should lead to follow through. Just a close in perspective.
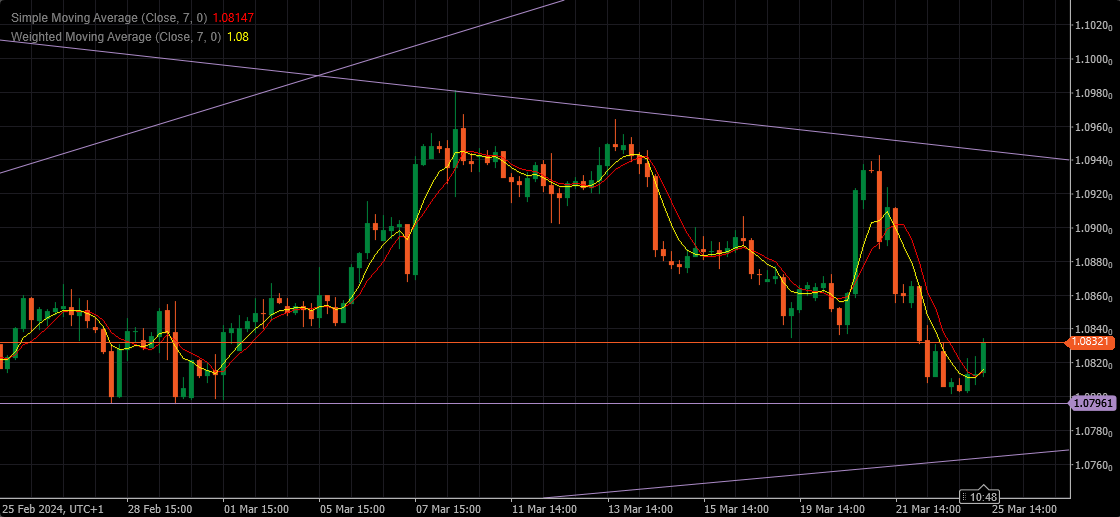
March 25, 2024 at 1:56 pm #3579EURUSD 4H
Resistances at 1.08400 1.08550 and 1.08850
Supports at 1.07950 and 1.07650
The main question here is : Is this an Uptick prior to the continuation of down trend, or a beginning of formation for next push Up.
Not much of data this week – till Thursday – Economic Calendar, so the moves would be dictated mainly technically .
Currently – Intraday – we should treat 1.08200 as a pivotal .
 March 25, 2024 at 1:53 pm #3578
Coming back to JPs question of the page resets while typing out a post -> Does this also apply to the charts page? It seems that I can set up a page with parameters set on a currency pair and it’s time frame, only to have it reset to eur/usd daily every time the page refreshes. Is it possible to avoid this? If so, how?
March 25, 2024 at 1:40 pm #3576March 25, 2024 at 12:09 pm #3567GBPUSD 4 HOUR CHART
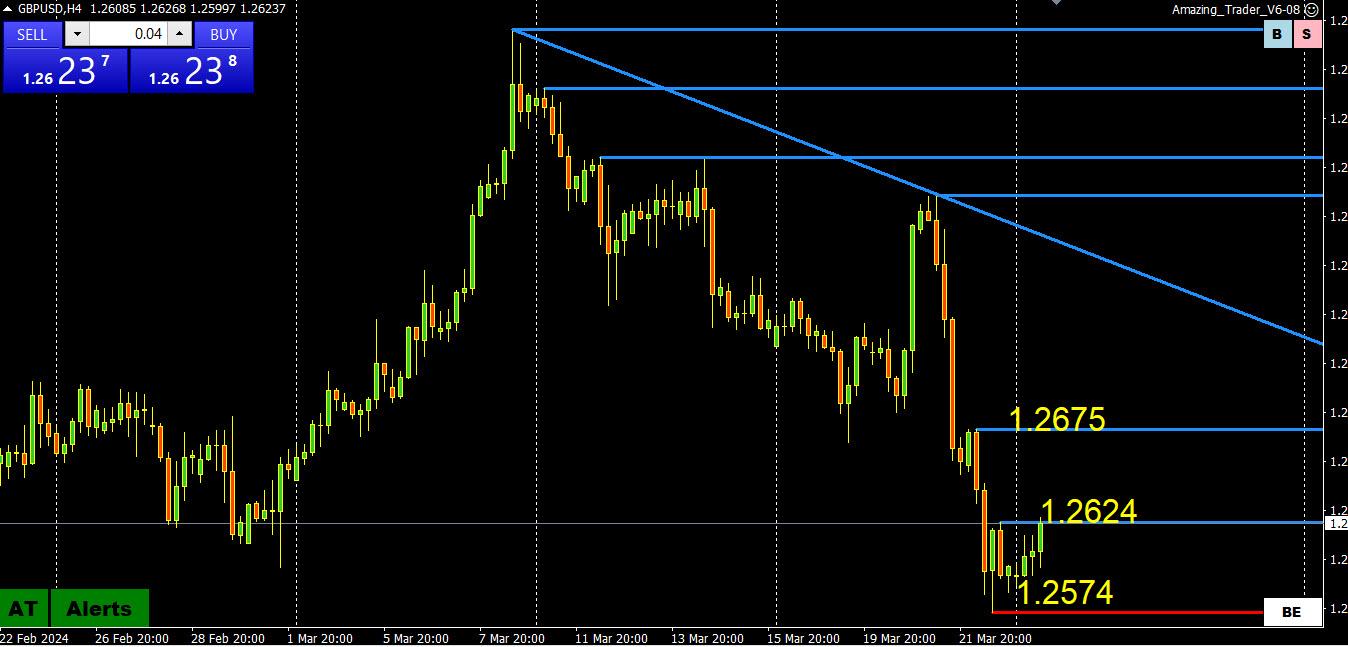
GBPUSD bounce off its 1.2574 low is so far just a retracement. To suggest a low is in, 1.2675 would need to be taken out, Currently, resistance at 1.2524 is being tested but this is only a minor level.
Note, EURGBP has backed off from .8600 and this has eased some of the selling pressure on GBPUSD.
March 25, 2024 at 12:05 pm #3566March 25, 2024 at 10:22 am #3563Verbal intervention earlier with USDJPY still within reach but staying below 151.90, a 32 year high.
Japan’s top currency diplomat on Monday warned against speculators trying to sell off the yen, saying its weakness did not reflect fundamentals, in the latest warning about the currency’s “big slide” against the dollar….CNBC
March 25, 2024 at 9:45 am #3562March 25, 2024 at 9:22 am #3561March 25, 2024 at 6:03 am #3560USDCHF Analysis: Consolidation and Support Levels
USDCHF has maintained its position above the ascending trend line on the 4-hour chart, indicating that the pair is still in an uptrend starting from 0.8729. The upward movement from 0.8729 has reached as high as 0.9019.
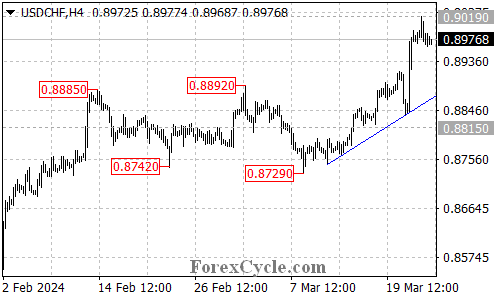
The subsequent retracement from 0.9019 suggests that the pair is currently undergoing a period of consolidation for the uptrend. It is expected that the pair will trade within the range of 0.8900 and 0.9019 in the coming days.
If the support level of 0.8900 remains unbroken, the bullish trend could be expected to resume, with a breakout above the 0.9019 resistance level potentially triggering another upward movement towards 0.9100 and 0.9180.
On the downside, a breakdown below the 0.8900 support level could indicate that a longer period of consolidation for the uptrend starting from 0.8729 is necessary. In this scenario, the pair would likely find support at the rising trend line on the 4-hour chart.
It is important to note that only a decisive break below the trend line support would suggest the potential completion of the current uptrend.
-
AuthorPosts
- You must be logged in to reply to this topic.
Search
© 2024 Global View