
- This topic has 28,366 replies, 54 voices, and was last updated 1 hour, 6 minutes ago by GVI Forex 2.
-
AuthorPosts
-
December 23, 2024 at 12:22 pm #16671
USD catching A BID…FOCUS OF US data out today is Conference Board Consumer Confidence, expectrd to show a rise
December 23, 2024 at 11:31 am #16668December 23, 2024 at 11:07 am #16667NEWSQUAWK US OPEN
European equities mostly lower while US futures gain, USD firmer ahead of data
Good morning USA traders, hope your day is off to a great start! Here are the top 4 things you need to know for today’s market.
4 Things You Need to Know
European bourses are mostly lower, US futures higher with modest outperformance in the NQ.
Dollar is firmer and holding around 108.00, GBP little changed after UK shows no growth in Q3.
Bunds & Gilts pressured in thin trade, USTs flat into data.
Gas heats up on updates out of Qatar and Russia; Crude/XAU flat.
December 23, 2024 at 10:29 am #16665December 23, 2024 at 10:05 am #16664EURUSD 1 HOUR CHART – THAT TIM,E OF YEAR
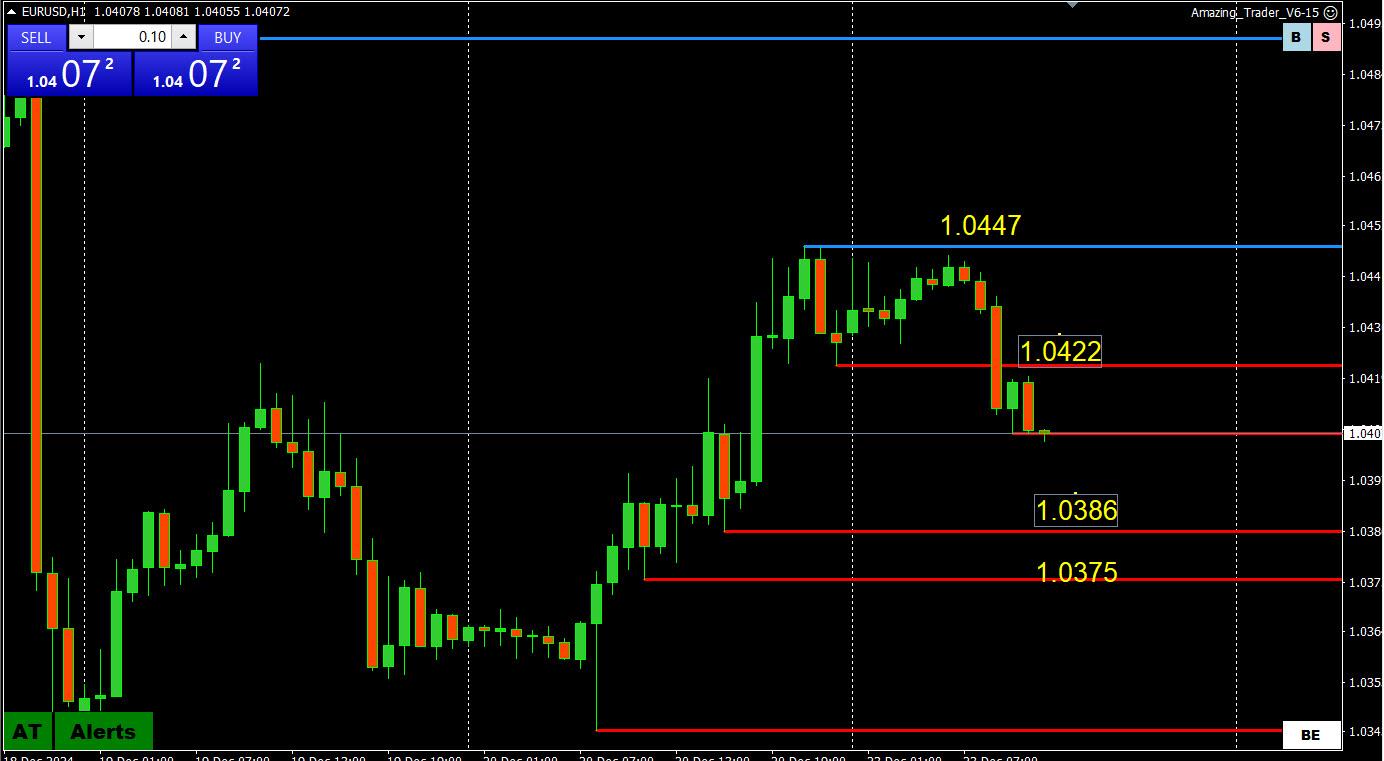
Technical analysis works because others follow the same indicators, patterns, levels, etc. When no one is playing the game, such as now ahead of Xmas, you can’t count on technical to follow through.
With that said, what caught my eye is EURUSD’s pause below 1.0450, which keeps thoughts of 1.05 at bay and the downside more at risk.
December 22, 2024 at 9:49 pm #16658THIS WEEK’S MARKET-MOVING EVENTS (all days local)
Starting off the week on Monday is Canada’s monthly GDP. After a muted 1.4 percent year on year rise in October, forecasters expect November to go up a bit more at 1.8 percent on year.
US consumer confidence is forecast to show another increase in December, from 111.7 to 113.0.
On Tuesday, US new home sales are seen recovering to a 664,000 annual rate in November after plunging to 610,000 in October from a strong 738,000 in September. Weather depressed sales in October. That’s not seen as a factor in November but rising mortgage rates are.
Thursday, US job claims are seen rising to 223,000 this week, not far off the four-week moving average of 225,500 after an unexpected drop of 22,000 to 220,000 last week.
On Friday, Japanese payrolls are expected to post their 28th straight rise on year in November amid widespread labor shortages. Japan’s unemployment rate is forecast at 2.5 percent after ticking up to 2.5 percent in October and improving to an eight-month low of 2.4 percent in September from 2.5 percent in August. The government continues to describe employment conditions as “showing signs of improvement” in its latest monthly economic report.
Meanwhile, Japan’s industrial production is forecast to post its first drop in three months in November, down 3.5 percent on the month.
Econoday
December 22, 2024 at 6:55 pm #16651December 22, 2024 at 2:11 pm #16649Those trading the past few days should have noticed a series of one way moves
This suggests an end-of-year holiday market dominated by real money flows driven by position adjustments/book squaring rather than fresh positioning that are harder to absorb as participation tends to fall with each passing day… READ HOW, CLICK BELOW.
How to Trade in a Holiday Market
 December 22, 2024 at 2:01 pm #16646December 22, 2024 at 1:44 pm #16645December 21, 2024 at 4:37 pm #16615
It is no coincidence when a pattern repeats itself twice in a month with 2 different currencies.
]
The Magic Levels Trading Pattern Strikes Again December 21, 2024 at 12:50 am #16608December 21, 2024 at 12:49 am #16607December 21, 2024 at 12:42 am #16606December 20, 2024 at 9:48 pm #16603Anonymous
EURUSD
https://www.ft.com/content/d91d35fc-93ab-4963-8587-7a00fe5c63b4Europe leads the way Mario Draghi might bemoan Europe’s woeful securitisation markets, but SRTs is one area where the old continent has clearly led the way (yes, despite the “Wall Street” headline). In fact, the concept of such deals was enshrined in the EU’s regulatory framework through its implementation of the Basel II banking rule book in 2006, and in 2014 the European Banking Authority laid out detailed guidelines for them. As the EBA said at the time:
December 20, 2024 at 7:26 pm #16600If it wasn’t for the central bank surprises, the position squaring you are seeing today is typical of what typically goes on in the pre-XMAS week… as I indicated in
Trader Alert This is Not a Normal Trading Week
 December 20, 2024 at 5:26 pm #16599December 20, 2024 at 5:21 pm #16598December 20, 2024 at 4:31 pm #16597December 20, 2024 at 3:46 pm #16596Anonymous
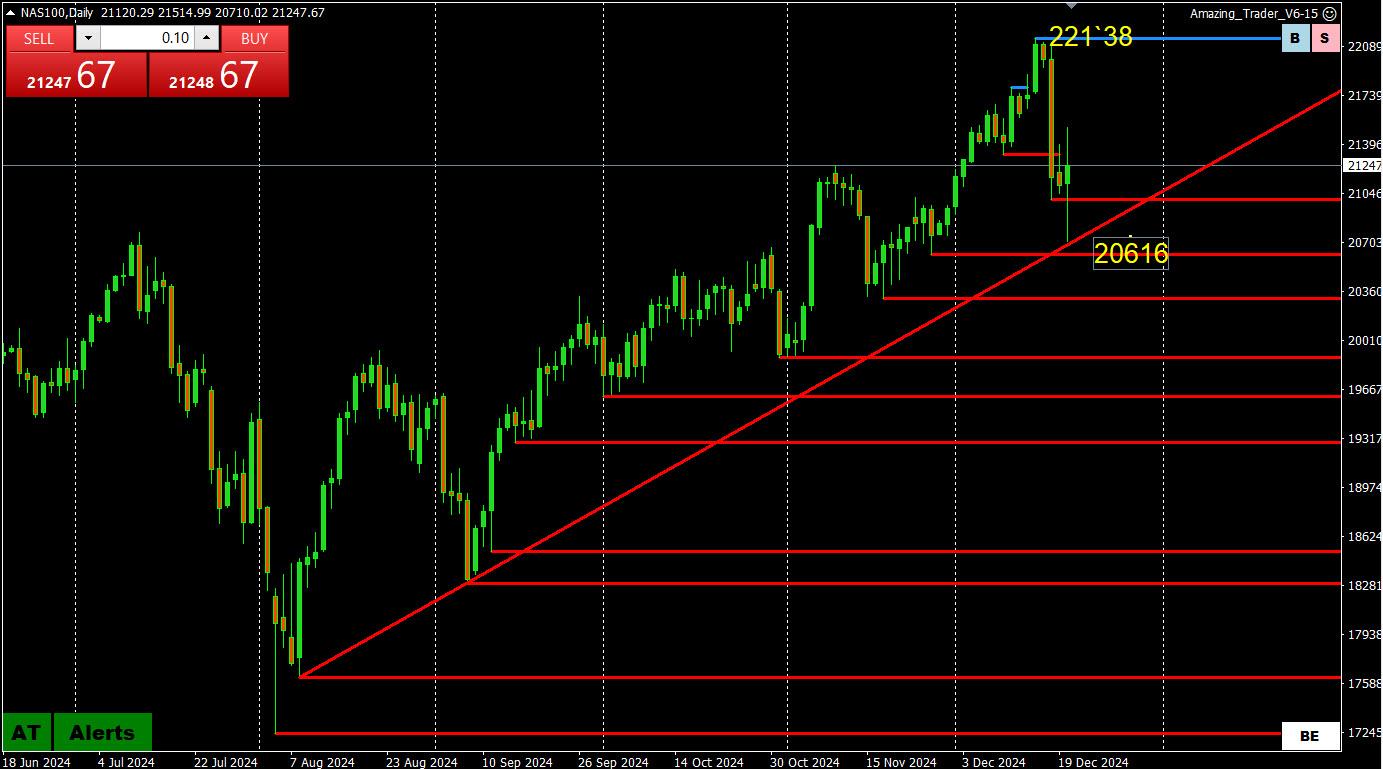
Is there a reason for the Stock Markets to print New historical highs?
Technically not. There is just one, that is Institutions start to pump another round of impressive leverage. Which but institutional players better don’t do now as It might be needed in case of extreme crises. They are already overly leveraged and full.
Hence here we are dealing with possibly complex Institutional Strategies redefining themselves as the new trading environment of the next months. It’s new Gamma walls and Collars and a totally new risk profiles in early definition, something we will be capable to start to see more clearly possibly around the beginning/end of January 2025.
Beside that am starting to notice algorithms are going against each other, loosing meaning – usability.
Purpose exhaustion of technological advantages of once.Hence for the time being I would not chase markets.
Will watch closings later on, better. After the Witches go away.
Take Care
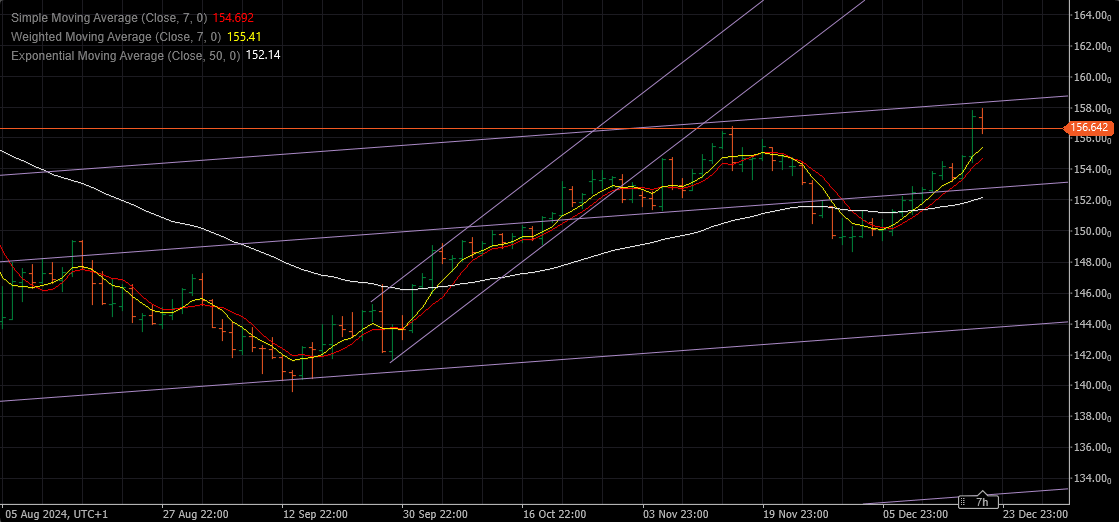
December 20, 2024 at 3:30 pm #16595December 20, 2024 at 3:26 pm #16594USDJPY Daily
This is what I wrote on 12.12.2024. :
Pattern – Bullish
If we get over 152.850 -we might see a run over 154.000 tomorrow
Now do not get me wrong – I don’t want to show off or gloat !
I want to prove the point and share some insights as how I trade…
 December 20, 2024 at 3:15 pm #16590Anonymous
War often leads to inflation
The fact that war and inflation often go hand in hand has been known for a very long time. Back in 500 BC Sun Tzu, Chinese general and author of a book on the art of war, observed:
“Where the army is, prices are high; when prices rise the wealth of the people is exhausted.”
December 20, 2024 at 3:13 pm #16588AnonymousMonetary policy and inflation in times
of war – BIS Paper 2022https://www.bis.org/review/r220519f.pdf
December 20, 2024 at 2:45 pm #16586December 20, 2024 at 2:37 pm #16584AnonymousDecember 20, 2024 at 2:23 pm #16582DX 108 has not been seriously compromised yet. I am changing my view from positive Sterling to the sell side very short term. Bear in mind I am fleet of foot and have zero problem changing my stride.
My view on stocks looking out is no real damage has been done and we are going to see a whopper of a bull run in coming months. Commentary from another site supporting my view so far:
———
Equity funds saw their largest weekly inflow on record of $68.7 billion, while cash holdings and bond funds experienced significant outflows, according to a Bank of America report, citing EPFR Global data.
US stock funds led the surge with $82.2 billion in inflows for the week ending December 18, amid a bullish sentiment around domestic equities. Concurrently, $63.8 billion exited money market funds, and $6 billion left bond funds, while crypto attracted $3.1 billion.
US equities are on course for a record inflow in 2024, however, BofA flags “abnormally large daily inflows across all S&P 500 funds” on Wednesday, potentially due to the upcoming quarterly re-balance on Dec. 23.
Meanwhile, high-yield bonds posted their largest outflow since February 2023 at $3.7 billion, and municipal bonds saw their steepest outflows in nearly a year at $1.4 billion.
December 20, 2024 at 2:16 pm #16573December 20, 2024 at 1:59 pm #16568December 20, 2024 at 1:52 pm #16565 -
AuthorPosts

- You must be logged in to reply to this topic.
Search
© 2024 Global View