
-
AuthorSearch Results
-
May 4, 2024 at 11:19 pm #5770
In reply to: Forex Forum
May 3, 2024 at 3:09 pm #5682In reply to: Forex Forum
EURUSD 30 Minute Charts – Poiwer of “50”

I hope you are not getting tired of me mentioning the Power of %0 as the EURUSD low at 1.0751 is another example of how this level can be pivotal.
I am not saying you could have caught the falling knife move but when it held above 50 it was a sign to pay notice of a potential bottom
My Favorite Trading Secret: The Power of the “50” Level
 May 3, 2024 at 12:50 pm #5664
In reply to: Forex Forum
EURUSD 4 H
Straight to the target – 1.08150
And now we can go down….but….are we going to??
1.08300 is the barrier between Bullish and Bearish, so I have no idea…do not have a crystal ball, and my cat doesn’t want to cooperate with hints and tips…
Pattern wise – it can be both ways – we need additional development to say for sure.
Anyhow, tests of supports are needed to seal the Up deal.
Support at 1.07400…let’s see
 May 3, 2024 at 9:36 am #5651
In reply to: Forex Forum
EURUSD 4 HOUR CHART – PATTERN BROKEN?

Barring a surprise in today’s US data, EURUSD seems set to break an 8-day pattern around 1.07 (similar GBPUSD 6-day pattern around 1,25), which would suggest a shift in directional risk to the upside.
This suggests EURUSD will likely find support on dips as long as 1.07 does not trade, a stronger bid if 1.0735 can become support.
On the upside, a firm break of 1.0753-57 would be needed to put 1.08 in play (note there is little on charts then until a 1.0850 trendline and 1.0884)
May 2, 2024 at 6:43 pm #5636In reply to: Forex Forum
May 2, 2024 at 5:48 pm #5630In reply to: Forex Forum
EURUSD 4 H – Update
This is the third week that we are starting the day with one outlook, just to close it with an opposite one.
Seems as the Bulls and the Bears are just waiting for some data to try to use it to prove their point.
Personally, I couldn’t care less about data and/or interest rates, news and rumours .
It is enough to determine what might happen next few hours , based on 4h chart, and then switch to 30 min and wait for appropriate signal.
Right now, I have to tell you that the picture is changing – once again – The pattern calls for a push Up.
Bare in mind that unless 1.07350 and subsequently 1.07550 are taken out, we can have any pattern we like, but we ain’t gonna go higher.
This is not rectangle ( yet ), this is not the range trading ( waves are too short ) – this is some kind of Sideways to Up …a bit….so take it as it comes and do not try to predict bigger picture.
 May 2, 2024 at 5:07 pm #5625
In reply to: Forex Forum
May 2, 2024 at 3:35 pm #5621In reply to: Forex Forum
GBPUSD DAILY CHART – 1.25 PATTERN

Similar to the EURUSD 1.07 pattern cited earlier GBPUSD has extended its pattern trading on either side of 1.25 to 6 days in a row today.
Over this period there have been”
3 closes above 1.25
2 closes below 1.25
As I noted in EURUSD, the longer this pattern goes on the greater the chance of a directional move once it is broken.
Note today GBPUSD traded lower, helped by GBPJPY selling but the GBPUSD sell part was more easily absorbed than the USDJPY selling out of the cross (same for EURUSD selling more easily absorbed).
May 2, 2024 at 2:49 pm #5616In reply to: Forex Forum
WHEN YOU SEE TWO CURRENCIES TRADE IN OPPOSITE DIRECTIONS VS. THE USD YOIU CAN ASSUME THERE ARE CROSS FLOWS DRIVING THE MARKET.
NOTE TODAY USDJPY IS DOWN, AND EURUSD AND GBPUSD ARE BOTH LOWER.
As explained in the following…
How You Can Use Currency Crosses to Trade Spot Forex
 May 2, 2024 at 1:49 pm #5608
In reply to: Forex Forum
I pay attention to what Bobby says on the EURUSD. As he posted earlier, so far a good guide
Technically speaking, this does not look good for the EUR , and as we can see lower and lower Daily Highs in previous days, picture is slowly starting to get some sense…
BUT focus is mainly on the (firmer) JPY
May 2, 2024 at 11:22 am #5596In reply to: Forex Forum
EURUSD Daily
After FOMC and some not so clear blubber coming from the Feds, EUR is left hanging…
Because of Today’s USD Initial Jobless Claims and Friday’s Important EUR data, we might see continuous YoYo effects – Economic Data Calendar
Technically speaking, this does not look good for the EUR , and as we can see lower and lower Daily Highs in previous days, picture is slowly starting to get some sense…
1.06450 is the Major Support right now, and needs to be taken for a run to 1.04950
Only decisive break of 1.08350 would change this current picture.
 May 2, 2024 at 9:45 am #5588
In reply to: Forex Forum
EURUSD DAILY CHART – 1.07 PATTERN

I am always on the lookout for patterns and one I watch is when a currency trades on both sides of a big figure (round number).
There is currently such a pattern in the EURUSD:
8 days trading on both sides of 1.07
4 closes below 1.07
3 closes above 1.07
No 2 days of consecutive closes above or below
I have found the longer a pattern like this goes on the greater risk of a directional move once it is decisively broken . So keep an eye on this levels as an 8 day pattern like this is a long one.
Notice how your sentiment changes (feels bid or offered) when EURUSD trades above or below 1.07.
May 1, 2024 at 9:38 pm #5578In reply to: Forex Forum
May 1, 2024 at 2:52 pm #5553In reply to: Forex Forum
May 1, 2024 at 2:37 pm #5552In reply to: Forex Forum
May 1, 2024 at 1:37 pm #5547In reply to: Forex Forum
I have said many times that identifying the side to trade at any point in time is more than half the battle in putting on successful trades. Here is an illustration from the earlier run-up in EURUSD.
May 1, 2024 at 1:23 pm #5536In reply to: Forex Forum
May 1, 2024 at 12:52 pm #5535In reply to: Forex Forum
May 1, 2024 at 11:47 am #5526In reply to: Forex Forum
GBPUSD 1 HOUR CHART

Blue Amazing Trader lines dominating but would need to get through 1.2450 (Power of 50 level) to accelerate the downside and shift the focus from 1.25 but….
only back above 1.25 would slow the risk..
GBPUSD has been an underperformer with some pressure coming from a bounce in EURGBP,which in turn is giving EURUSD some support).
May 1, 2024 at 10:07 am #5511In reply to: Forex Forum
May 1, 2024 at 9:52 am #5510In reply to: Forex Forum
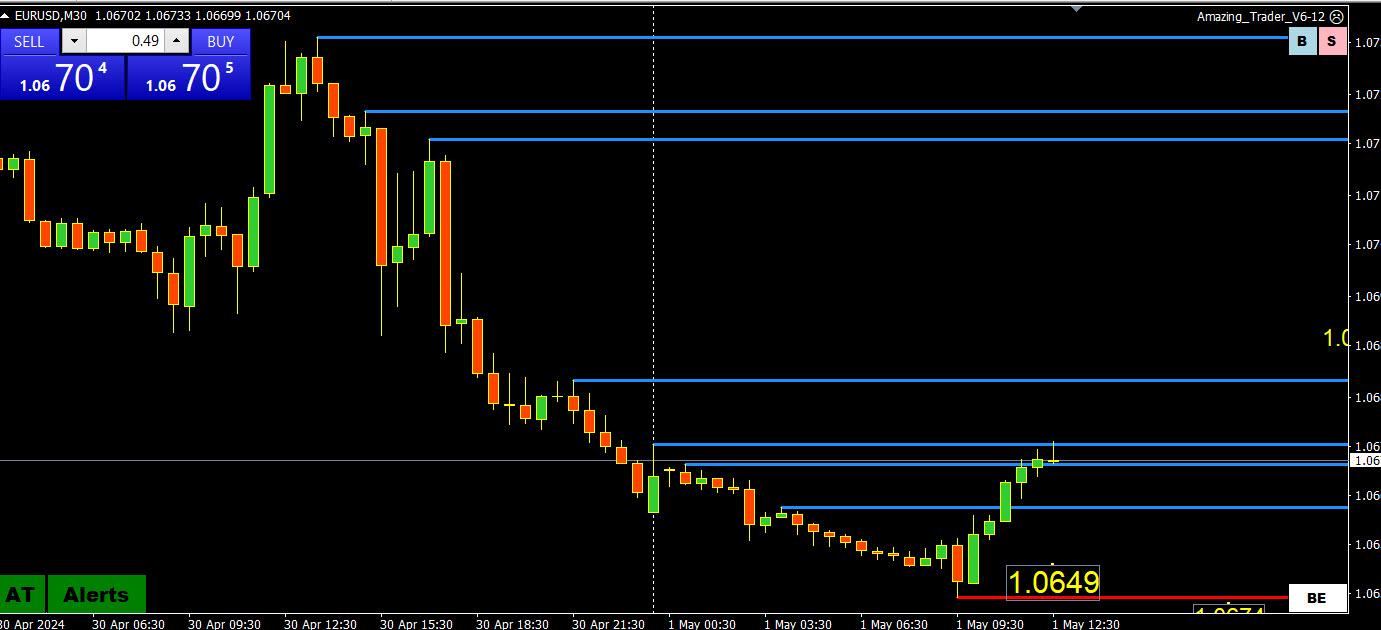
SEE THE CHART BELOW AS ANOTHER EXAMPLE OF
My Favorite Trading Secret: The Power of the “50” Level
EURUSD 30-minute chart – Low of the day (so far) at 1.0649
 May 1, 2024 at 2:04 am #5503
In reply to: Forex Forum
EURUSD 4 HOUR CHART – CLASSIC EXAMPLE

MONDAY-EARLY TUESDAY WAS A CLASSIC EXAMPLE OF A CURRENCY FEELING BID IN AN OFFERED MARKET.
EURUSD BREAK OF 1.0674-86 MAKES THIS THE INITIAL RESISTANCE,
ON THE DOWNSIDE, SUPPORTS AT 1.0638-23-01 ARE TARGETS WHILE BELOW 1.0674-86.
LOOKING AHEAD, LONG WAIT UNTIL THE FOMC DECISION… SHOULD KINIT THE DOLLAR DOWNSIDE AHEAD OF IT..
April 30, 2024 at 6:08 pm #5495In reply to: Forex Forum
April 30, 2024 at 5:46 pm #5493In reply to: Forex Forum
April 30, 2024 at 5:43 pm #5492In reply to: Forex Forum
April 30, 2024 at 5:27 pm #5490In reply to: Forex Forum
April 30, 2024 at 5:24 pm #5488In reply to: Forex Forum
EURUSD 30 min chart — which side is dominating?

More than half the battle in having winning trades is to be able to pick the side to trade from. I could go on a limb and say it can be as high as 75%.
All I can do is share what I use and that is my Amazoing Trader charting algo.
Notice how the blue lines are dominating. As long as the most recent one stays untouched the risk in this case is on the downside. It is visual and tells you what side is most at risk and what side to trade.
It is more than half the battle and no program I know identifies it better than…
April 30, 2024 at 5:24 pm #5489In reply to: Forex Forum
EURUSD 30 min chart — which side is dominating?

More than half the battle in having winning trades is to be able to pick the side to trade from. I could go on a limb and say it can be as high as 75%.
All I can do is share what I use and that is my Amazoing Trder charting algo.
Notice how the blue lines are dominating. As long as the most recent one stays untouched the risk in this case on the downside. It is visual and tells you what side is most at risk and what side to trade.
It is more than half the battle and no program I know identifies it better than…
April 30, 2024 at 2:48 pm #5477In reply to: Forex Forum
April 30, 2024 at 2:05 pm #5472In reply to: Forex Forum
-
AuthorSearch Results


Search
© 2024 Global View