
-
AuthorSearch Results
-
May 13, 2024 at 12:08 pm #6153
In reply to: Forex Forum
May 13, 2024 at 9:28 am #6137In reply to: Forex Forum
USDX DAILY CHART – PROXY FOR EURUSD
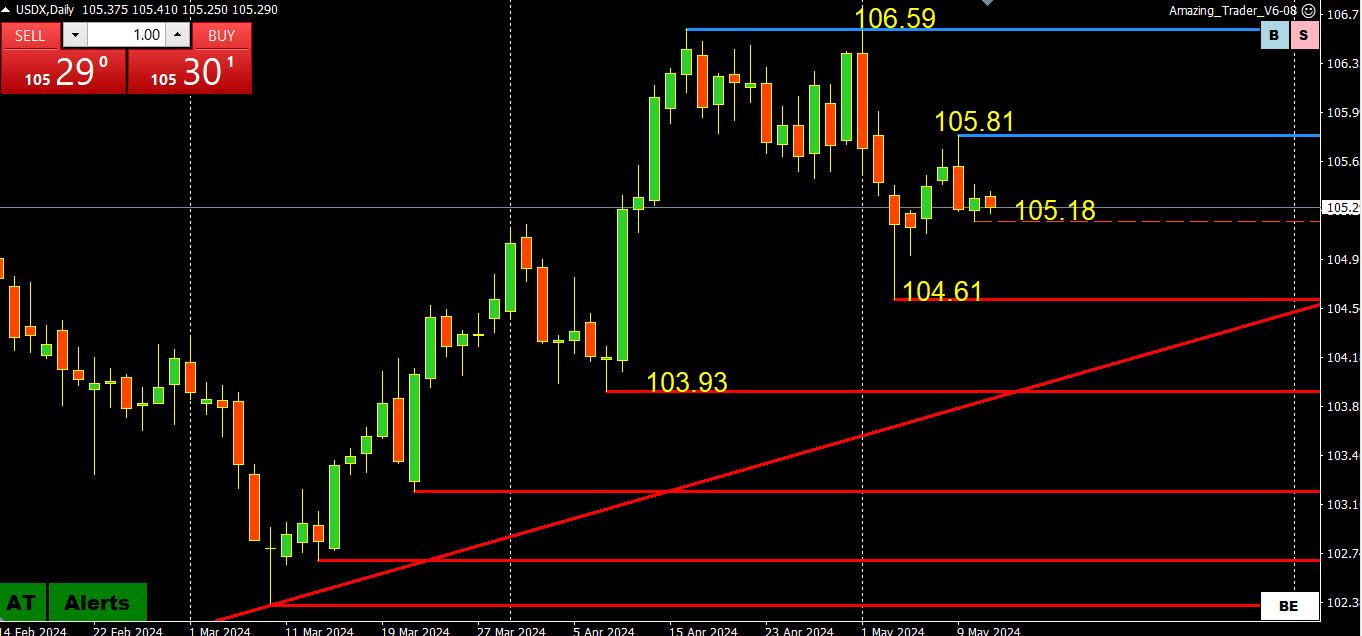
As I have said before, I look at the USDX not for trading it but as a proxy for EURUSD as it represents 57.6% of the index.
The key level on the downside is at 104.61 as a break would be needed to turn this into a downtrend.
Otherwise, the market is in a holding pattern awaiting US data later this week.
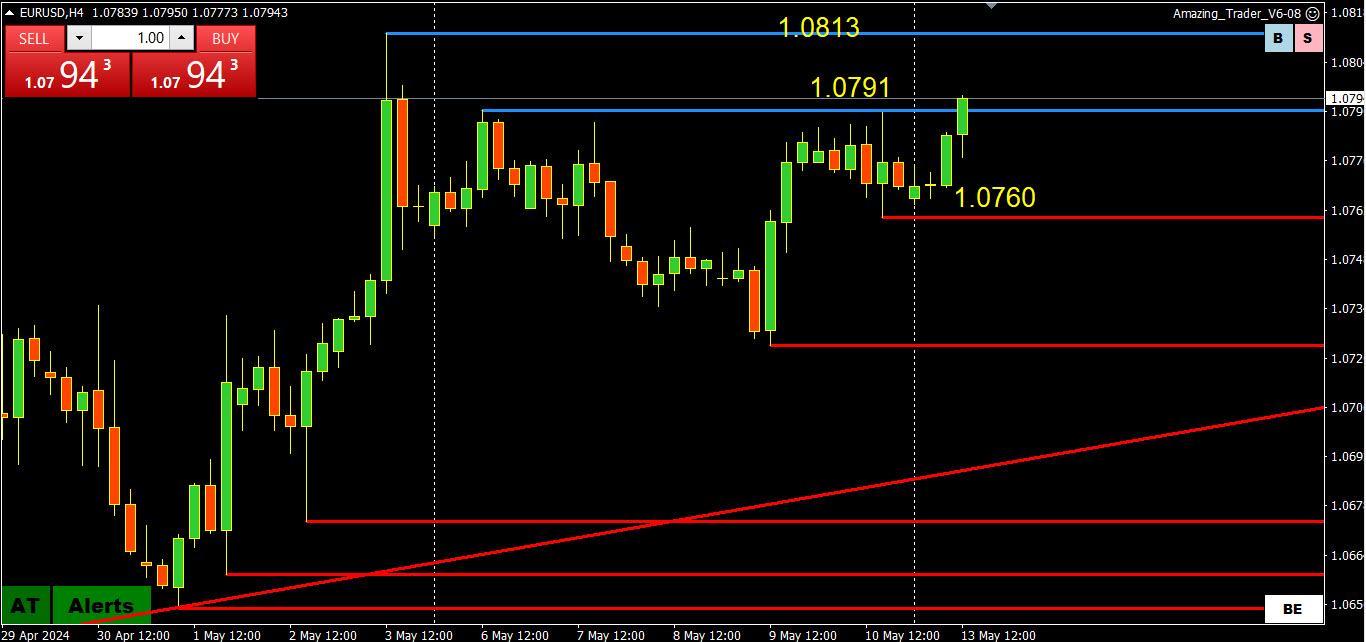
Note for EURUSD, there remains a double top at 1.0791 blocking 1.0800 (psychological) and key 1.0813
High so far today 1.08895
May 13, 2024 at 7:31 am #6132In reply to: Forex Forum
May 12, 2024 at 7:14 pm #6125In reply to: Forex Forum
EURUSD Weekly
With Fibo Retracement levels and Trend lines
Just looking at the chart and trying to avoid being opinionated – as I usually preach…and it doesn’t matter what I wish to happen, or think that might happen, the pair on Weekly is showing me a Bullish Pattern – or at least that is how I see it.
For this 3 weeks move to continue Up it has to stay above 1.07300.
Any failure to do so, any weakness will turn this picture to fully Bearish.
But if 1.08150 first and then 1.08400 taken out, I will have to accept it and join the Bulls in buying it.
It is way easier for me to sell it anytime , and I have to fight myself when it comes to buying it…sometimes even the most obvious signals are not good enough for me.
We have some important data next week and of course we have to be ready for the unexpected.
 May 11, 2024 at 12:17 pm #6097
In reply to: Forex Forum
EURUSD WEEKLY CHART – PREPARING FOR THE WEEK AHEAD

When you prepare for the week ahead you can start with a weekly chart to put the bigger picture in perspetive. I am using the EURISD weekly to illustrate I call it a checklist to prepare for the week ahead..
Write down the prior week’s range. (1.0724-91). These are the initial key levels to start the week.
Is there momentum in the weekly? (2 weeks of higher lows/highs so up momentum coming into this past week)
Was it a higher low or higher high or inside week? (inside week)
If an inside week, what was the previous weekly high? (1.0812)
What is the 4-week high or low (See The Four Week Trading Rule).
When you go through a checklist you will identify what the “real money” traders are looking at, identify the key levels and where there may be stops, determine whether there is momentum, and thereby prepare yourself for the week ahead no matter what time frame you are trading.
As I have said many times, udentifying the side toi trade is more than half the battle in being a successful trader.
May 10, 2024 at 2:47 pm #6078In reply to: Forex Forum
May 10, 2024 at 9:27 am #6057In reply to: Forex Forum
EURUSD 4 HOUR CHART

EURUSD looks set to trade with a bid as long as it stays above 1.0750 with local support around 1.0770.
Resistance is at 1.0791 with last Friday’s. 1.0818 post-US jobs report high above it (also the pivotal 1.08 level).
This has been a quiet week for US data but that will change next week with key inflation and retail sales reports..
May 9, 2024 at 2:04 pm #6006In reply to: Forex Forum
May 9, 2024 at 1:21 pm #6002In reply to: Forex Forum
May 9, 2024 at 12:47 pm #5998In reply to: Forex Forum
May 9, 2024 at 10:00 am #5990In reply to: Forex Forum
EURUSD Daily
Trendline’s Supports and Resistances
Supports :
1.06650 , 1.04950 & 1.04700
Resistances :
1.08150 , 1.08250 , 1.10500 & 1.11500
Currently in a Buy Mode – as long as we are above 1.06650 we have to treat it as Bullish.Moving Average’s Supports and Resistances:
Supports :
None
Resistances:
1.07300, 1.07450 & 1.07650
Currently in a Sell Mode – as long as bellow 1.07650 it is Bearish May 9, 2024 at 9:48 am #5985
In reply to: Forex Forum
USDX 4 HOUR CHART – Why I look at USDX

Why am I looking at USDX if I don’t trade it?
I take a look at USDX as part of my daily routine. With EURUSD representing 57.6% of the index, it often acts as a proxy for this currency.
More than half the battle is to identify the side to trade and this index helps confirm (or not) what I see on a EURUSD chart.
Looking at this chart. USDX continues to recover from last week’s post-US jobs report fall.
It is trying to build momentum to the upside but still faces a key resistance at 106.00. It would likely need EURUSD to extend its retreat to challenge this level.
May 8, 2024 at 3:41 pm #5953In reply to: Forex Forum
May 8, 2024 at 1:14 pm #5940In reply to: Forex Forum
THIS IS A GOOD TEST FOR ANY DAY TRADER.
LOOK AT THE EURUSD AND SEE HOW YOUR EMOTIONAL BIAS CHANGES WHEN IT IS TRADING ABOVE AND BELOW THE 50 LEVEL (1.0750).
FOR THOSE WHO HAVE NOT READ THIS POPULAR BLOG ARTICLE OR WANT TO TAKE A LOOK AGAIN
MY FAVORITE TRADING SECRET: THE POWER OF THE “50” LEVEL
 May 8, 2024 at 12:01 pm #5934
In reply to: Forex Forum
EURUSD 4H
Yesterday , as expected support at 1.07500 held it’s grounds and we hit 1.07900 (almost –yeah well , can’t predict it in a pip J .
Overnight the support at 1.07500 was penetrated and now the pressure is on the downside .
Resistance at 1.07550, and Support at 1.07350 .
Next Support comes at 1.07150 – break of would open a space for a larger down wave to 1.06750 at least.
 May 8, 2024 at 10:01 am #5929
In reply to: Forex Forum
USDX 4 HOUR CHART – RETRACING BUT BELOW RESISTANCE

USDX has retraced from its post-jobs report low set last Friday as the USD recovers. However, if EURUSD were leading rather than lagging the USDX would be higher (EURUSD IS 57.6% OF THE INDEX).
The key level is 106.00, with support at 105.09, suggesting the current range is 105-106 for now but only a break of 106.00 would negate the technical risk on the downside.
May 8, 2024 at 9:33 am #5926In reply to: Forex Forum
EURGBP 4 HOUR CHART – TRADES SOFT AHEAD OF THE BOE

As noted in the Morning Bid report, The Bank of England announces policy on Thursday, and while no change is predicted this week, dovish bets have risen recently.
This has seen EURGBP firm this week, putting the key .8644 level on the radar as long as it trades above .8581.
Note the EURUSD lag on the USD upside, helped by demand out of its crosses, not only EURGBP but other EUR crosses as well.
May 7, 2024 at 6:07 pm #5905In reply to: Forex Forum
May 7, 2024 at 6:00 pm #5904In reply to: Forex Forum
May 7, 2024 at 5:35 pm #5902In reply to: Forex Forum
May 7, 2024 at 4:42 pm #5900In reply to: Forex Forum
Tick ratios in S/P 500 stocks have lost 1/3 of their 20 day range indicating consolidation and an upcoming strong move either up or down from current/recent levels.
Looking further out and with a macro perspective, considering that there is a tremendous gap between US stocks and Fed Fund futures, which has to converge at some point, this begs the question – what will happen to EurUsd as that transpires? The answer would be a selloff in stocks and in bonds and the yields rise over time, especially looking out toward the 4th quarter of the year.
I like Bobby’s notation of Nvidia looking like a sell and I am on board with that. That could very well impact EurUsd longs if it does transpire.
May 7, 2024 at 4:18 pm #5895In reply to: Forex Forum
Put to Call ratio in S/P 500 is right in the middle, up overall, most other gauges are the same, including the volume ratio I noted earlier that had a sudden drop off which was somebody big either getting out or taking some money off of the table. Bottom line with these and other gauges are ending up with EurUsd up overall but not convincingly to this point intra-day. Stocks and Eur often move well together.
May 7, 2024 at 4:15 pm #5894In reply to: Forex Forum
May 7, 2024 at 4:04 pm #5892In reply to: Forex Forum
May 7, 2024 at 1:35 pm #5882In reply to: Forex Forum
May 7, 2024 at 12:34 pm #5874In reply to: Forex Forum
EURJPY 1 HOUR CHART

i assume I am not alone in only trading the JPY very selectively and shying away from being on the short JPY side other than for a scalp.
However, I look at this cross (along with other EUR crosses)for clues trading EURUSD (currently supported by firmer EUR cross offsets).
As for EURJPY, the key level is at 167.38/ Momentum is currently tilted up in this cross but expect caution at any approach to this level.
May 7, 2024 at 10:06 am #5869In reply to: Forex Forum
With the US economic calendar basically empty of key events this week it is like an addict having a tough time without his/her latest fix.
What we are left with is some revived Fed risk cut expectations as seen by slipping bond yields but little to go after on the dollar downside unless last Friday’s post-US job USD lows are threatened.
Otherwise, a mixed bag with JPY and AUD the underperformers.
EURUSD is holding up while above 1.0752, close to unchanged as it has been the benficaiory of varioius cross flows (note firmer EURGBP).
May 6, 2024 at 12:33 pm #5824In reply to: Forex Forum
May 6, 2024 at 9:03 am #5819In reply to: Forex Forum
EURUSD 4 HOUR CHART – CONSOLIDATING

EURUSD has so far traded in a tight range as it consolidates below Friday’s 1.0812 post-USjobs report high.
A key level to keeping a bid is to stay above the 1.0752 mini breakout level (Power of “50”) with support at 1.0724 below it.
On the upside, the key level is obvious at 1.0812 as only above it would add legs to the upside.
May 5, 2024 at 5:31 pm #5805In reply to: Forex Forum
EURUSD Week ahead
We had some EUR positive Fundamentals last week that helped the pair to extend the gains from the week before ( or better to say USD negative )
The Nonfarm Payroll report
The Federal Reserve was less hawkish than anticipated,
EUR/USD is up for a third consecutive week but buying interest remains reluctant.
Coming week lacks any important data, so we can expect the market to behave more technically.
-
AuthorSearch Results


Search
© 2024 Global View