
-
AuthorSearch Results
-
April 30, 2024 at 11:48 am #5446
In reply to: Forex Forum
Knez, this 4H Bar has to close below 1.07100 to signal any attempt to the downside.
You said once that your 4h chart is not the same as mine – time wise – this last bar opened at 11h our time.
I have fine tuned everything based on it – for over 2 decades – so I would recommend you to get a charting system that has same timing.
EURUSD is kind of lame from April 16. , so it really doesn’t look as capable of real achievement on the upper side…still…what I learned first about EUR is that it can take it’s sweet time like forever, and then suddenly decides to run…
When you look at it, this is a clear Sideways to nowhere situation (kind of Up, but only on smaller time frames) .
We must be patient with this pair and it will show us the way.
April 30, 2024 at 11:22 am #5441In reply to: Forex Forum
April 30, 2024 at 9:25 am #5435In reply to: Forex Forum
EURUSD POPS => EUR CROSSES POP (SEE EURGBP)
Month end or news (Flash GDP beats forecasts)
April 30, 2024 at 7:51 am #5432In reply to: Forex Forum
EURUSD 1 HOUR CHART – STUCK IN A RANGE?

EURUSD has been stuck so far for a second day within a 1.0674-1.0753 range set last Friday with attention mainly on the JPY after BoJ interventions and verbal threats overnight.
Range so far this week 1.0686-1.0734
As I noted yesterday, it is month end, and while not an exact science the theory says if US stocks are lower on the month there is USD buying to adjust forex hedges. As I said this is not an exact science so just something to keep an eye on.
Also, month end often sees EURGBP erratic swings so watch into the 4 PM London fixing as it can impact EURUSD and GBPUSD.
Otherwise, markets seem to be on hold ahead of the FOMC decision tomorrow.
April 29, 2024 at 10:13 pm #5423In reply to: Forex Forum
EURUSD 4H
Supports 1.07150 & 1.07000
Resistance at 1.07350
As long as supports hold, we are targeting 1.08000 and subsequently 1.08350
Pattern in creation suggest move Up.
But can it be opposite…of course…never say never – in which case we would hit 1.06350
However, pigs can’t fly, yet….maybe if they produce AI pigs one day…who knows
 April 29, 2024 at 12:48 pm #5403
In reply to: Forex Forum
EURUSD 1 HOUR CHART – OUT OF STEAM?

With EURJPY still above key levels but losing its strong momentum it remains to be seen whether EURUSD can keep its bid ahead of key events this week.
What caught my attention looking at this chart is the failure to seriously take out the 1.0750 level (power of 60).
Mark down today’s high for if it holds, pressure could re-emerge on the downside as the week progresses (“Monday Effect”).
April 29, 2024 at 10:31 am #5396In reply to: Forex Forum
April 26, 2024 at 5:31 pm #5307In reply to: Forex Forum
EURUSD – Daily
Eur did not succeed in penetrating above 1.07500, and got smashed pretty nice after testing it.
Looking at the Daily chart, if it manages to close tonight above 1.07000 , bet are still On for higher – test of 1.08150 , but any close bellow 1.06900 – All Bets are Off
Comes Monday, we can have a run for the support at 1.06300, and in which case I don’t see it holding.
 April 26, 2024 at 10:46 am #5256
In reply to: Forex Forum
April 26, 2024 at 10:27 am #5250In reply to: Forex Forum
April 25, 2024 at 4:08 pm #5198In reply to: Forex Forum
EURUSD 4 H
And now this does not look good for EUR Bears – This is becoming a very Bullish Formation on Intraday time frames.
Resistances are at 1.07400 & 1.07550 – break of would lead us towards 1.08150.
There is another 50 min for this bar to close, and even Europe is out, usually that is the time for previously created intraday trend to continue uninterrupted .
 April 25, 2024 at 12:32 pm #5185
In reply to: Forex Forum
April 24, 2024 at 12:20 pm #5127In reply to: Forex Forum
April 24, 2024 at 10:58 am #5117In reply to: Forex Forum
EURUSD Daily
Yesterday we have seen a strong move Up , driven by the data .
Resistance at 1.06700 was taken out ( now acts as a support ) , and we have closed the day Above the sharp downtrend Resistance line.
There are no important data today , so we’ll see if this move can be sustained .
If it does, we’ll have two consecutive Closed bars above the downtrend resistance line, and that would signal a change of trend.
However, if close will be bellow 1.06500 , it would be a perfect Sell signal and run at 1.05500 would be inevitable.
Supports at 1.06800, 1.06700 , 1.06500 & 1.06250
Resistances at 1.07250 , 1.07700 & 1.08250 Continue reading...
 April 23, 2024 at 4:40 pm #5085
In reply to: Forex Forum
April 23, 2024 at 1:25 pm #5068In reply to: Forex Forum
EURUSD 1 HOUR CHART – DATA/NEWS DRIVEN MARKET
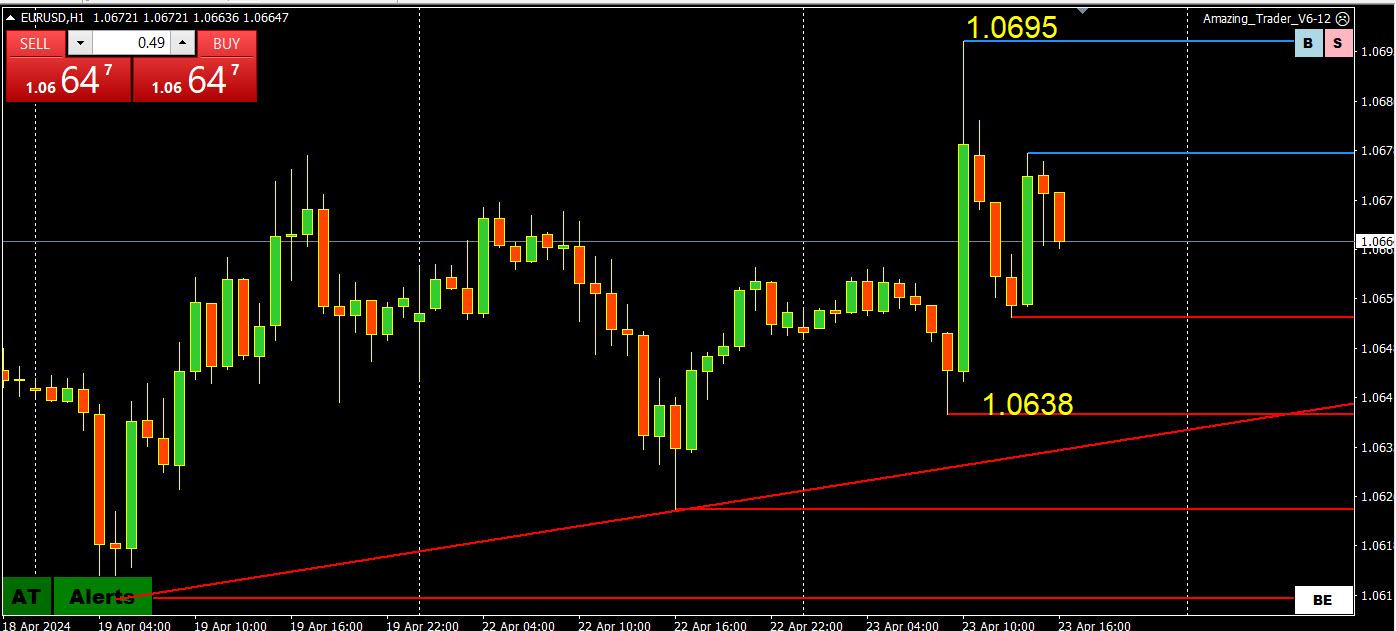
I am posting this chart to illustrate how hyper-sensitive the market is to any data that might change interest rate cut expectations.
The spike up on this chart came after the flash Ez PMI earlier.
This is why you need to be in touch with what news is coming out and the consensus forecasts.
April 23, 2024 at 11:08 am #5055In reply to: Forex Forum
You have seen me post one of my favorite blog articles. The Power of 50. Look at current rates
GBPUSD 1.2350
EURUSD 1.0655
AUDUSD .6450 April 23, 2024 at 9:43 am #5048
In reply to: Forex Forum
April 22, 2024 at 3:23 pm #5010In reply to: Forex Forum
April 22, 2024 at 2:21 pm #5006In reply to: Forex Forum
April 22, 2024 at 1:32 pm #4999In reply to: Forex Forum
April 22, 2024 at 12:11 pm #4997In reply to: Forex Forum
April 22, 2024 at 9:47 am #4993In reply to: Forex Forum
EURGBP DAILY CHART – BREAKOUT MODE
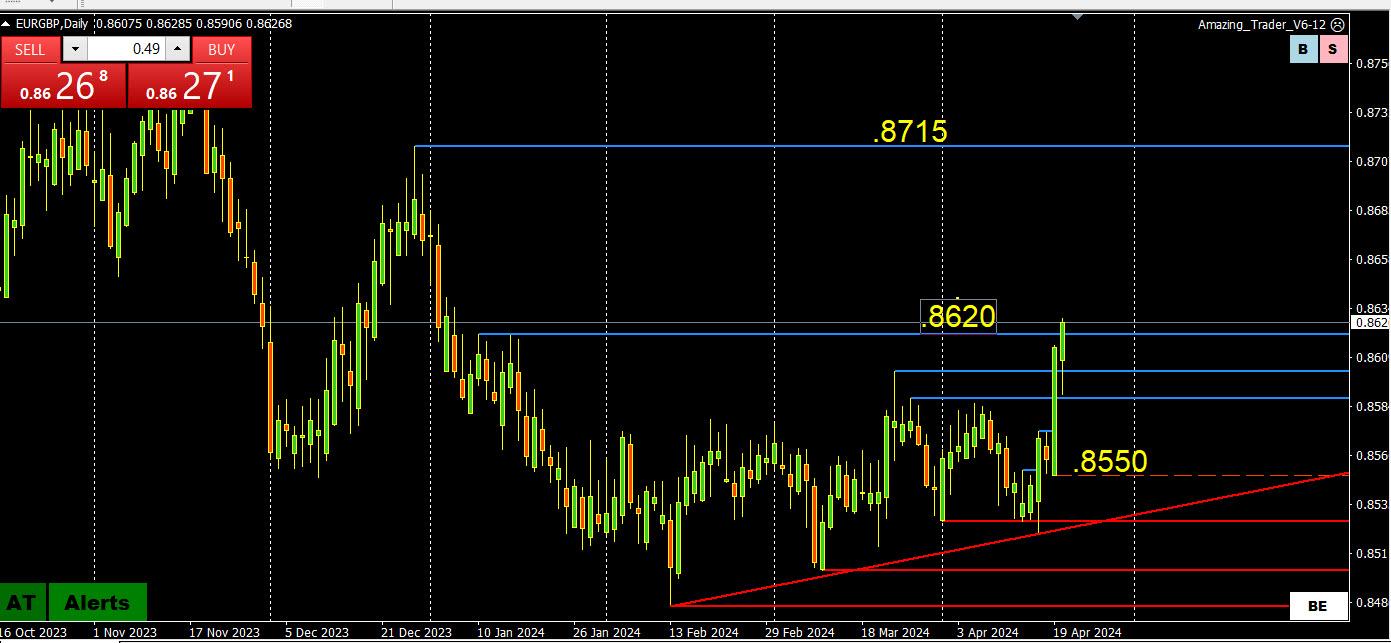
The key level on this chart is .8715, now needing to hold the,8620 break to expose it.
On the downside, it keeps a risk on the upside as long as it stays above .8550, stronger while above the.8585 breakout level.
Even if you don’t trade EURGBP you can use it as a clue to trade GBPUSD and EURUSD as I explain in
‘
‘How you Can Use Currency Crosses to Trade Spot ForexApril 22, 2024 at 8:28 am #4980In reply to: Forex Forum
April 22, 2024 at 7:33 am
wfakhoury AmmanApril 3, 2024 at 8:21 am
wfakhoury AmmanEURUSD
NOW 10766
10757 confirmed will be reached
10760 is the consolidation level; buy below it, sell above it, and tp at it.
10666 confirmed will be reached if it keeps below 10760.
_____________________
Proved——————————————————————
Amman, on 3rd of April you wrote that price will go to 1.0666 if stays below 1.0760……after you wrote it, price went up to 1.0885 …..so how is this good call, please?
also you always say your signal are valid for about 48 hours …. this is like 20 days later!!!!!!
April 22, 2024 at 7:43 am #4974In reply to: Forex Forum
April 22, 2024 at 7:33 am #4972In reply to: Forex Forum
April 20, 2024 at 3:47 pm #4933In reply to: Forex Forum
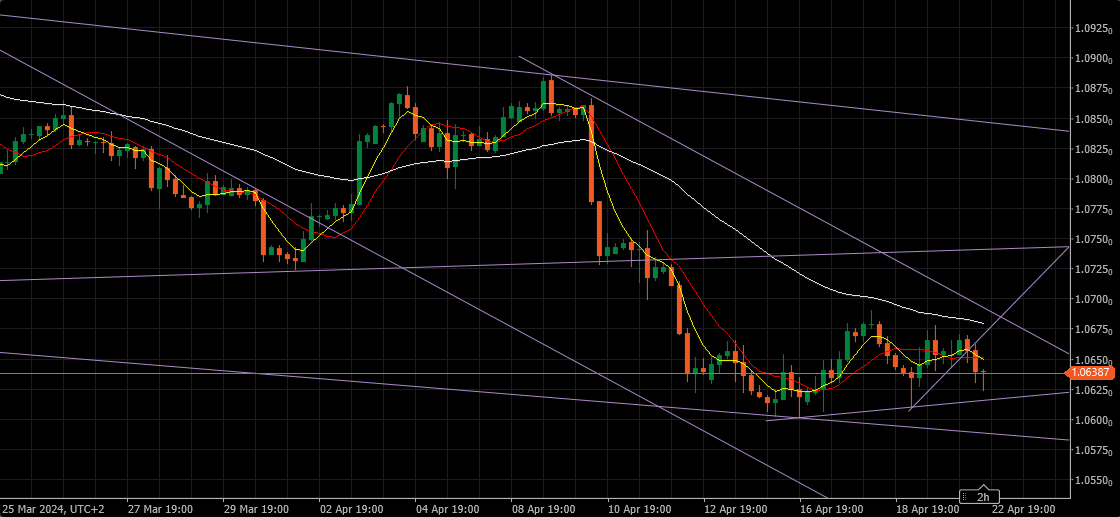
EURUSD Daily
Resistance at 1.07000 – If holds , we’ll have the Downtrend speeding up
Support at 1.05900 – if Taken out, the road will be open for attack at first 1.05450, then comes 1.04900 and finally The Last line of Defence at 1.04150. April 19, 2024 at 3:27 pm #4905
In reply to: Forex Forum
April 19, 2024 at 2:52 pm #4903In reply to: Forex Forum
April 19, 2024 at 12:40 pm #4889In reply to: Forex Forum
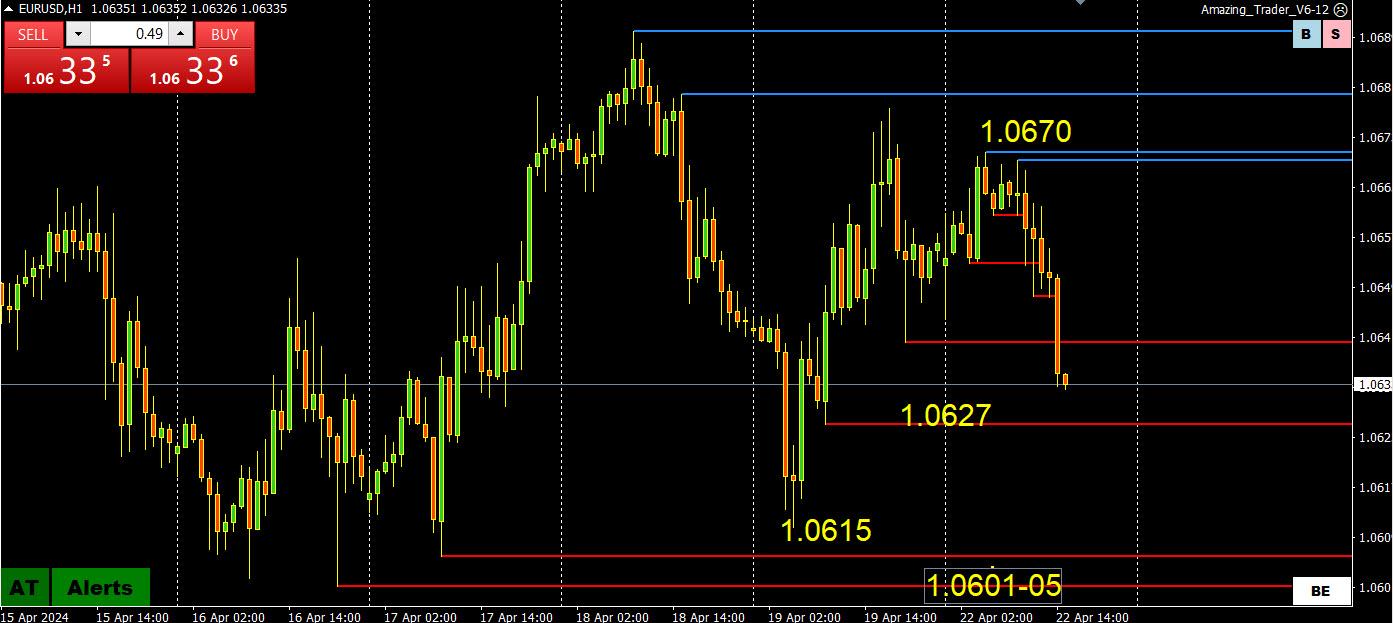
With stops wiped out on the dollar and risk off the side, there is little incentive to push for these lows (or highs such as in gold and oil). Leaves a Friday whipsawed market at the mercy of thin liquidity or book squaring or any stops on the other side.
As for EURUSD, edged through 1.0665 but still within 1.06-1.07.
-
AuthorSearch Results




Search
© 2024 Global View