
-
AuthorSearch Results
-
May 5, 2024 at 9:17 pm #5810
In reply to: Forex Forum
May 5, 2024 at 8:55 pm #5809In reply to: Forex Forum
I see (hopefully) one more round of USD buying which I expect will run out of steam around or above UsdChf 9100 where I like the sell side for duration. Same with UsdJpy in kind.
Note to those of us who have limited experience in forex trading — Macd and Stochastics will remove you of your money. You are better off listening to people in here with experience.
And for the love of God if you think some youtube or facebook “guru” is going to make you money with “signals” on your cell phone you are in for a rude awakening. Monedge, for example, was formed by CTA’s and other industry professionals, GVI is frequented by real bank traders with real experience. Big, big difference.
May 5, 2024 at 8:03 pm #5808In reply to: Forex Forum
I received the following question from a trader sitting with an underwater position.
I am long USDJPY above 155 and need some guidance. Could you give me some advice on whether to hold on or hedge it.
Help! I Am Screwed on a Trading Position
 May 5, 2024 at 12:09 am #5773
In reply to: Forex Forum
May 4, 2024 at 11:19 pm #5770In reply to: Forex Forum
May 4, 2024 at 4:37 pm #5731In reply to: Forex Forum
May 4, 2024 at 4:21 pm #5730In reply to: Forex Forum
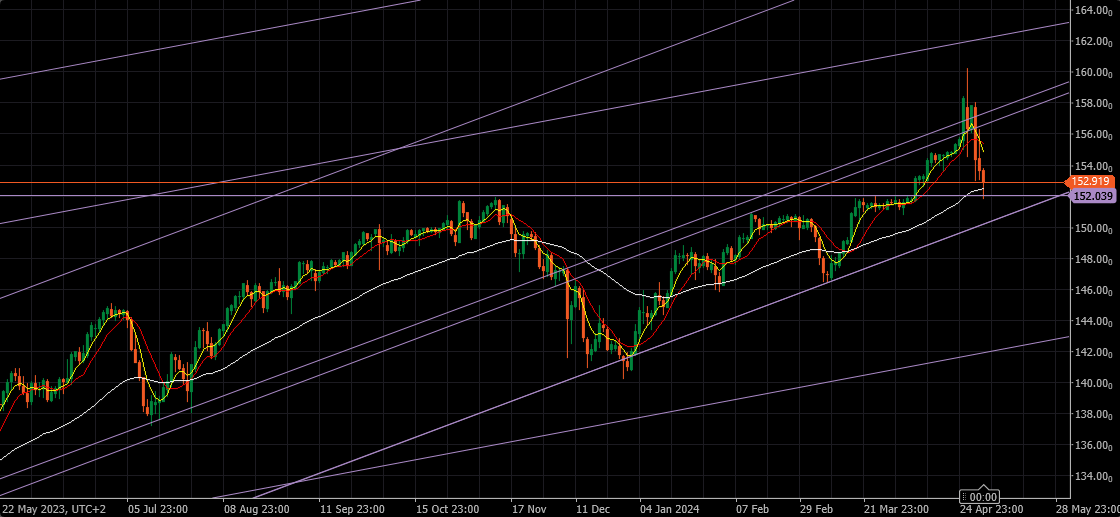
USDJPY Daily
So let’s take a look what kind of damage BoJ did – if at all…
Taking into account BoJ’s intervention appetite so far, I am going to avoid stating some obvious levels – supports and resistances and will focus on only two indicative ones:
152 – that Horizontal line that you can see on this chart – mind you, it goes way back –particularly 20.10.2022. and you can see it now acting as a kind of Pivotal.
155 – if BoJ means serious business, they will take care not to allow market goes a pip above it.
I can only imagine what can happen if market gets idea that this was just a very good Buying Dip – there would not be enough means for BoJ to stop it rallying .
And in that case, do not bother with 162…it would be more of a 172 target.
Crazy ??? Maybe….but I never claimed to be a sane one 😀
 May 4, 2024 at 3:30 pm #5728
In reply to: Forex Forum
May 4, 2024 at 3:27 pm #5727In reply to: Forex Forum
May 4, 2024 at 2:32 pm #5726In reply to: Forex Forum
May 3, 2024 at 12:17 am #5645In reply to: Forex Forum
USDJPY DAILY CHART… IF I WAS THE BoJ…
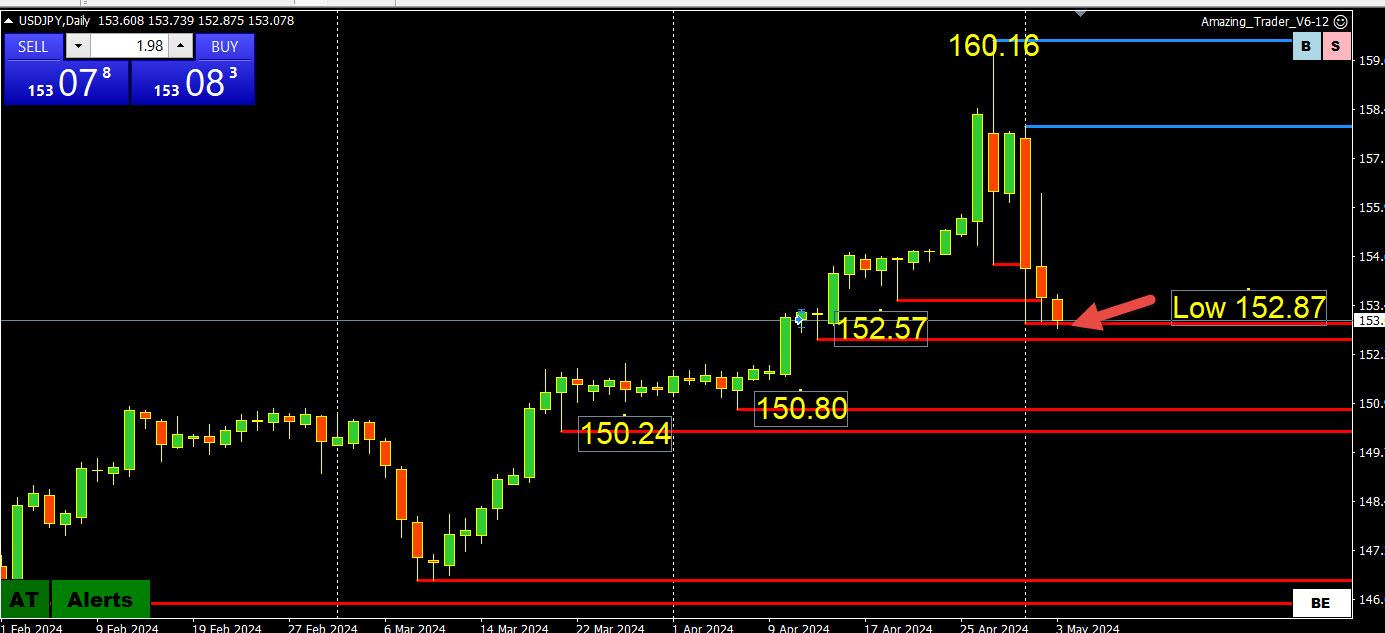
Break of 152.99 has not gone far and this suggests the 153 level will be pivotal.
Now I have been writing about the BoJ looking at the same technicals as we do. In this regard, it would ideally like to see USDJPY get to 150,24, (I am using a daily chart to show what supports lie below)…but
I am not in the BoJ’s shoes but I would be wary of going to the well too often and leave the threat of another surprise attack to keep USDJPY below 155.
With all that said, this is a Friday and this often sees one-way markets as the week draws to a close. Much depends on US data but that is for a discussion later on.
May 2, 2024 at 6:43 pm #5636In reply to: Forex Forum
May 2, 2024 at 3:35 pm #5621In reply to: Forex Forum
GBPUSD DAILY CHART – 1.25 PATTERN
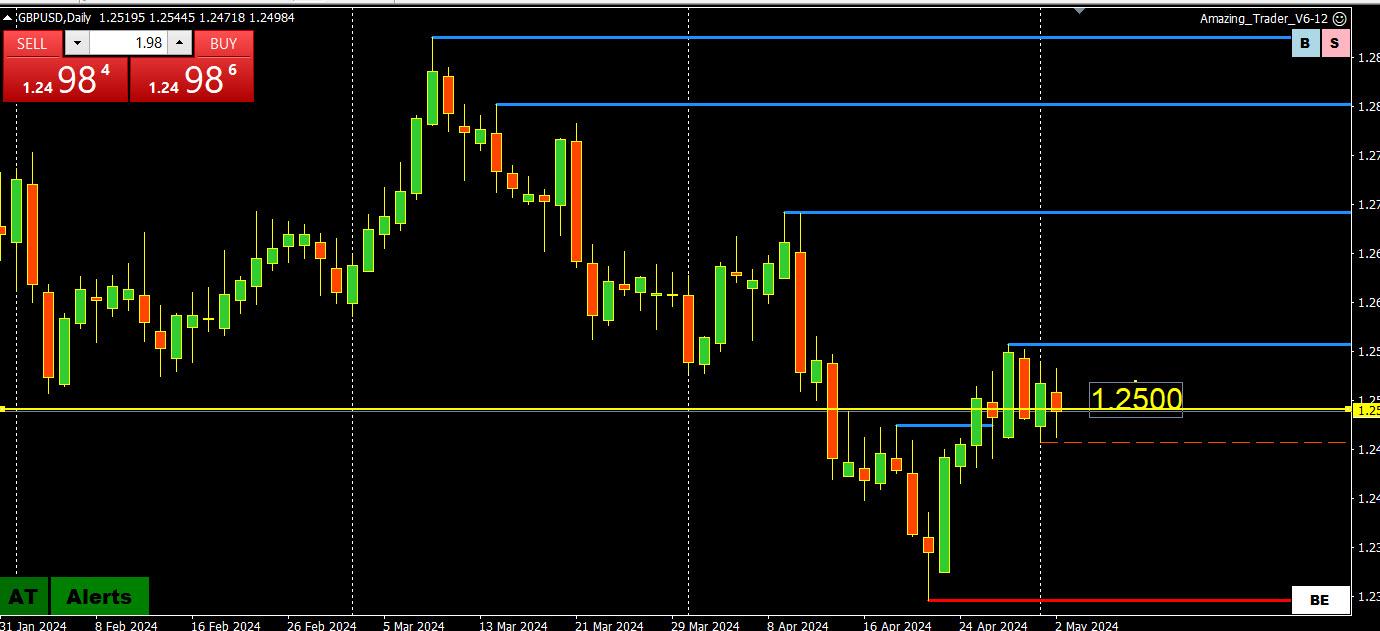
Similar to the EURUSD 1.07 pattern cited earlier GBPUSD has extended its pattern trading on either side of 1.25 to 6 days in a row today.
Over this period there have been”
3 closes above 1.25
2 closes below 1.25
As I noted in EURUSD, the longer this pattern goes on the greater the chance of a directional move once it is broken.
Note today GBPUSD traded lower, helped by GBPJPY selling but the GBPUSD sell part was more easily absorbed than the USDJPY selling out of the cross (same for EURUSD selling more easily absorbed).
May 2, 2024 at 2:49 pm #5616In reply to: Forex Forum
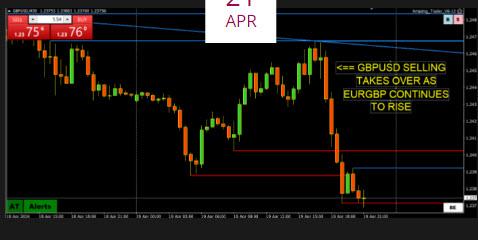
WHEN YOU SEE TWO CURRENCIES TRADE IN OPPOSITE DIRECTIONS VS. THE USD YOIU CAN ASSUME THERE ARE CROSS FLOWS DRIVING THE MARKET.
NOTE TODAY USDJPY IS DOWN, AND EURUSD AND GBPUSD ARE BOTH LOWER.
As explained in the following…
How You Can Use Currency Crosses to Trade Spot Forex
 May 2, 2024 at 2:43 pm #5615
In reply to: Forex Forum
May 1, 2024 at 10:54 pm #5580In reply to: Forex Forum
May 1, 2024 at 9:40 pm #5579In reply to: Forex Forum
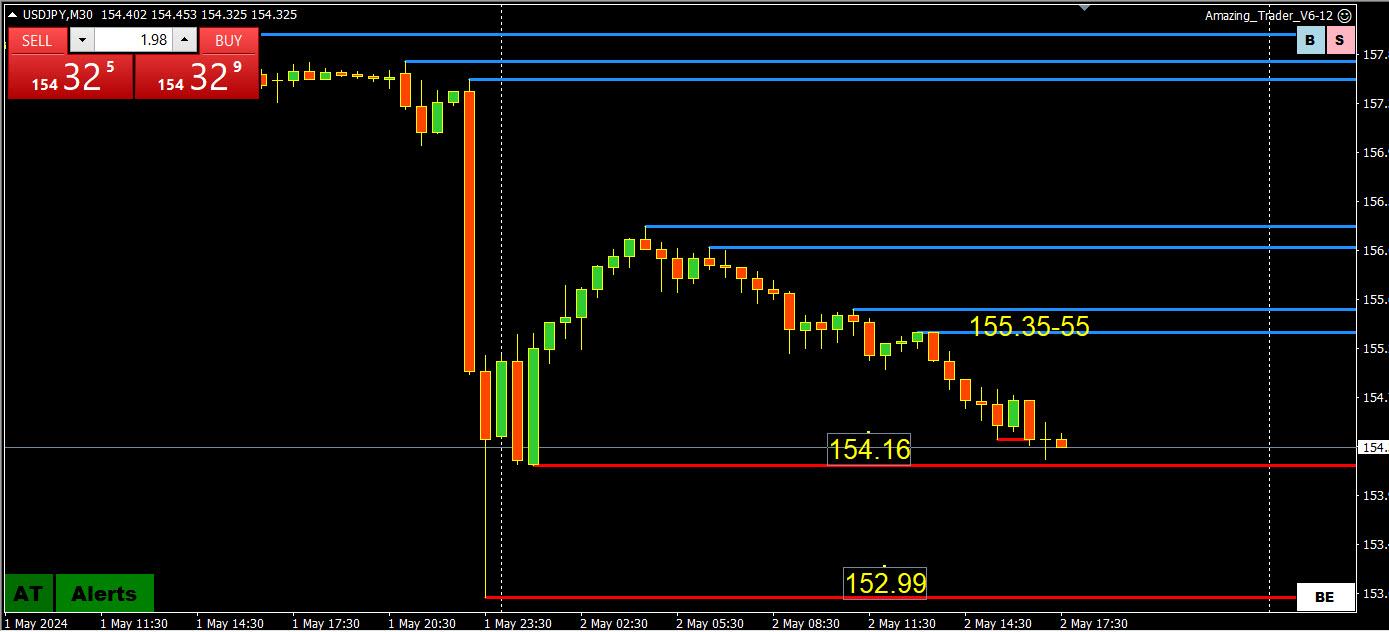
USDJPY 4 HOUR CHART – THE EMPIRE STRIKES AGAIN

The BoJ is taking a risk of overplaying its hand by presumably slamming the market at its thinnest hour.
With that said, it is a warning to be on guard but unless it can get USDJPY below 155 (low on this round was 152.99, last at 155.10) it risks only restoring a two-way risk, not reversing it.
Technically, there is a lower top and a lower bottom so some damage done but still an aftershock unless sub-155 is established.
May 1, 2024 at 2:36 pm #5551In reply to: Forex Forum
USDJPY ONE HOUR CHART – I TOLD YOIU ABOUT THE BOJ
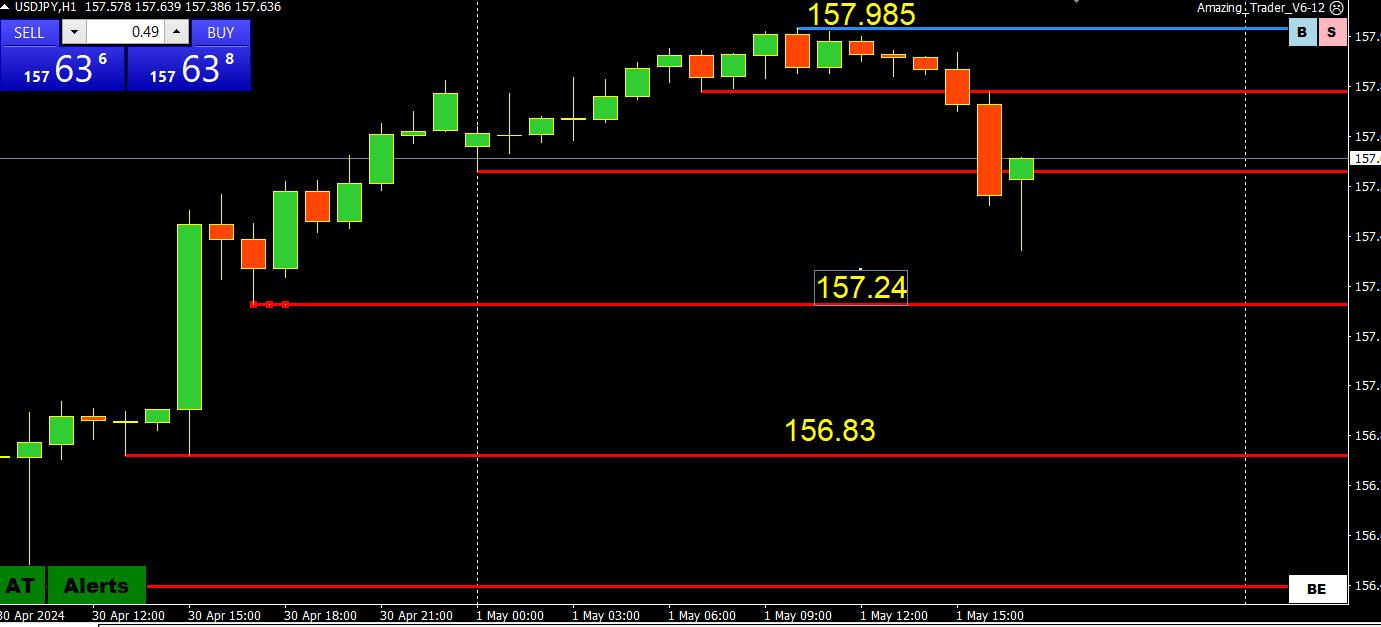
I posted this week that the BoJ looks at the same charts and technicals as we do. I pointed out that if there was a level to defend (covertly) it would be 158 as 61.8% of 160.16-164.49 = 157.994.
The high so far today has been 157.985.
This suggests the intervention risk would increase above 158 and not below it.
April 30, 2024 at 8:06 am #5433In reply to: Forex Forum
USDJPY 1 HOUR CHART – THE DAY AFTER
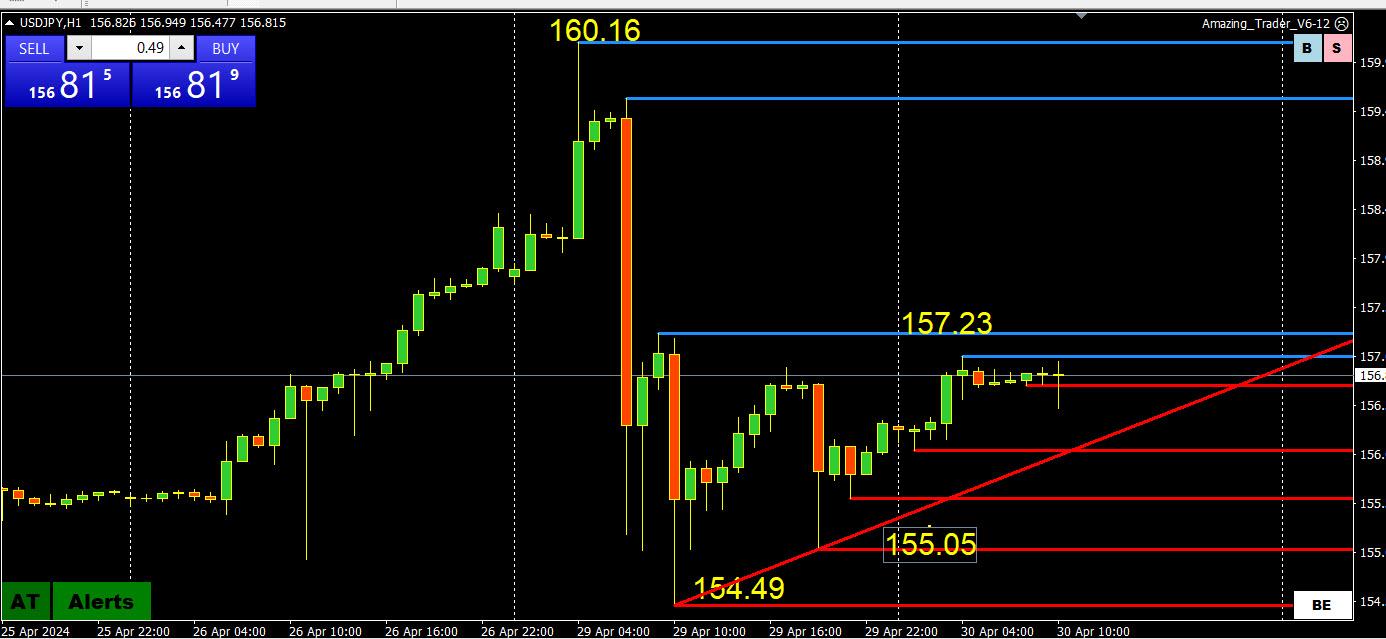
With the BoJ interventions being digested and verbal threats to act at any time, 24 hurs per day, it is not a surprise to see some caution in this pair.
The BoJ, meanwhile, looks at the same technicals that we do, such as FIBO levels for 160.16-154.49
157.32=50%
157.99 = 61.8%If I was in the BoJ’s shoes I would try to keep USDJPY below 61.8% and 158
On the other side, 155 remains the pivotal level in keeping the downside contained.
April 29, 2024 at 11:41 pm #5429In reply to: Forex Forum
April 29, 2024 at 11:05 pm #5428In reply to: Forex Forum
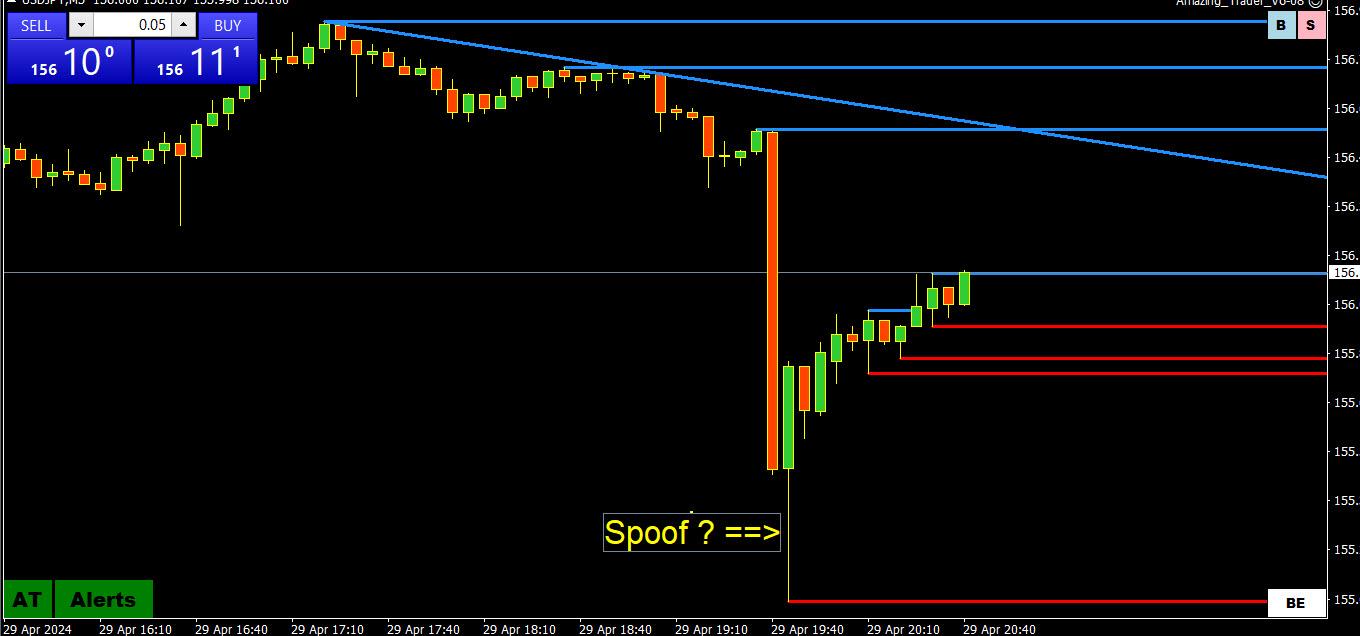
USDJPY ONE HOUR CHART
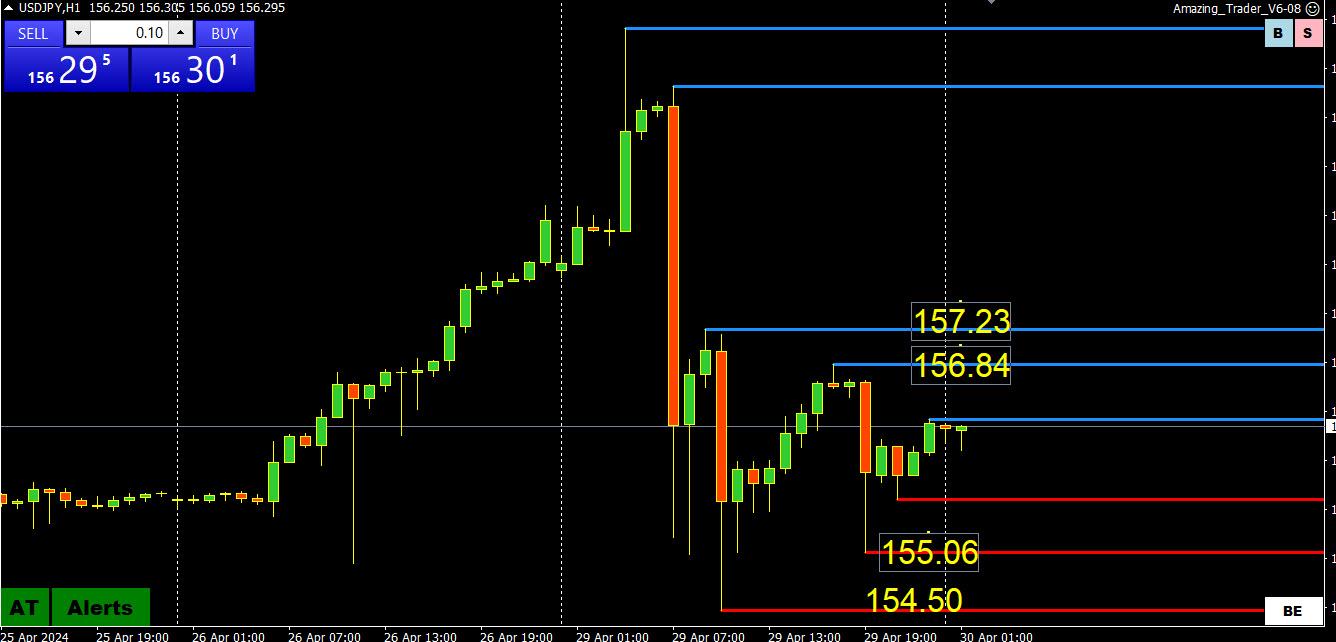
Unless the BoJ is willing to back up its interventions with a hike in interest rates or commit to large-scale USDJOY selling, the best we can say at this stage is that it has, at least for now, restored a two0way risk in what had become a one-way market
What hasn’t changed is that 155 remains pivotal and only firmly below it would suggest the BoJ has won this battle. If not, then it is just a shot across the market’s bow.
April 29, 2024 at 5:50 pm #5416In reply to: Forex Forum
April 29, 2024 at 5:42 pm #5415In reply to: Forex Forum
April 29, 2024 at 3:46 pm #5410In reply to: Forex Forum
April 29, 2024 at 2:18 pm #5407In reply to: Forex Forum
April 29, 2024 at 12:28 pm #5402In reply to: Forex Forum
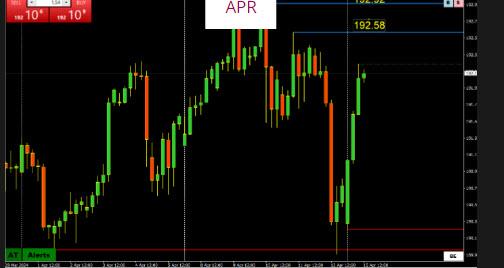
THIS IS ONE OF MY FAVORITE TIPS AND WORTH REPEATING AS IT IS A TIMELY ONE NOW THAT THE BOJ HAS FINALLY INTERVENED IN USDJPY.
‘
The forex market is on a constant search for the path of least resistance, whether it be on the up or downside for a currency. A trend starts like the gently flowing stream, picks up momentum as with the cascading water, and then reaches a climax when it hits the waterfall.Jay Meisler’s Common Sense Trading: How You Can Identify the Path of Least Resistance?
Jay Meisler’s Common Sense Trading: How You Can Identify the Path of Least Resistance?
April 29, 2024 at 11:42 am #5401In reply to: Forex Forum
April 29, 2024 at 10:36 am #5397In reply to: Forex Forum
EURJPY DAILY CHART = DAMAGE NOT YET FATAL
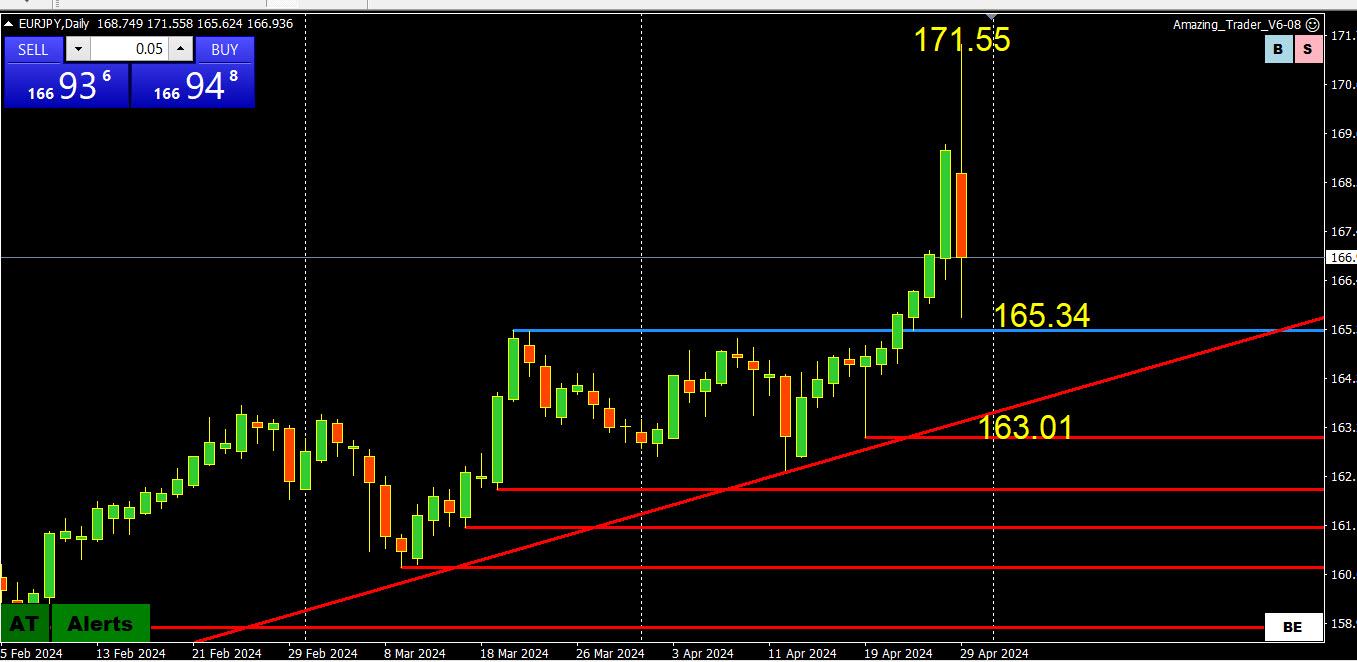
While intervention has been in USDJPY, crosses have felt the impact as well. With that said, if you want to be short JPY there is less chance of intervention in crosses than in USDJPY.
EURJPY retreat from 171.55 shows key supports still untouched
165.34
163.36 (Trendline)
163.01While the damage is not yet fatal the intervention has restored a two-way risk to a one-way market. .
April 29, 2024 at 10:17 am #5395In reply to: Forex Forum
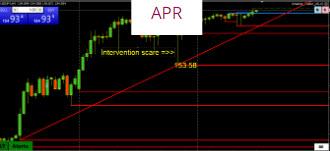
THIS BLOG ARTICLE POSTED LAST WEEK INCLUDES A PRIMER ON INTERVENTION AND WHICH TYPE TENDS TO BE MOST EFFECTIVE,. I SUGGEST READING IT NOW THAT THE BOJ HAS SHOWN ITS HAND.
Many new traders have not experienced intervention and even those who have traded on this event, it pays to have a refresher to see which type tends to be most effective. I call it an intervention primer.
 April 29, 2024 at 9:42 am #5393
In reply to: Forex Forum
DID THE BOJ READ OUR BLOG ARTICLE POSTED ON FRIDAY?
Is it Time for the Bank of Japan to Put Their Money Where Their Mouth Is?
Should the BoJ decide to take a stand and intervene, it would look to get the most bang for its buck. In other words, pick a time where it would use the least resources and produce the greatest impact from intervention.
If I was in the BoJ’s shoes I would wait until just after the Tokyo opening on Monday, let the market push USDJPY up and come in with both barrels blazing. I would then smash USDJPY below 155, sit at that level with an offer to make it a resistance and let the market do the rest.

is it Time for the Bank of Japan to Put Their Money Where Their Mouth Is?
-
AuthorSearch Results

Search
© 2024 Global View