
-
AuthorSearch Results
-
July 24, 2024 at 12:21 pm #9578
In reply to: Forex Forum
July 22, 2024 at 2:07 pm #9472In reply to: Forex Forum
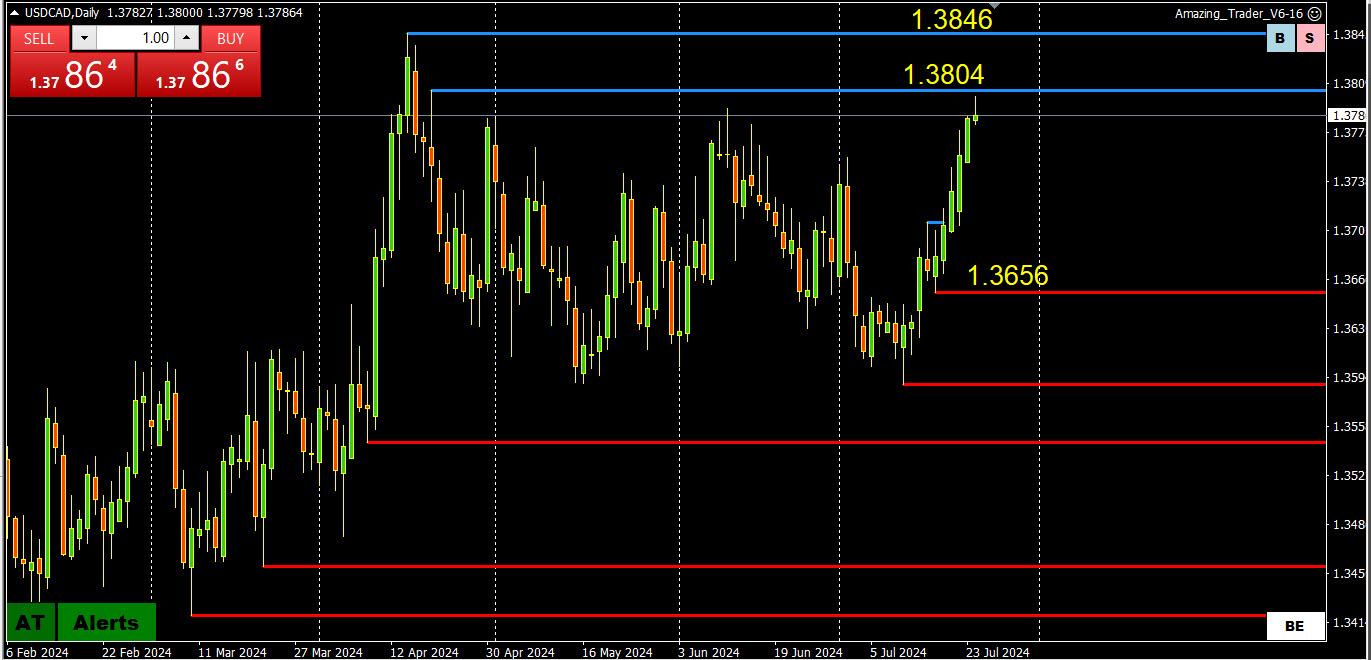
USDCAD WEEKLY CHART
The following was posted over the weekend in the Global-View Trading Club Weekly Charts
Note USDCAD bounced off the 1.3707 level… last at 1.3772
\
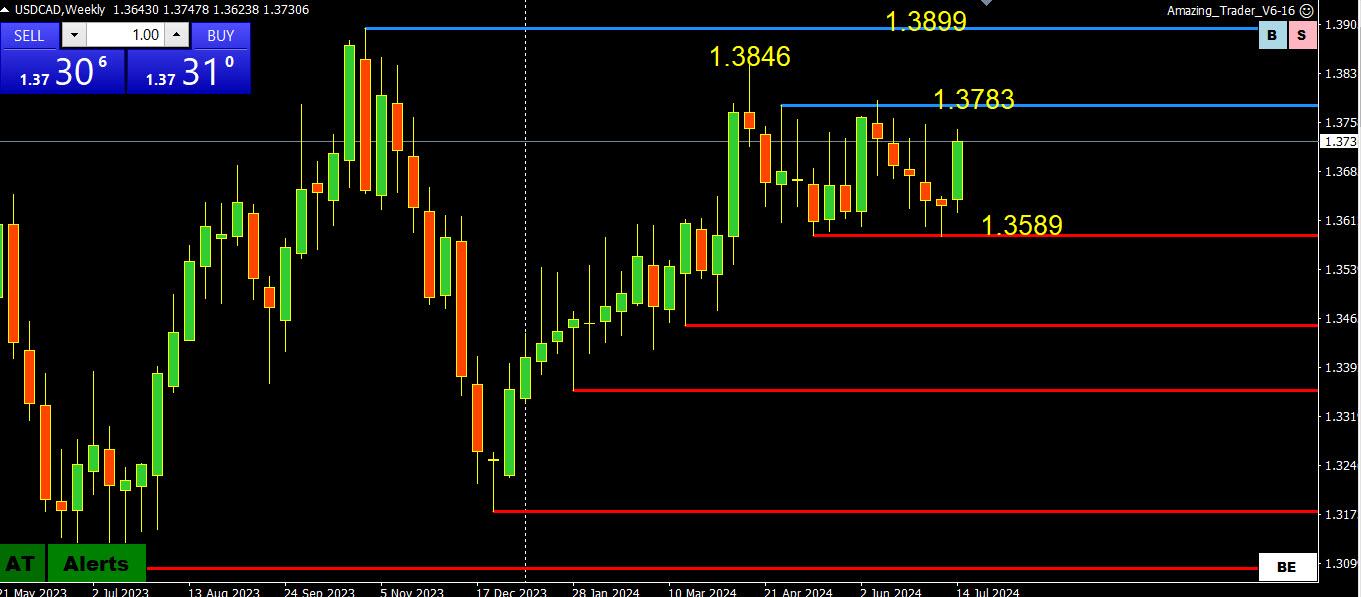
THe focus is on the BoC rate decision on Wednesday where expectations run as high as 80% for a rate cut.
This suggests support on dips ahead of the decision, starting at 1.3707-17.
Targets on the upside can be seen on the chart but 1.3750 and 1.3800 are the pivotal levels on top.
July 22, 2024 at 1:18 pm #9468In reply to: Forex Forum
Sterling looks the best to me at the moment from the buy side perspective as it nears 2900. Not so much on Euro or Aud which would entail greater risk on the buy side this morning. That said, I still prefer the buy side overall in Aussie in a larger view and do not believe price has gone low enough to change that. Euro is a sell from higher than current market and not at a price offering good R/R here at 0870. Prefer buy side of UsdCad today.
July 22, 2024 at 11:23 am #9456In reply to: Trading Academy Q&A’s
Yep too many Gurus out there…none of them survive as long as Jays Global View.So talking of flows, perfect example today of the relationship between Cable, Euro and EURGBP.
EURGBP dropping hard Cable rising, EURUSD static. Also look at the other GBP crosses GBP/Commodity crosses to see how GBP is being bid across the board.
But see EURAUD also rising hard, so we very weak AUD. Then glance to USDCAD and see that rising, so we have weakness across the Comm FX pairs. Its all connected.July 22, 2024 at 7:57 am #9443In reply to: Trading Academy Q&A’s
Thank you Jay & Bobby, I hope my question, and answer helps others as that was the main point of it.Bobby is right that you need to know the pair you are trading, but I have done this for 20 years now and my Wife has more than that…so we cover many markets between us and monitor different methods, multiple strategies and communicate across the desk like in a firm. It is the only way we can stay competitive in this business.
We trade like Jay said, kind of old school some would say, see what is moving, instantly spot what that means about where the flows are, be aware of the day/week of the month regarding Options and key scheduled news, figure out if the flows are going to continue into the next session i.e. will europe to NY continue direction after a pullback or will NY reverse the direction.
If there is surprise geopolitical news or comments and the market moves quickly, you have to know if the move should be faded (usually if its just a comment and the move goes against the flow as it can be creating an opportunity to add even though they make it look like a reversal) and you have to be aware of multiple time frames, especially you have to know where the DXY is trading, where we are in Futures regarding time of month/quarter/year and also what are Bonds doing…oh and what have been the ranges this month, are they nearing their average or do they need a good move to complete their monthly move which can then be faded.
Putting all this together means we were able to jump into USDCAD Long and Short for 40 pips on Friday in what was a very small range day in Euro.Basically you have to love the game, right?Like just now, im writng this…wife says “check gold, im scalp long @2400”), I glance at it, see its at a level of interest and jump in, best signal service there is! (one of many trades so if it doesnt work out its ok, especially as we dont do much before NY session on Mondays, sometimes nothing until after London Fix (Fix is also something you need to be aware, Time of Day…)
Thank you Jay and Bobby for creating this place, I hope you get as much interest as it deserves.
CheersAlanJuly 21, 2024 at 7:53 pm #9426In reply to: Trading Academy Q&A’s
Question – Product selection
In these times of low FX volatility, especially in the majors (EURUSD the main culprit) the system one uses is not as important as what products one focuses on.
Generally this is the problem many traders struggle with the most in the current environment. Knowing how to hunt is one thing, but knowing where the action will be is the first step, where do you hunt can be more important than what weapon you use.
Can you say something about how you choose which pair to focus on? Do you check the news calendar ie on Friday there was CAD news and USDCAD gave some opportunities long and short.
ThanksJuly 19, 2024 at 3:15 pm #9375In reply to: Forex Forum
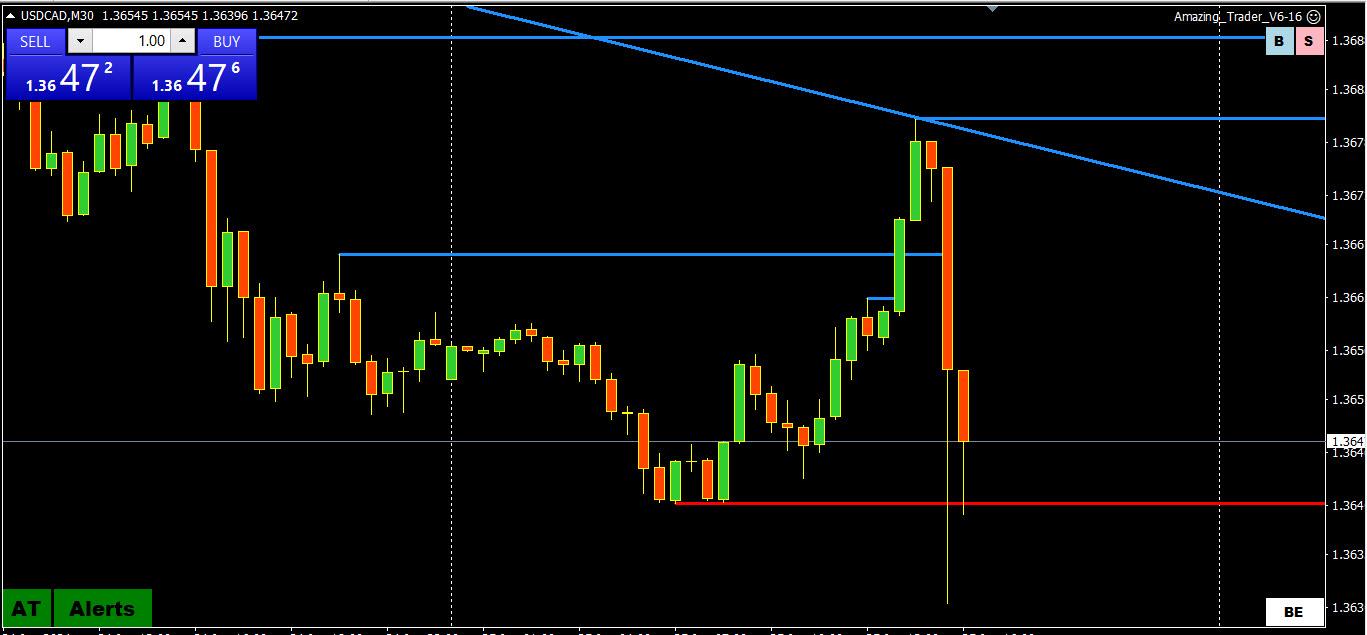
USDCAD 15 MINUTE CHART – DO YOU BELIEVE?
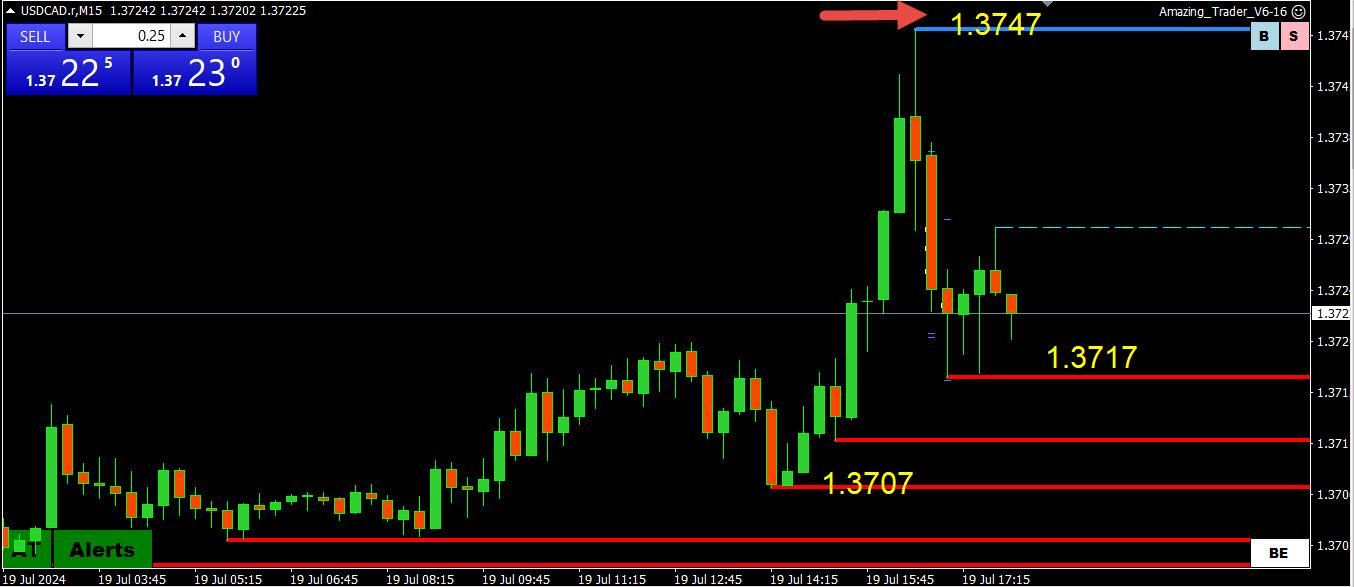
Another example of the Power of 50 as the pause below 1.3750 was followed by some book squaring that sent USDCAD back to pre-retail sales levels.
So, do you believe? This is just one indicator but it raised a yellow flag earlier this week after GBPUSD stalled below 1.3050 and EURUSD below 1.0950.
Otherwise, no change to what I posted earlier, which intra-day says expect support as long as it trades above 1.3707.
My Favorite Trading Secret: The Power of the 50 Level
 July 19, 2024 at 12:40 pm #9367
In reply to: Forex Forum
USDCAD WEEKLY – BOC RATE CUT
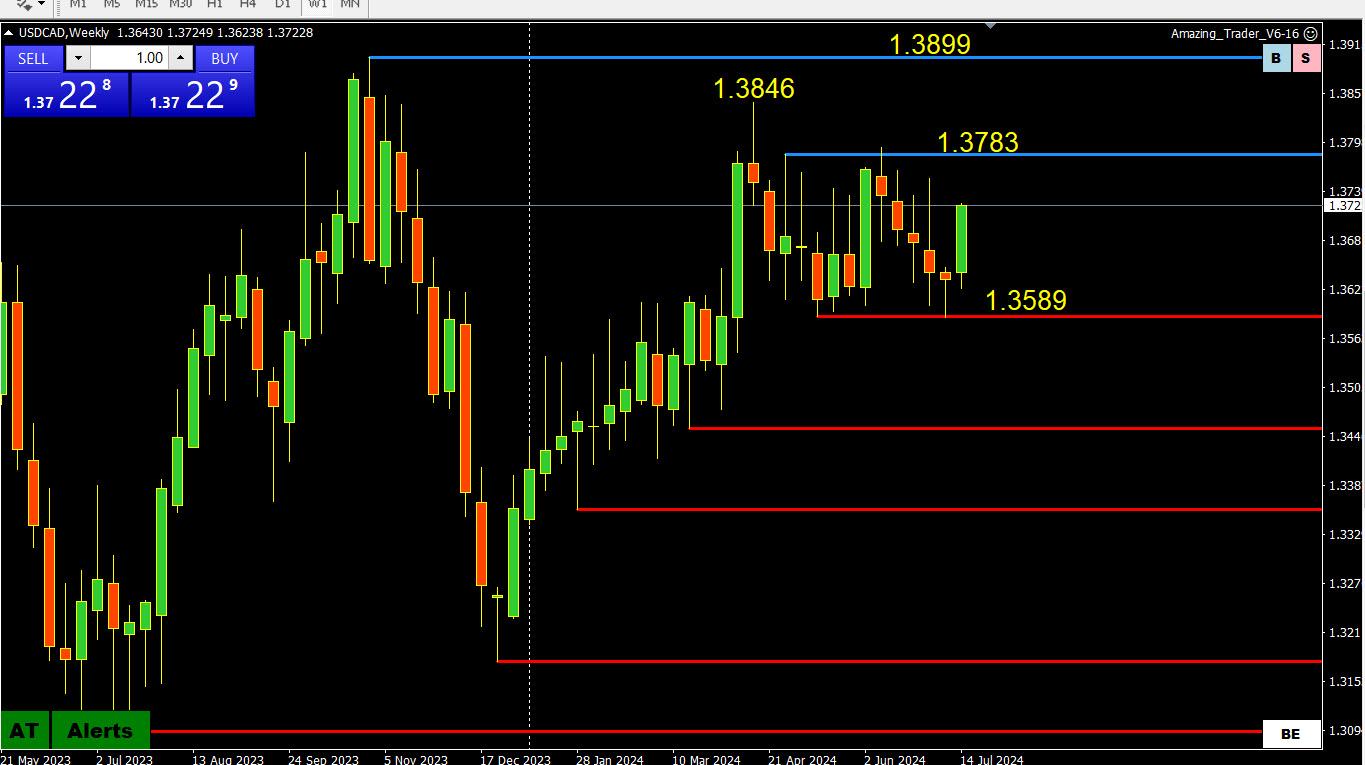
Retail sales just reported missed on the downside but were for May so limited reaction.
‘
Key focus ahead is on next Wed’s BoC rate decision where a cut is widely expected.This suggests support on dips ahead of it.
Intra-day expect support as long as it trades above 1.3707.
July 18, 2024 at 4:05 pm #9322In reply to: Forex Forum
July 18, 2024 at 1:12 pm #9305In reply to: Forex Forum
July 17, 2024 at 12:14 pm #9265In reply to: Forex Forum
Pauses below EURUSD 1.0950 and GBPUSD 1.3050, AUDUSD brief blip above .6750 and USDCAD pause above 1.3650 means it is time to revisit
My Favorite Trading Secret: The Power of the 50 Level
July 16, 2024 at 1:52 pm #9203In reply to: Forex Forum
Post data
USD firmer but so far
EURUSD still above 1.0860
USDJPY staying below 159 (intervention threat?)
USDCAD tested 1,37 post-CPI but did not come close to key level (see update below)
AUDUSD extended fall throiugh .6750 but held .6710 support (scroll to see uodate)US stocks firmer, again led by Russell
US bond yields back to 4.20% but still down on the day
July 16, 2024 at 10:08 am #9178In reply to: Forex Forum
USDCAD 4 HOUR CHART – CPI ON DECK
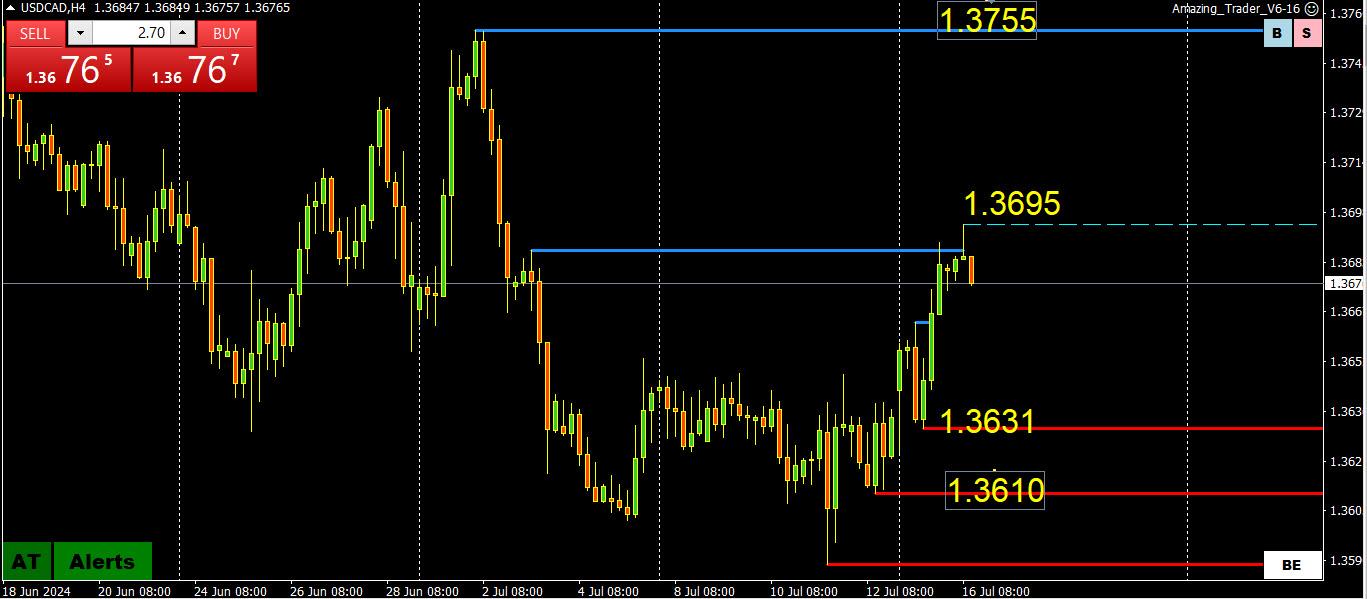
Next focus is on CPI at 12:30 GMT amid talk of a risk of a July rate cut
As this chart shows, USDCAD is trading with a bid ahead of cpi but there is little until 1.3755 so no key stops nearby.
On the downside, 1.3610-30 is support ahead of 1.3589 low.
This makes 1.3589-1.3755 the key range on this chart.
July 12, 2024 at 4:48 pm #9068In reply to: Forex Forum
UsdCad 3620 (which is current market) is the point of control in spot, with 7350 the point of control in futures for Canadian Dollar (which is current market). Regardless of how markets behave up or down, these price levels will be revisited in August. My preference is the sell side in spot in the 3680-90 zone at present if/when seen.
July 12, 2024 at 1:52 pm #9045In reply to: Forex Forum
I will likely sell UsdCad around 3670/80 if seen.
The US and Canada signed revised the 60 year long standing treaty today whereby Canada received 50% of hydroelectric power generated by the Columbia River Dam and will receive 40% less of that amount going forward beginning in August. The revision was in response to population demand in the US over time. Hopefully this counters the graveyard of US oil/gas permits and related production in the US since 2020 and helps to reduce prices a small bit, which obviously soared virtually out of control in recent years. The treaty (get this) can be unilaterally revised or terminated by either country as of September and/or for the life of the new 20 year term. — One month. Oil/gas data up 10am PST.
EurGbp – staying on the sell side from 8920 holds good R/R, you can forgive yourself if the bias changes. It would require fierce buying over 8940 to change the bias.
July 9, 2024 at 1:23 pm #8801In reply to: Forex Forum
June 25, 2024 at 1:31 pm #8097In reply to: Forex Forum
June 20, 2024 at 8:06 pm #7919In reply to: Forex Forum
June 20, 2024 at 10:37 am #7890In reply to: Forex Forum
June 5, 2024 at 5:09 pm #7329In reply to: Forex Forum
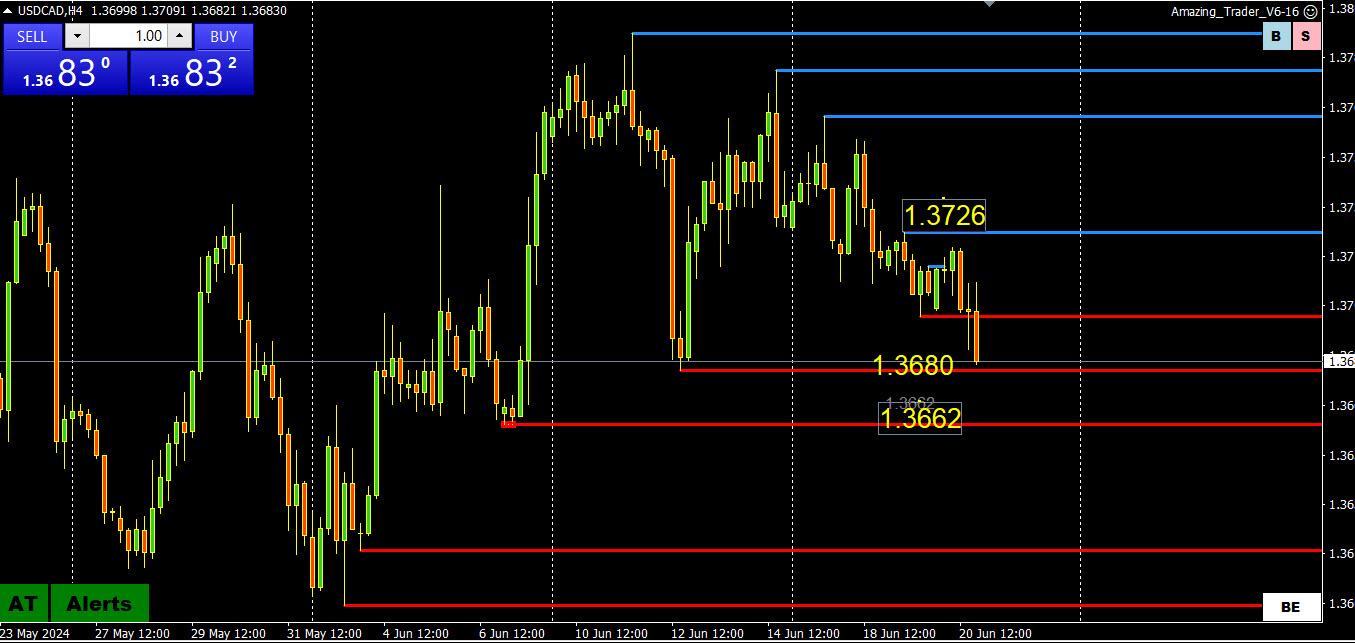
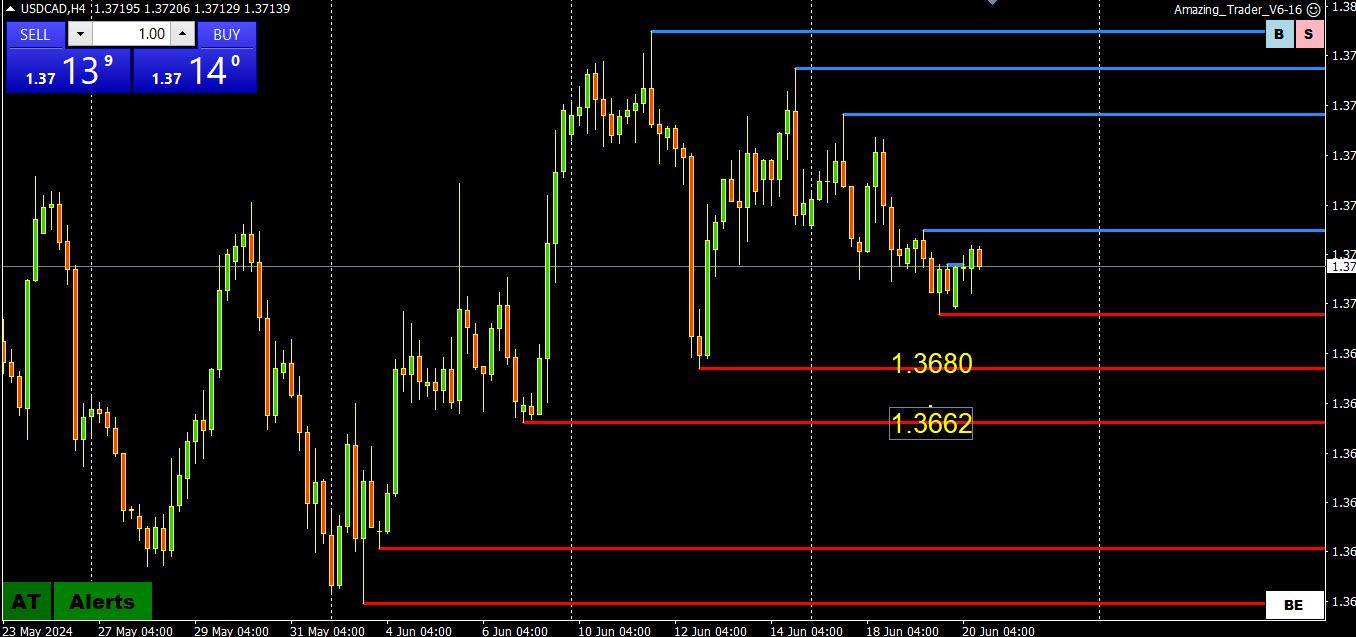
USDCAD 4 HOUR CHART DOVISH BOC BUT…
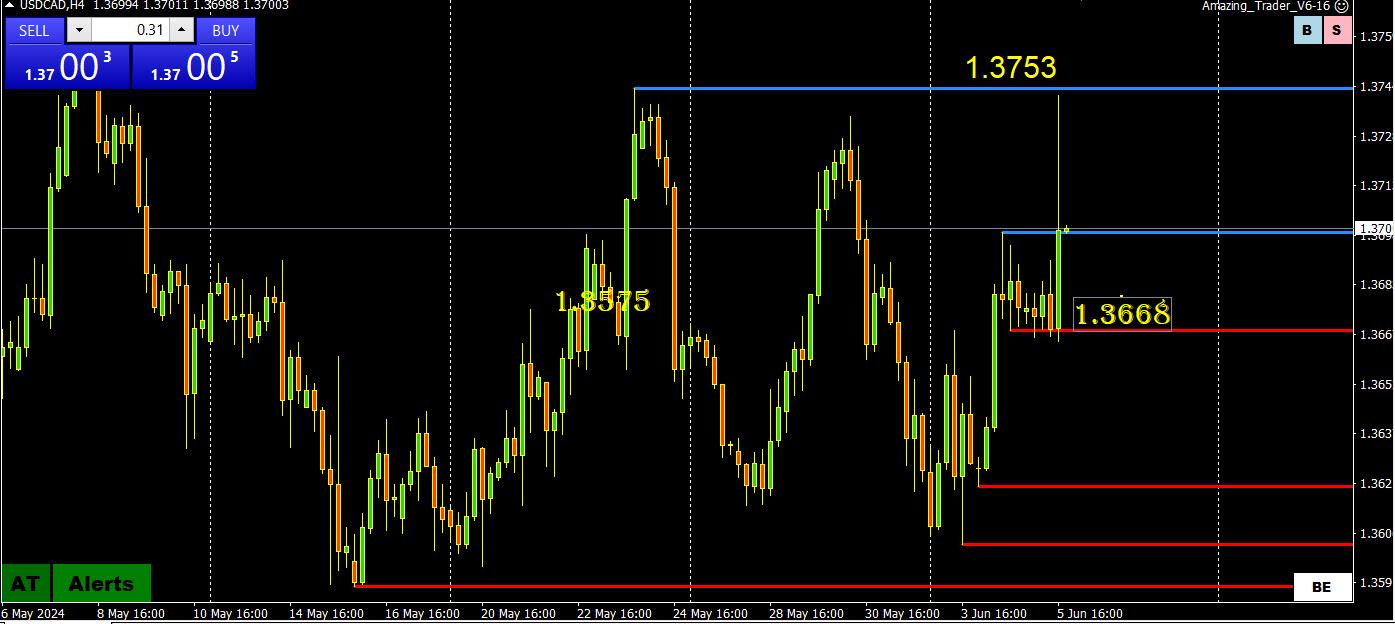
You couldn;t get any more dovish than the BOC rate cut and statement yet USDCAD stopped dead on around Amazing Trader resistance.
Does this suggest it is a prelude to tomorrow’s ECB expected rate cut, which is expected to take a more cautious tone looking ahead.
June 5, 2024 at 10:18 am #7277In reply to: Forex Forum
USDCAD 1.3682
BoC is “looking for evidence that momentum is sustained”
–
Economists Lean Toward Bank of Canada Interest Rate Cut on Wednesday Canada’s central bank could be the first among G-7 authorities to begin policy easing after aggressive rate increases to curb inflation By Paul VieiraCanada’s central bank could be the first among G-7 authorities to begin policy easing after aggressive rate increases to curb inflation
June 4, 2024 8:00 am ET|WSJ ProOTTAWA—Most economists expect the Bank of Canada on Wednesday to cut its main interest rate for the first time in four years, as data point to a monthslong slowdown in inflation, a cooling in labor-market activity and lackluster growth.
Eleven of 15 economists surveyed by The Wall Street Journal predict the Bank of Canada will cut its target for the overnight rate by a quarter-point, to 4.75%. The other four said central bank officials might wait to cut until its late July decision, to ensure additional data provide comfort that inflation is heading toward its target of 2%. Canada’s central bank sets interest-rate policy to achieve and maintain 2% inflation.
June 3, 2024 at 6:34 pm #7195In reply to: Forex Forum
June 3, 2024 at 1:40 pm #7167In reply to: Forex Forum
June 3, 2024 at 12:52 pm #7164In reply to: Forex Forum
USDCAD 4 HOUR CHART – biding its time?
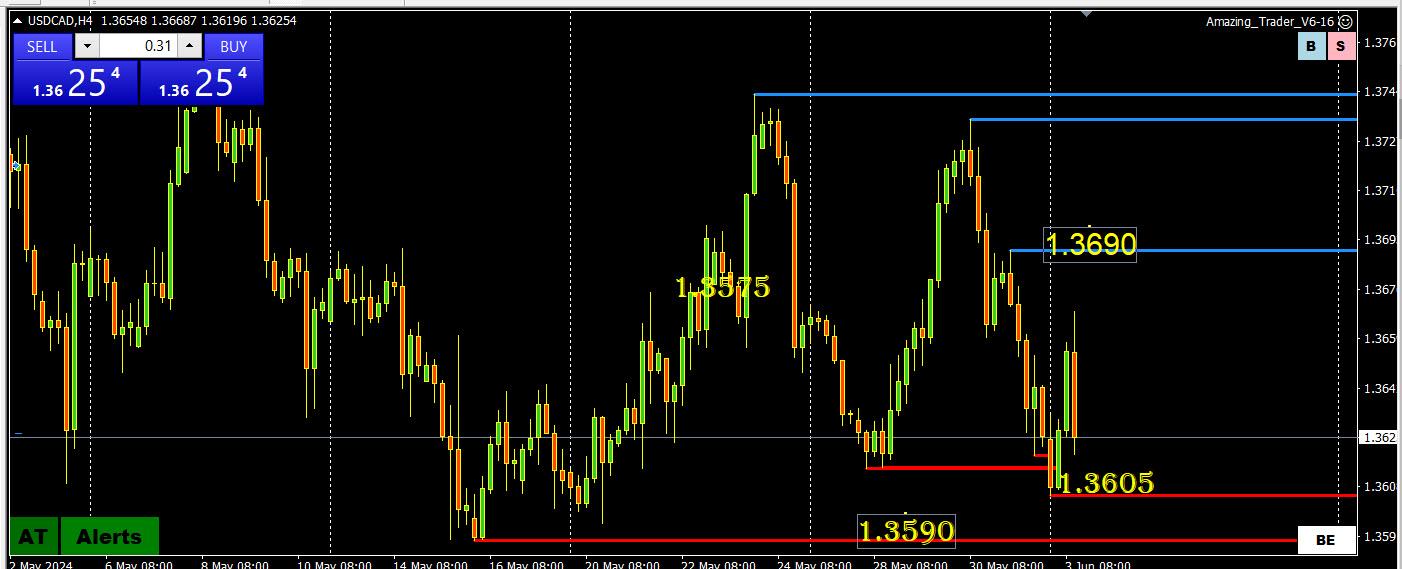
USDCAD seems to be biding its time ahead of the BoC meeting this week.
Chart shows it trying to build downward monentum that would need to take out 1.3590 to suggest more scope on the downside.
‘
If it holds between 1.36-1.37 then 1.3650 will set its intra-day bias.May 31, 2024 at 6:11 pm #7106In reply to: Forex Forum
May 31, 2024 at 9:45 am #7063In reply to: Forex Forum
USDCAD 4 HOUR CHART – OUTPERFORMING
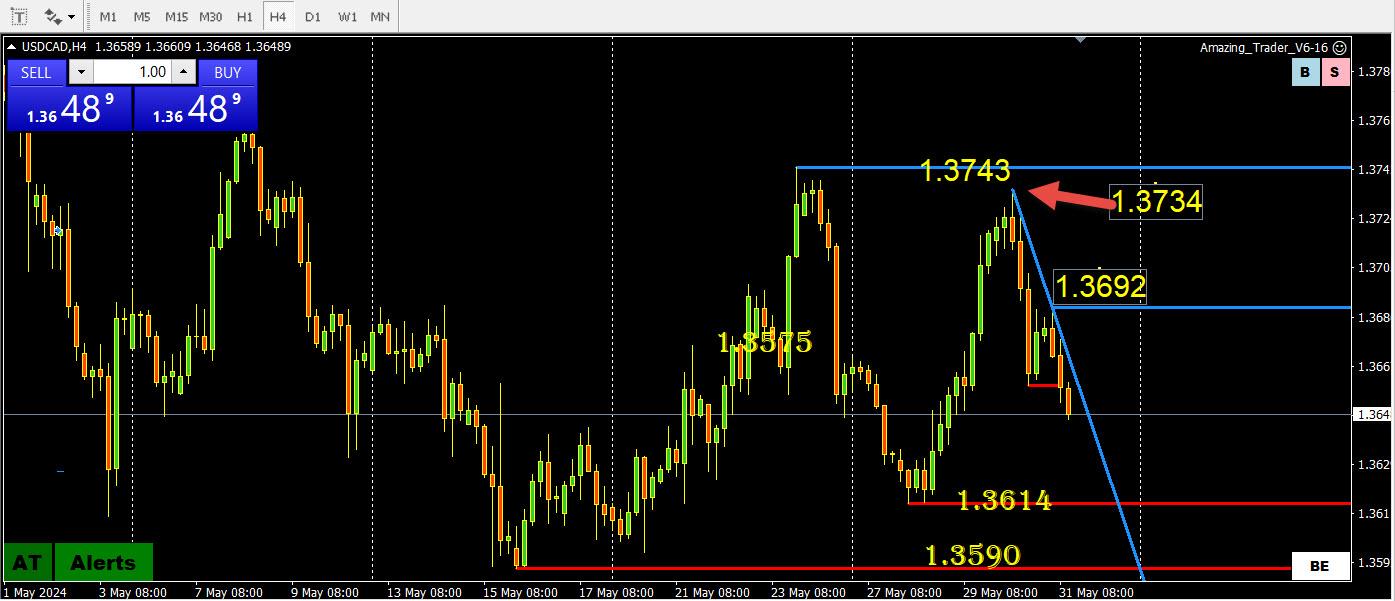
Having failed to test 1.3743, USDCAD is testing its downside and so far an outperformer..
Whether month-end USD selling is a factor would only be a guess.
In any case, the bottom of the range is at 1.3590-136,14 with 1.3650 likely to set the tone as the day foes on.
As with other currencies, US PCE is the next key focus.
May 29, 2024 at 1:30 pm #6973In reply to: Forex Forum
USDCAD 1 hour CHART – RISK OFF
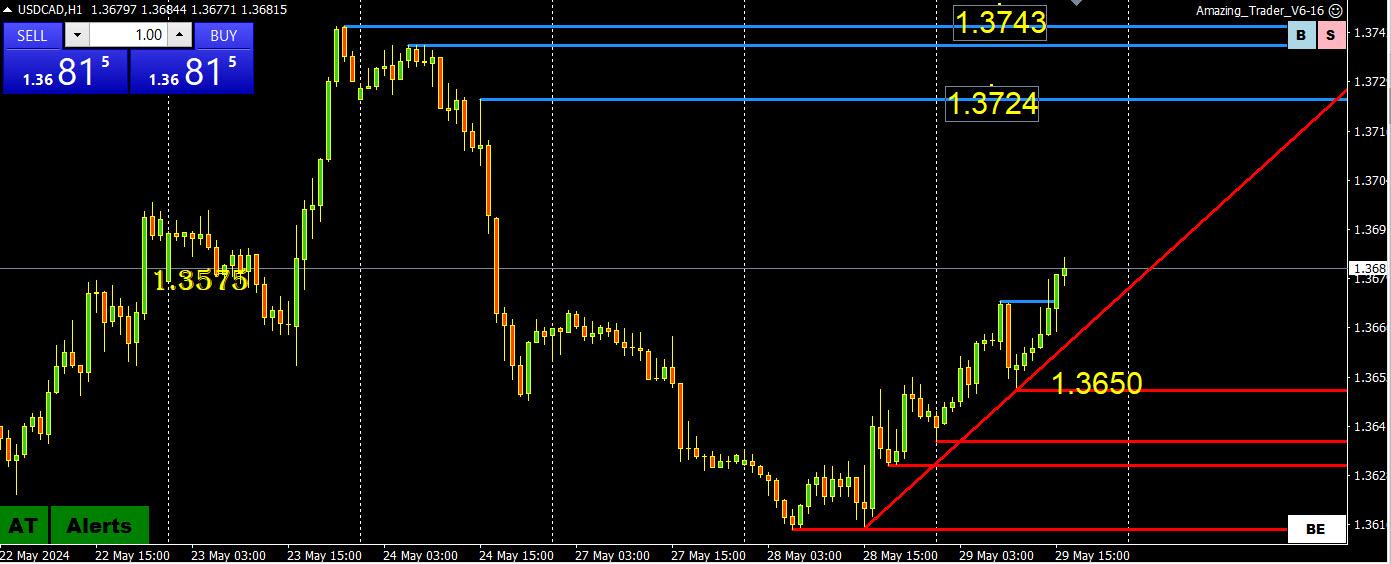
A risk off tone in equities is weighing on commodity currencies.
As can be seen on this chart, rising red AT lines are showing up momentum with support while above 1.3650.
However, there is a void of key levels on top until above 1.37, which means no obvious stop levels to go after, making the high of the day the closest resistance.
May 24, 2024 at 3:01 pm #6822In reply to: Forex Forum
May 24, 2024 at 12:15 pm #6799In reply to: Forex Forum
USDCAD 4 HOUR CHART -backing Off But…
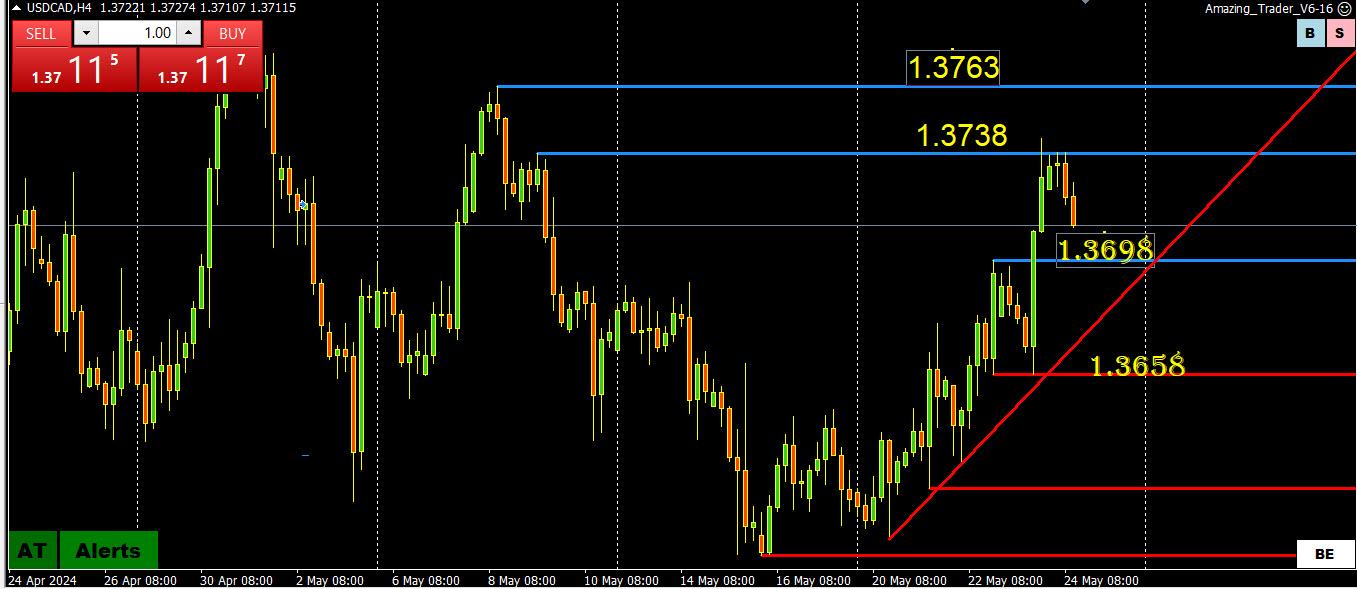
USDCAD followed general USD moves and backed off after failing to stay above 1.3738 and not testing 1.3763.
Now needs to hold 1.3698 to keep these levels for a strong bid but expect support as long as the trendline and 1.3658 hold.
Next up: Canadian Retail Sales – See our Economic calendar
May 22, 2024 at 1:21 pm #6636In reply to: Forex Forum
USDCAD 4 HOUR CHART – KEY RESISTANCE CITED
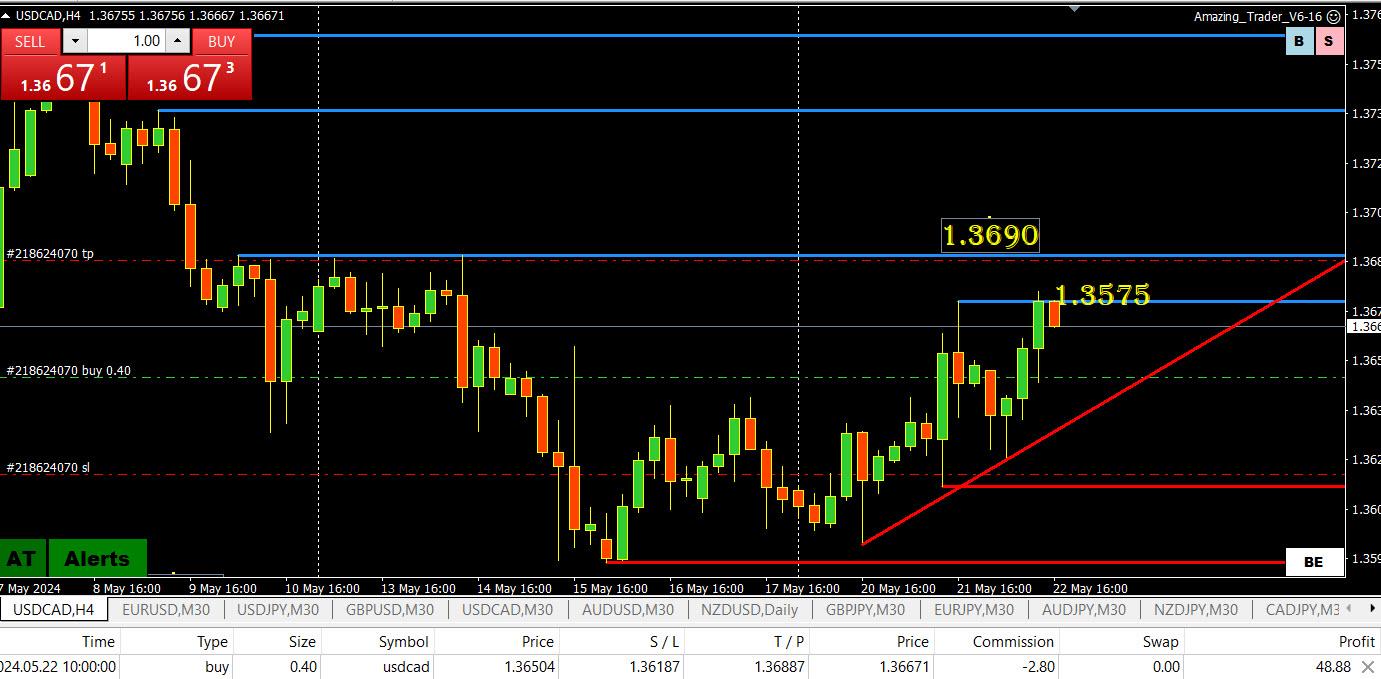
USDCAD testing its upside but would need to get through 1.3690 (see chart) to confirm the low is in and suggest more scope on the upside.
TRxpect support as long as it trades above 1.3650 but price action is still within the current range.
Note the trade at the bottom of this chart was an earlier AT Alert.
-
AuthorSearch Results

Search
© 2024 Global View