USDCAD Swings Lower: Range Trading or Downtrend Resumption?
USDCAD has experienced some volatility recently, breaking above resistance, pulling back, and now testing support. Let’s analyze the technicals to understand what this means for the pair’s near-term direction.
From Breakout to Range Trading?
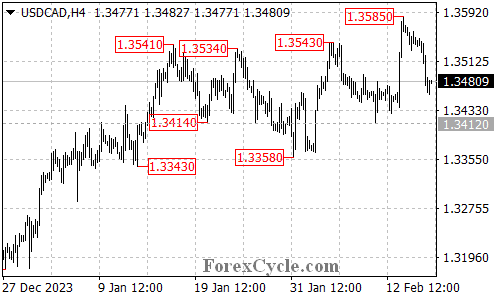
Resistance Breached: USDCAD initially broke above the key resistance level of 1.3543, suggesting potential upside.
Pullback and Support Test: However, the pair has since pulled back and broken below the 1.3510 support level.
Range Trading Possibility: This price action suggests a potential range trading scenario between 1.3358 and 1.3585.
Further Downside or Bounce in Sight?
Next Support Level: If the downtrend continues, the next potential support level to watch is 1.3412.
Breakdown Implications: A breakdown below 1.3412 could signal a resumption of the downtrend from 1.3176, with targets at the key support of 1.3358 and potentially even lower at 1.3300 and 1.3176.
Hope for Upside Rebound?
Initial Resistance: If the sellers lose momentum and buyers step in, the initial hurdle to overcome is the 1.3520 resistance level.
Upside Potential: Reclaiming this level could trigger a retest of the previous resistance at 1.3585.
Overall Sentiment
The technical picture is mixed for USDCAD. While the breakdown below 1.3510 suggests potential downside, the possibility of range trading within a defined range cannot be ruled out. Monitoring the price action around the mentioned support and resistance levels will be crucial to confirm the pair’s next move.
Disclaimer: This analysis is for informational purposes only and should not be considered as investment advice. Please conduct your own research before making any trading decisions.
Author
Search Results
Viewing 5 results - 451 through 455 (of 455 total)