
-
AuthorSearch Results
-
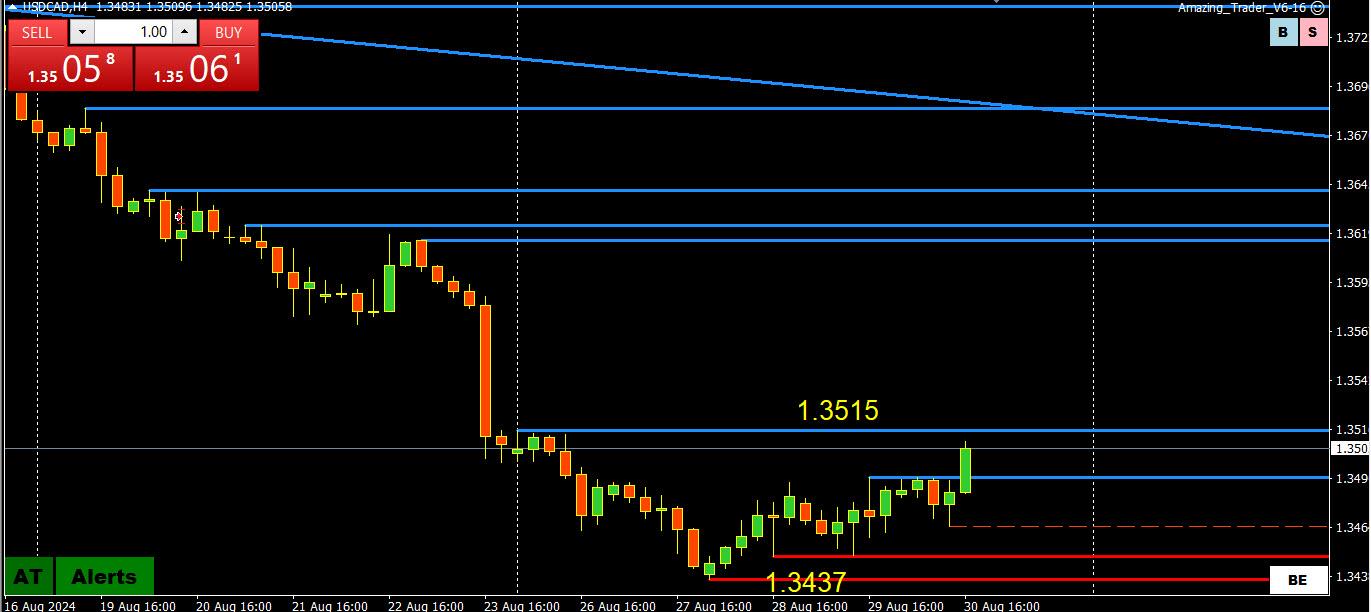
August 30, 2024 at 1:17 pm #11138
In reply to: Forex Forum
August 27, 2024 at 3:28 pm #11010In reply to: Forex Forum
August 27, 2024 at 11:12 am #10978In reply to: Forex Forum
August 26, 2024 at 8:57 am #10935In reply to: Forex Forum
I don’t remember a time when all the key currencies were focused on pivotal levels, which will dictate respective tones going forward.
(EURUSD 1.12, USDJPY 145, GBPUSD 1.32, USDCAD 1.35, AUDUSD .68)
See our
 August 23, 2024 at 3:19 pm #10873
In reply to: Forex Forum
August 21, 2024 at 11:30 am #10767In reply to: Forex Forum
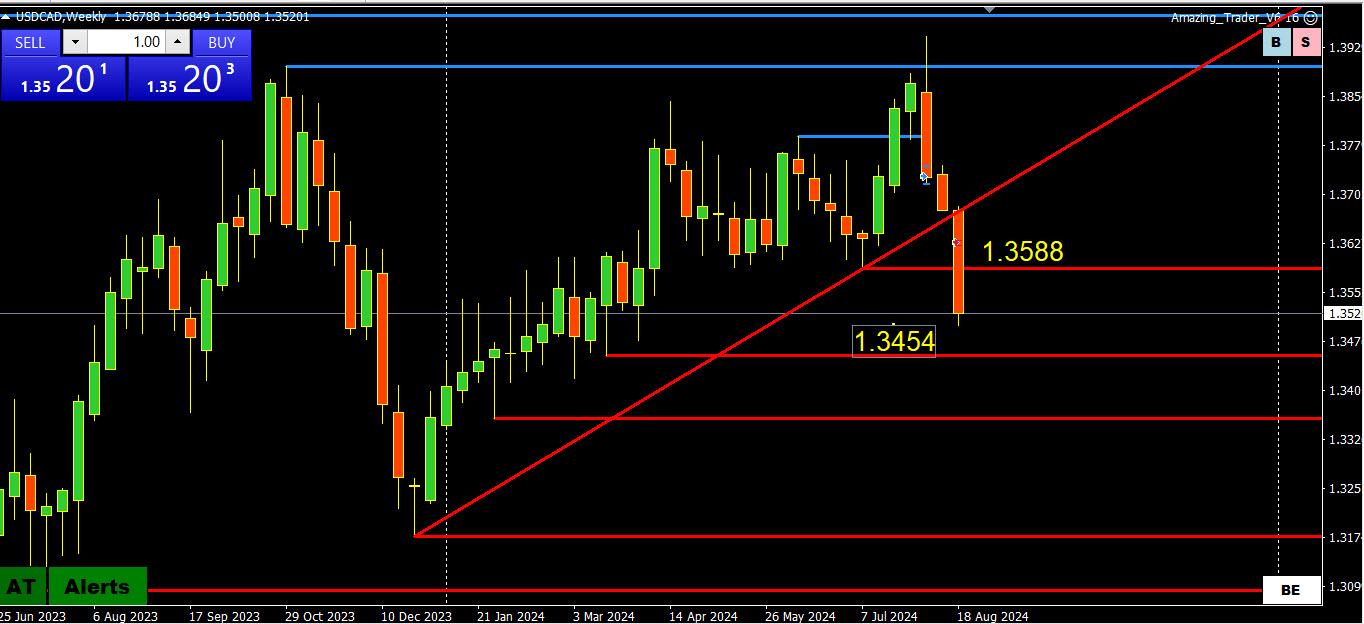
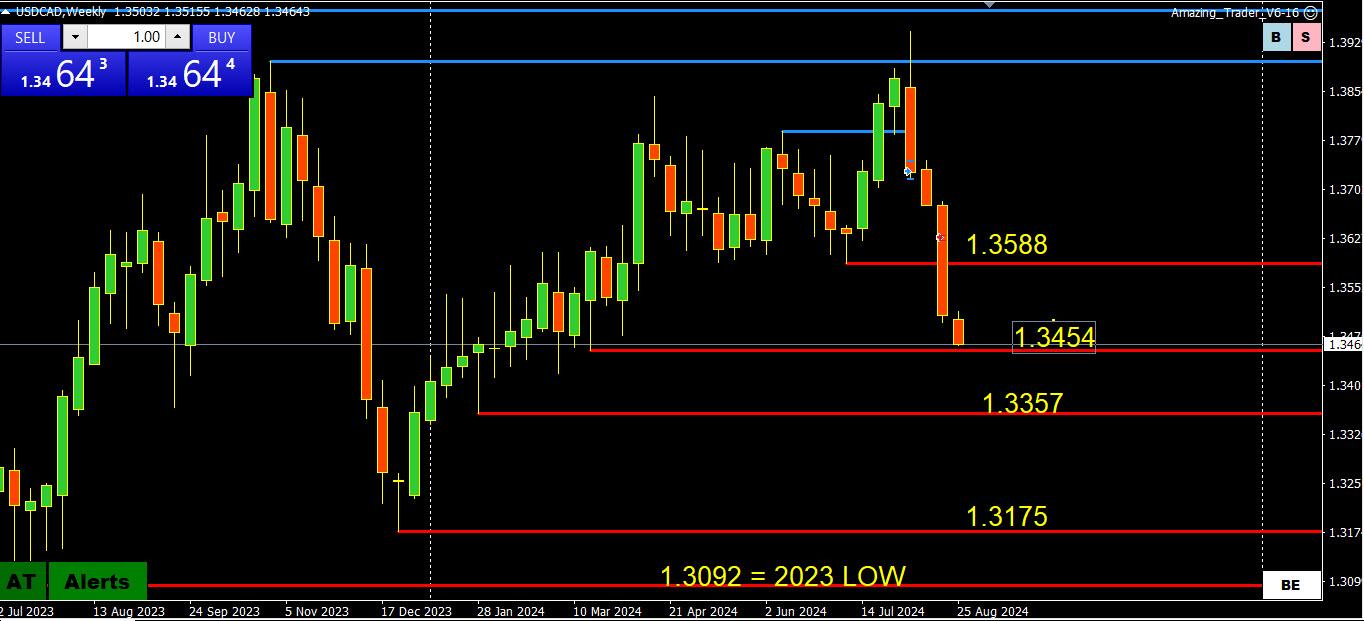
USDCAD WEEKLY CHART – KEY LEVEL LOOMS
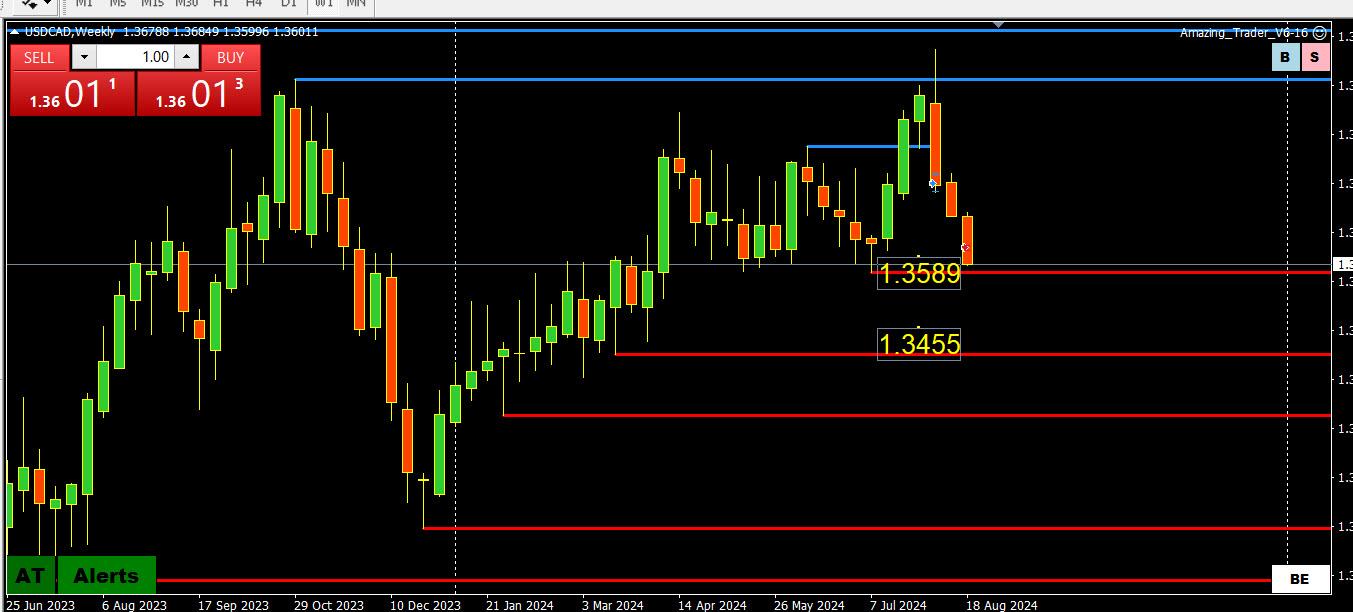
USDCAD shaking off Tuesday’s CPI report and continues to perform technically with the break of 1.3656 exposing the key level at 1.3589.
The significance of 1.3589 is that a firm break would confirm the top at 1.3977 and leave a void below it.
On the upside, there is a minor double top around 1.3624 ahead of 1.3641-56.
August 20, 2024 at 2:38 pm #10731In reply to: Forex Forum
August 20, 2024 at 12:42 pm #10719In reply to: Forex Forum
August 19, 2024 at 1:37 pm #10677In reply to: Forex Forum
USDCAD DAILY CHART – WEEKLY FX OUTLOOK AND CHART POSTED OVER THE WEEKEND
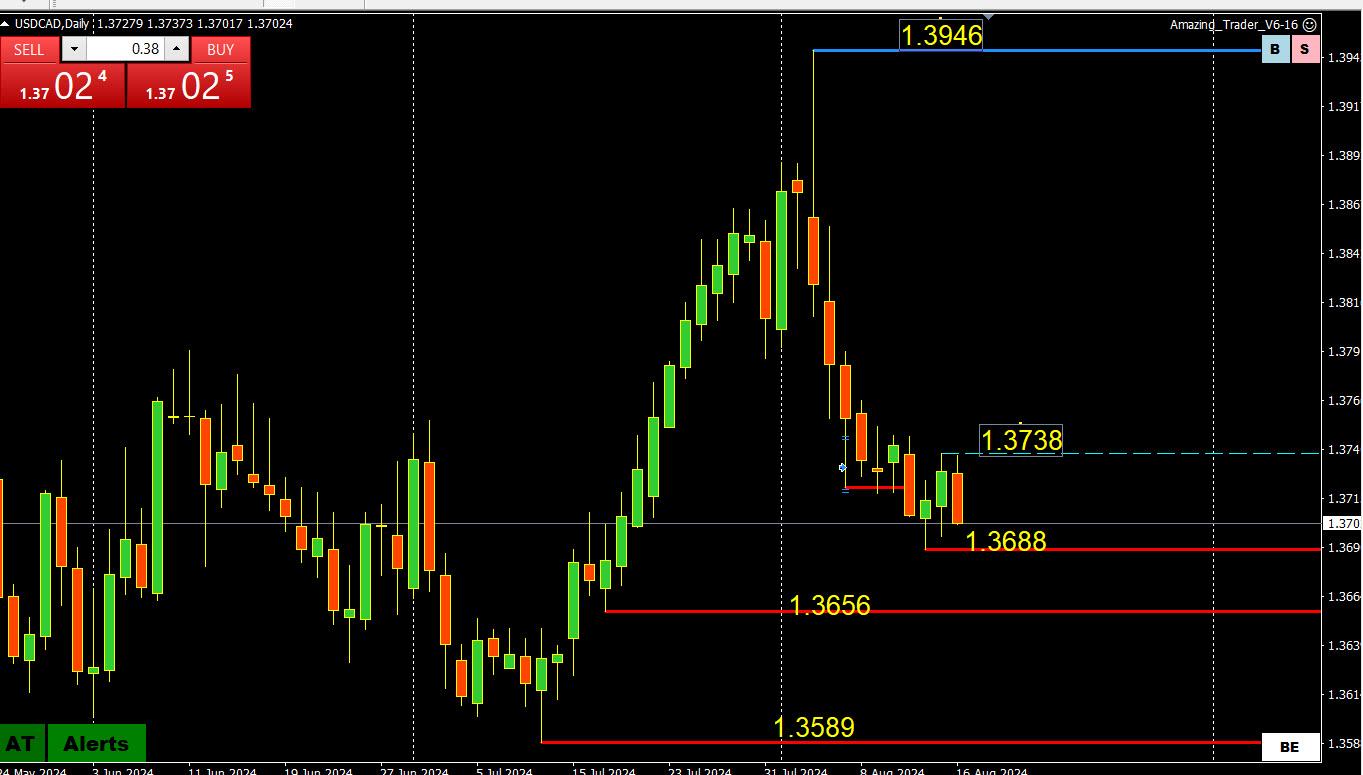
(NOTE, LAST TRADE AT 1.3666)
Trading in the background and more of a laggard than a leader.
Top is in, can it reverse to a downtrend?
Current focus is on a range around 1,.37, which will dictate whether it can go after 1.3656 and below.
On the upside, back above 1.3740-50 would be needed to shift focus back to 1.38.
August 19, 2024 at 12:19 am #10662In reply to: Forex Forum
August 12, 2024 at 12:26 pm #10391In reply to: Forex Forum
August 12, 2024 at 10:35 am #10385In reply to: Forex Forum
USDCAD WEEKLY CHART – COMMODITY CURRENCIES REBOUND

It makes sense since JPY carry trade unwinds hit commodity currencies the hardest, it is logical to see these currencies rebound (vs JPY as well) once the panic selling subsided.
What they have in common are the big wicks that suggested highs/lows are in for now.
USDCAD:
Intra-day support 1.3720
Daily chart support 1.3656
Key weekly support 1.3588 and the trendline
If it trades within 1.37-1.38, back above 1.3750-60 would be needed to shift the focus back to 1.3790-00.
Note, AUD and NZD outperforming today, CAD lagging
August 9, 2024 at 2:51 pm #10314In reply to: Forex Forum
August 7, 2024 at 1:13 pm #10219In reply to: Forex Forum
August 7, 2024 at 11:35 am #10209In reply to: Common Sense Trading
How You Can Use Currency Crosses to Trade Spot Forex and Carry Trade (follow ups)
How do we know that cross flows are driving the market?
When two currencies move in opposite directions you can assume there are real money cross flows
Look at USDJPY and USDCHF (both up sharply) vs firmer commodity currencies and GBP is up as well once the carry trade unwinds ended.
Currently:
USD STRONGER
USDJPY +2.0%
USDCHF +1.4%USD WEAKER
GBPUSD =0.3%
USDCAD -0.3%
AUDUSD +0.7%
NZDUSD +1.1%August 7, 2024 at 10:44 am #10201In reply to: Forex Forum
USDCAD 4 HOUR CHART – testing support

As noted, commodity currencies benefiting from a bounce in risk and end, for now, to the carry trade unwind.
As this chart shows, USDCAD has layers of support (tested 1.3743) but is on the defensive as long as it trades below 1.3787/90/1.38
If it trades 1,37-1.38, then keep an eye on 1.3750 to set its tone.
August 6, 2024 at 6:50 pm #10185In reply to: Forex Forum
August 6, 2024 at 6:40 pm #10184In reply to: Forex Forum
August 6, 2024 at 3:36 pm #10168In reply to: Forex Forum
USDCAD 4 HOUR CHART – 1.38
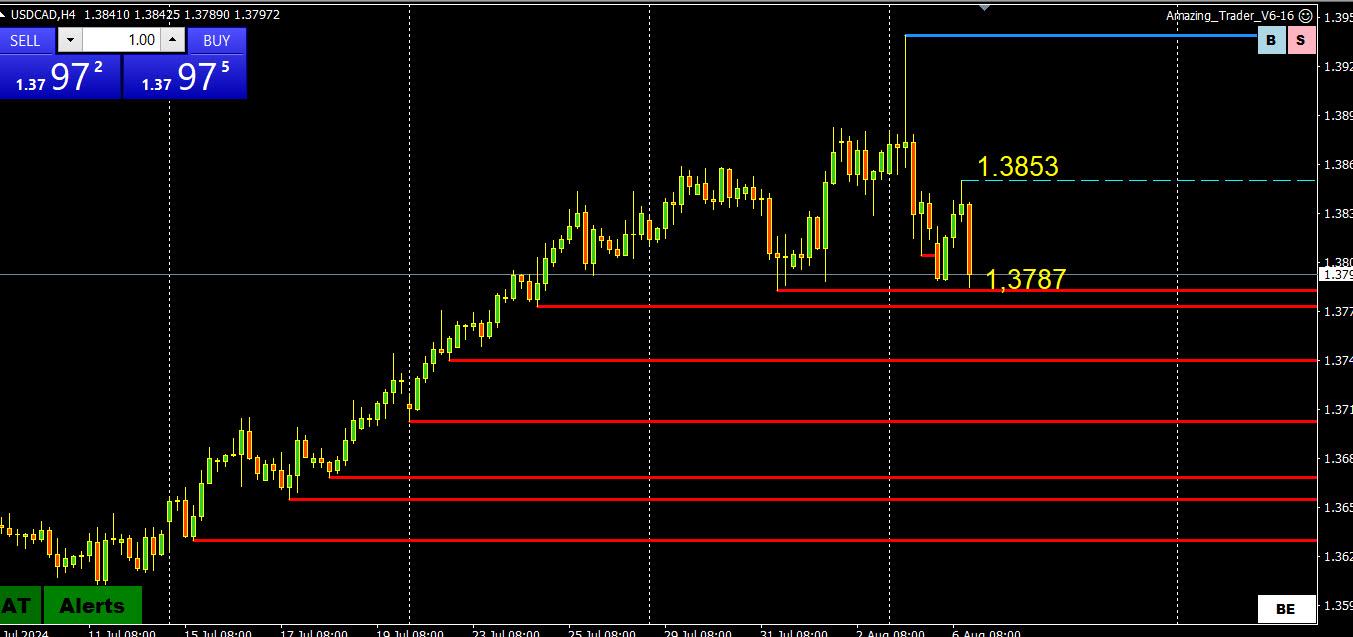
While there are layers of (red line) support below the market, the spike high and quick retreat has wiped the deck of buy stops.
As this chart shows, 1.3787 is a key support but as noted, there are layers of (red line) support below it.
In any case, 1,38 will set its tone.
August 6, 2024 at 2:29 pm #10164In reply to: Forex Forum
August 6, 2024 at 2:24 pm #10162In reply to: Forex Forum
August 5, 2024 at 12:36 pm #10089In reply to: Forex Forum
USDCAD WEEKLY CHART – PAUSE BELOW MAJOR HIGH
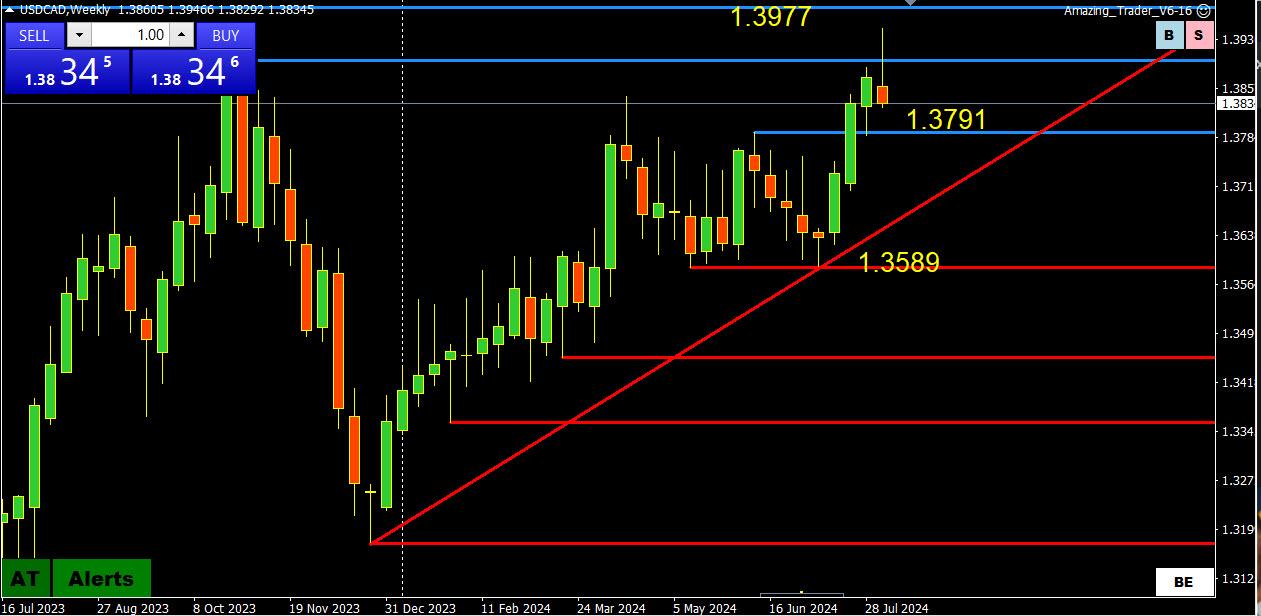
USDCAD reversing after pause below 1.3977
Still just a retracement as key levels are distant.
The move down is consistent with the repatriation argument during times of stress.
A close below 1,3834 would produce an outside day key reversal (questionable how well it works in FX). but 1.38 is likely most important in keeping the bid.
July 31, 2024 at 2:41 pm #9849In reply to: Forex Forum
Trying out the buy side of UsdCad in the 80’s here for small gains only. See the tide turning to the sell side overall in time in coming days. Fundamentals support the idea, flows are not necessarily exactly when you want them. Internals (forwards, options, futures, rates, orders, order flows, percents and the rest) are heavily stacked against Canadian Dollar itself overall at present.
July 31, 2024 at 2:31 pm #9847In reply to: Forex Forum
July 31, 2024 at 2:27 pm #9846In reply to: Forex Forum
July 31, 2024 at 1:48 pm #9844In reply to: Forex Forum
July 31, 2024 at 1:08 pm #9841In reply to: Forex Forum
July 30, 2024 at 9:30 am #9776In reply to: Forex Forum
USDCAD WEEKLY CHART – NEW 2024 HIGH
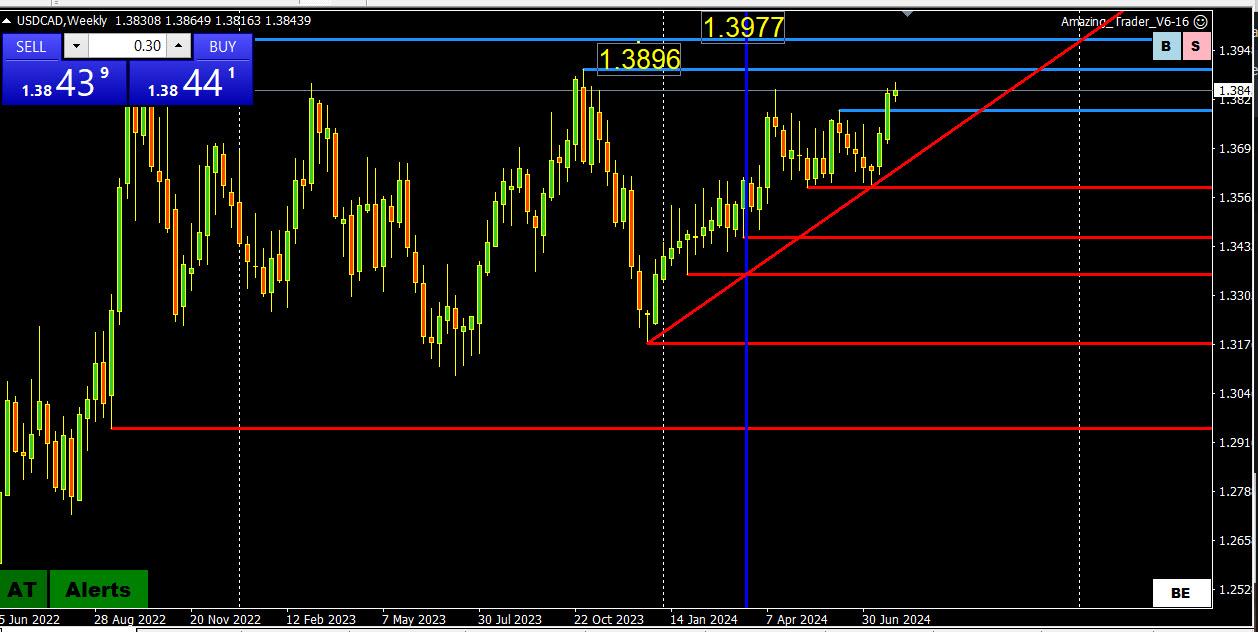
Having traded to a new 2024 high (1.38653, I went to a weekly chart to fimd
1.3896 – 2023 high
1.3977 = 2022 high
as the next key levels on the upside.
For day traders, 1.3850 will likely set its tone with support on deep dips as long as it trades above 1.38 but no stops left unless a new high is made..
Next key even is the US FOMC deision on Wednesday.
July 24, 2024 at 3:19 pm #9590In reply to: Forex Forum
Bank of Canada Governor did not provide much verbiage of weight for consideration. The tone was there is not set in stone path of policy at present, that rate cuts will be dependent on the condition of data as it transpires, and the .25 cut was to stimulate growth and is fine for now. The bottom line is their policy is stable and not on any razors edge. Futures are trending down so the proper approach is the buy side of UsdCad unless something profound develops.
That said, the current price area for futures and options are decent to test the buy (sell UsdCad in spot) side if you like rolling the dice, as you could hit a runner. Buy side of 7325 calls at the money look decent on the delta and such at the moment. So in spot that’s a sell from just above 3800.
July 24, 2024 at 12:51 pm #9582In reply to: Forex Forum
-
AuthorSearch Results

Search
© 2024 Global View