
-
AuthorSearch Results
-
July 3, 2025 at 8:48 am #27080
In reply to: Forex Forum
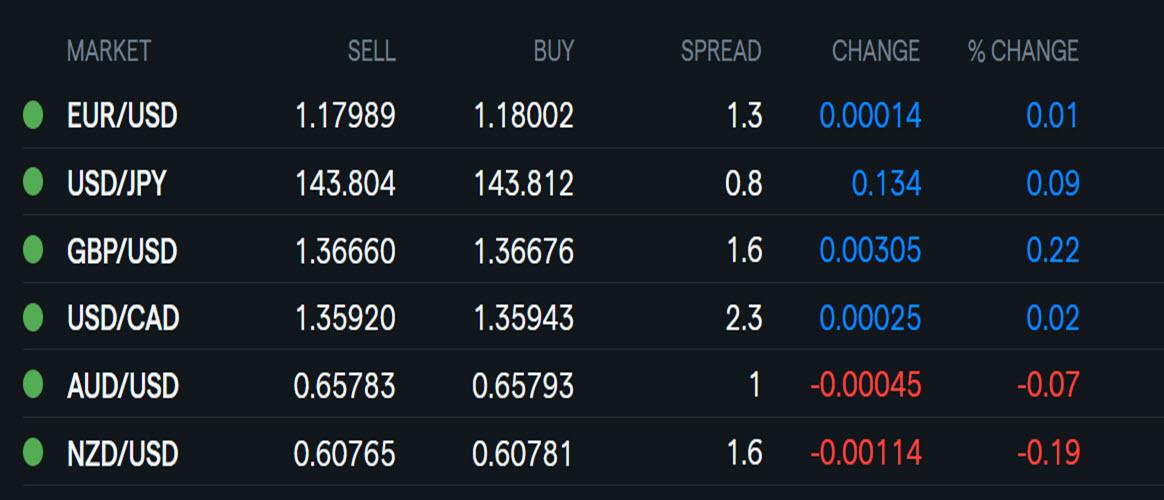
Using my platform as a HEARMAP shows…
… the dollar in a wait-and-see mode ahead of the key U.S. jobs report. EURUSD has traded around 1.18 three days in a row,, a level that will set the overall USD tone heading into the long US July 4 holiday weekend.
Gold is trading up but off earlier high
US stocks are treading water after extending record highs in the NAS100 and SP500 yesterday.
US bond yields are lower
Key data: US June employment report, ISM services PMI
Early US market closures
 July 3, 2025 at 12:56 am #27078
In reply to: Forex Forum
July 1, 2025 at 8:13 pm #27010In reply to: Forex Forum
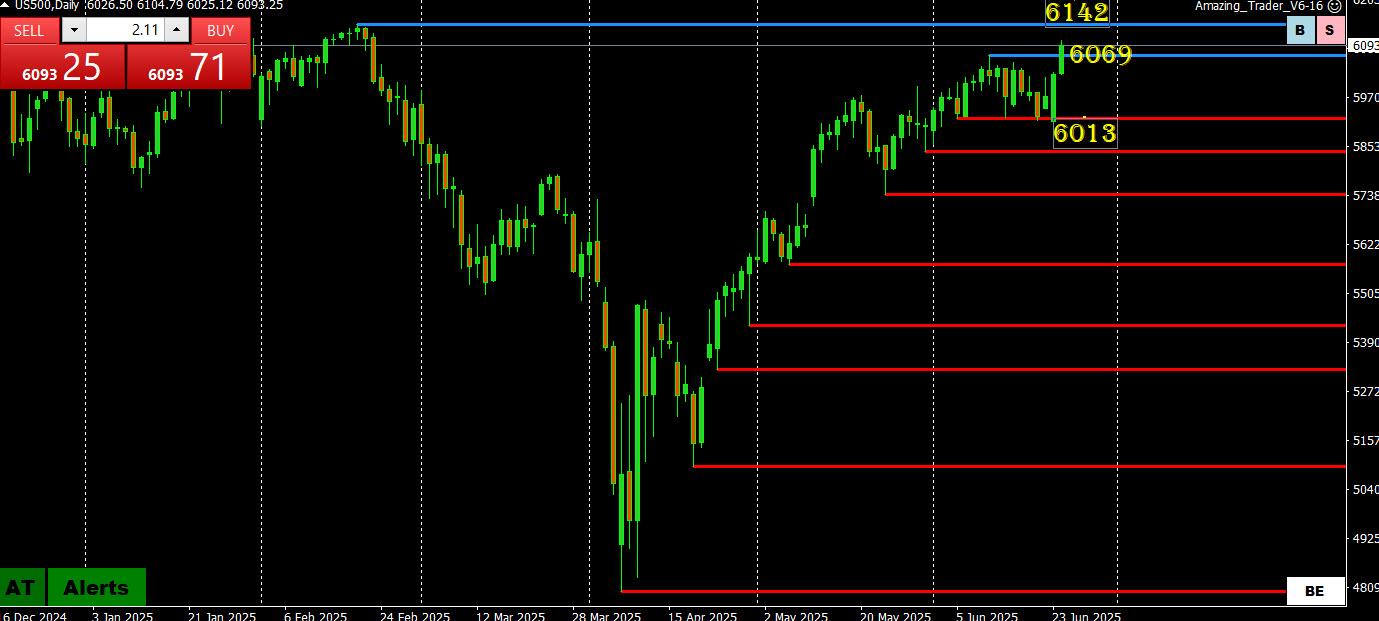
US500 (SP500)
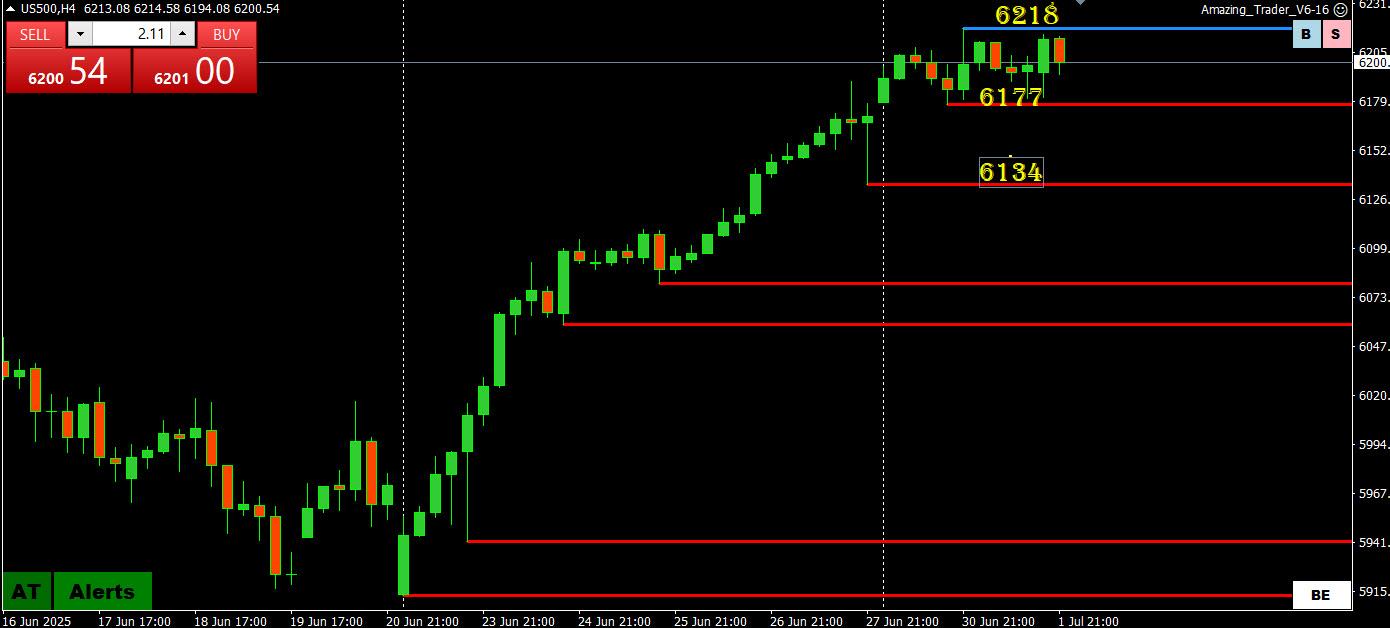
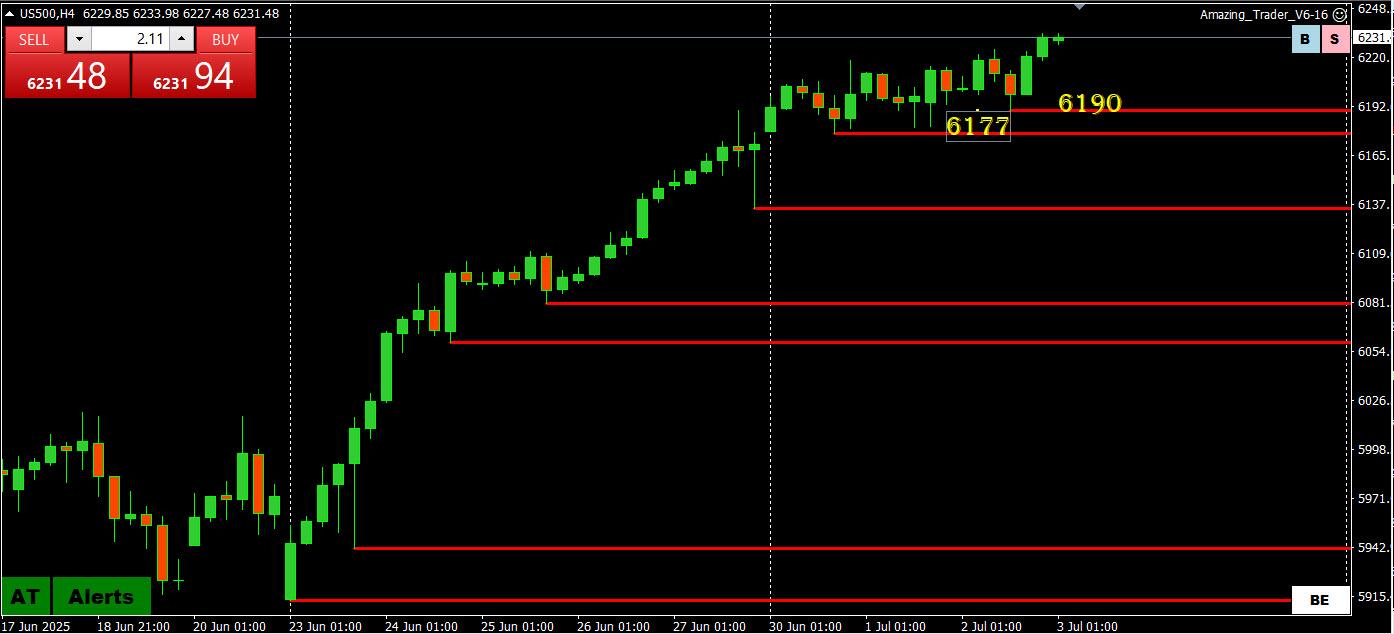
Unable to shake a focus from consolidating around 6200, which will dictate its tone going forward.
Meanwhile, US500 traded within its 6177-6218 range, one that is too tight to last for long.
Onus seems to be on the bull side to extend the high or risk is for stocks to turn defensive ahead of next week’s July 9th deadline day.
US500 (SP500) 4 HOUR CHART
 June 30, 2025 at 8:08 pm #26959
In reply to: Forex Forum
US500 (SP500)
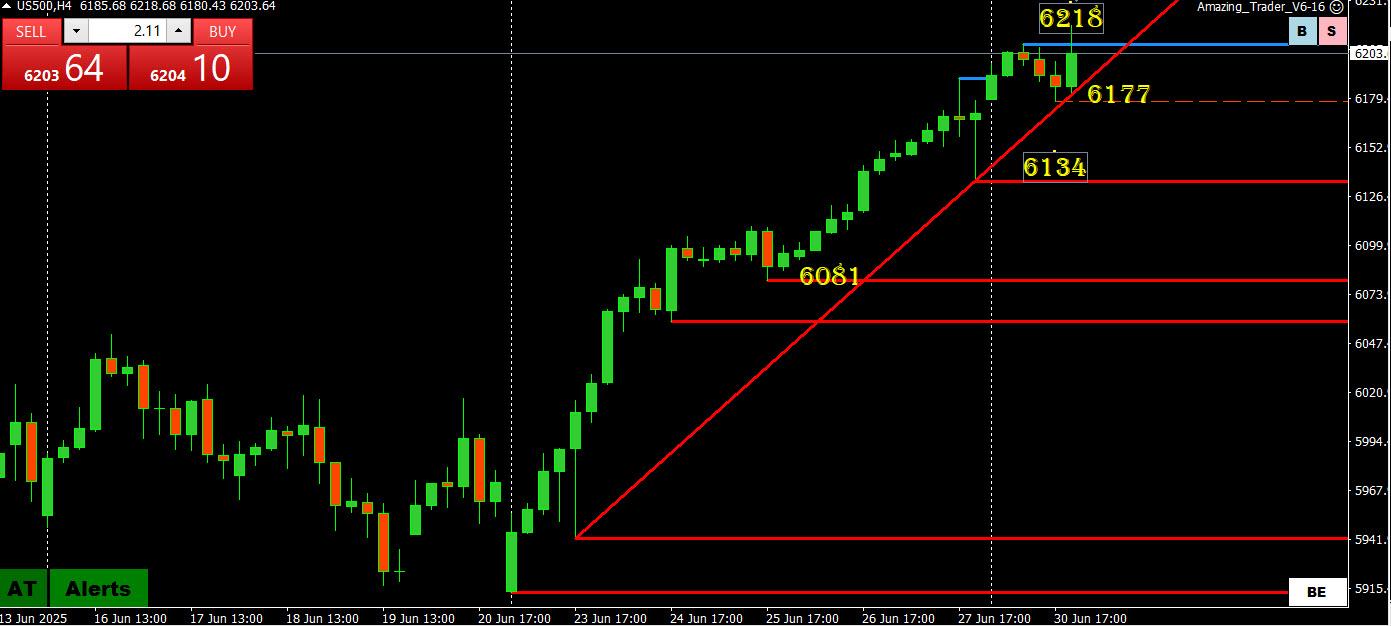
When in unchartered (record high) territory an absence of key levels leaves the most recent high (new record at 6218) as key resistance.
This leaves 6200 as the pivotal and bias setting level going forward.
Support at 6177 needs to hold to keep[ 6200+ on the radar.
A test for stocks will come after month/quarter end passes as fund/money managers will want to show investors that they are invested in the rally to record highs ahead of month end.
US500 4 HOUR CHART
 June 30, 2025 at 10:52 am #26910
In reply to: Forex Forum
US500 (SP500)
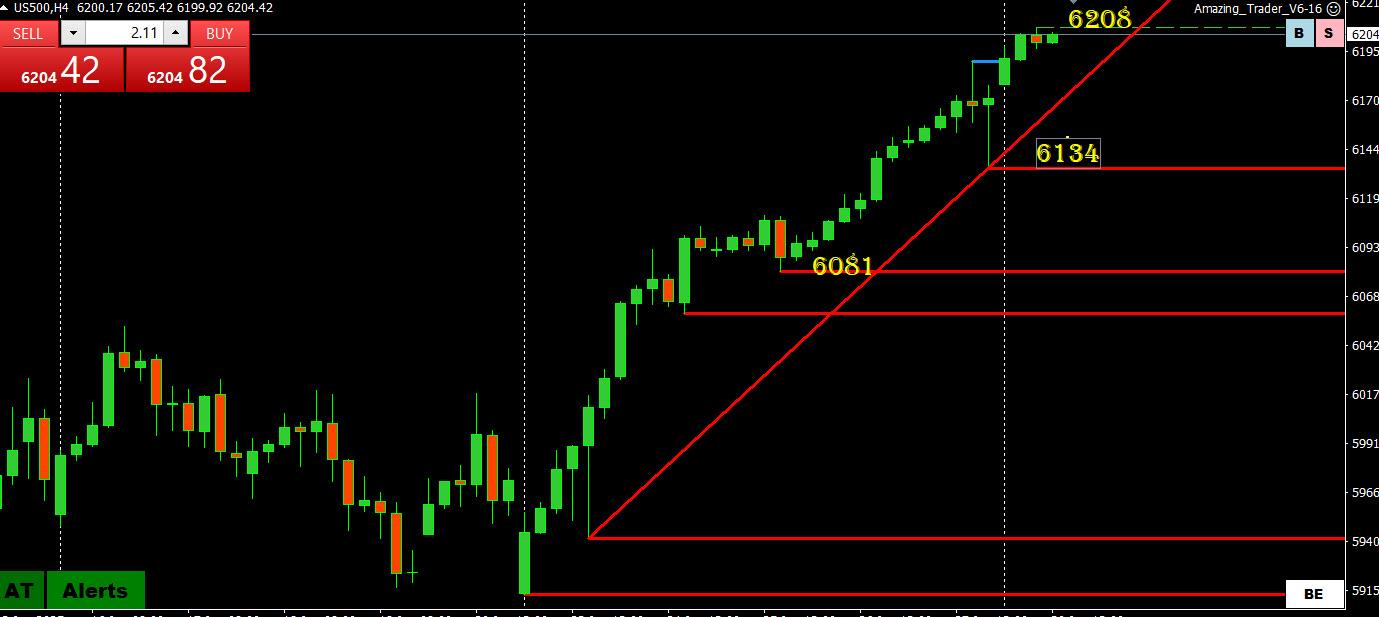
When in unchartered (record high) territory an absence of key levels leaves the most recent high as key resistance.
This leaves 6200 as the pivotal and bias setting level going forward.
A test for stocks will come after month/quarter end passes as fund/money managers will want to show investors that they are invested in the rally to record highs ahead of month end.
US500 4 HOUR CHART
 June 26, 2025 at 8:19 pm #26802
In reply to: Forex Forum
June 26, 2025 at 3:56 pm #26792In reply to: Forex Forum
June 25, 2025 at 7:53 pm #26748In reply to: Forex Forum
June 24, 2025 at 8:26 pm #26702In reply to: Forex Forum
June 23, 2025 at 7:51 pm #26651In reply to: Forex Forum
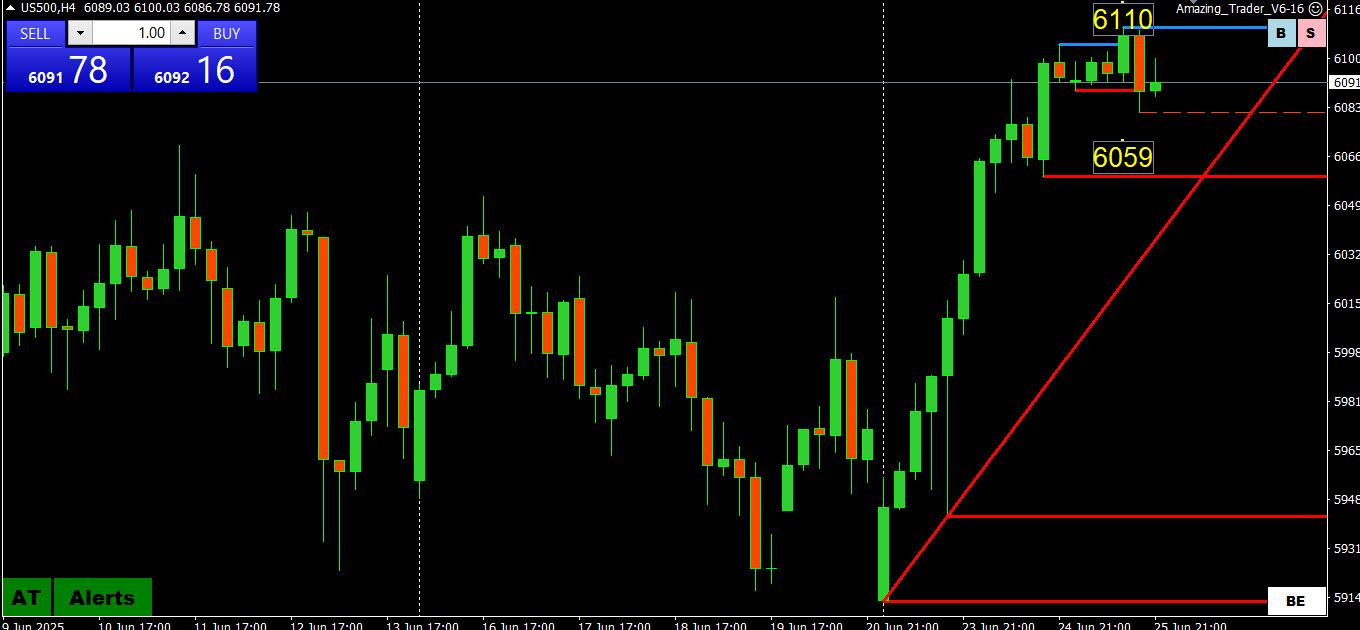
US500 (SP500)
Reversal of fortune after failure to test 5900.
Reaction to Iran retaliation was like a buy the rumor, sell the fact (or in this case sell the rumor, buy the fact).
Move back above 6000 needs to hold to have a bid, break 6025 and then 6052 to give this rebound more legs to the upside.
In any case, 6000 will continue to be pivotal in setting its tone.
US500 4 HOUR CHART
 June 23, 2025 at 1:57 am #26595
In reply to: Forex Forum
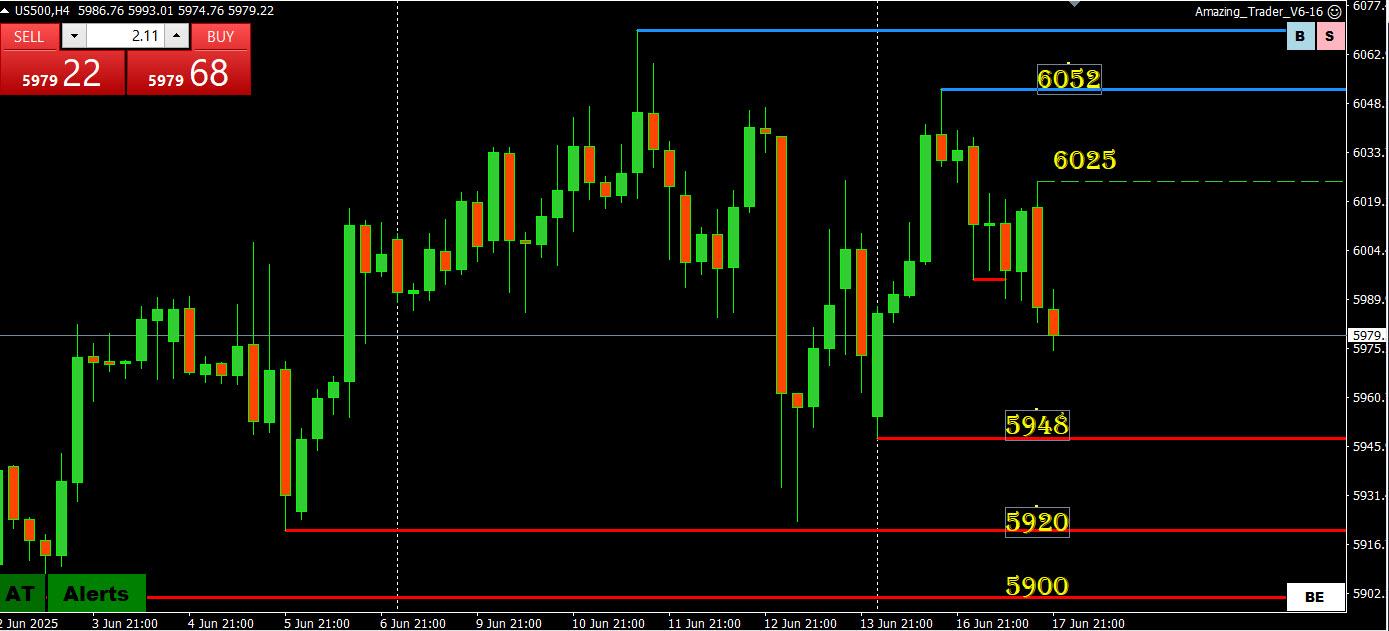
US500 (SP500)
Performing technically with the break of 5948 making a run at 5900. Below 5900 would put 5840-50 in plsy.
Back above 5950 would slow the risk, only 6000 negates it.
Watch US500 as an indicator of risk and the reaction to headline news for a clue as it will likely be geopolitical negative.
US500 4 HOUR CHART
 June 20, 2025 at 1:08 pm #26541
In reply to: Forex Forum
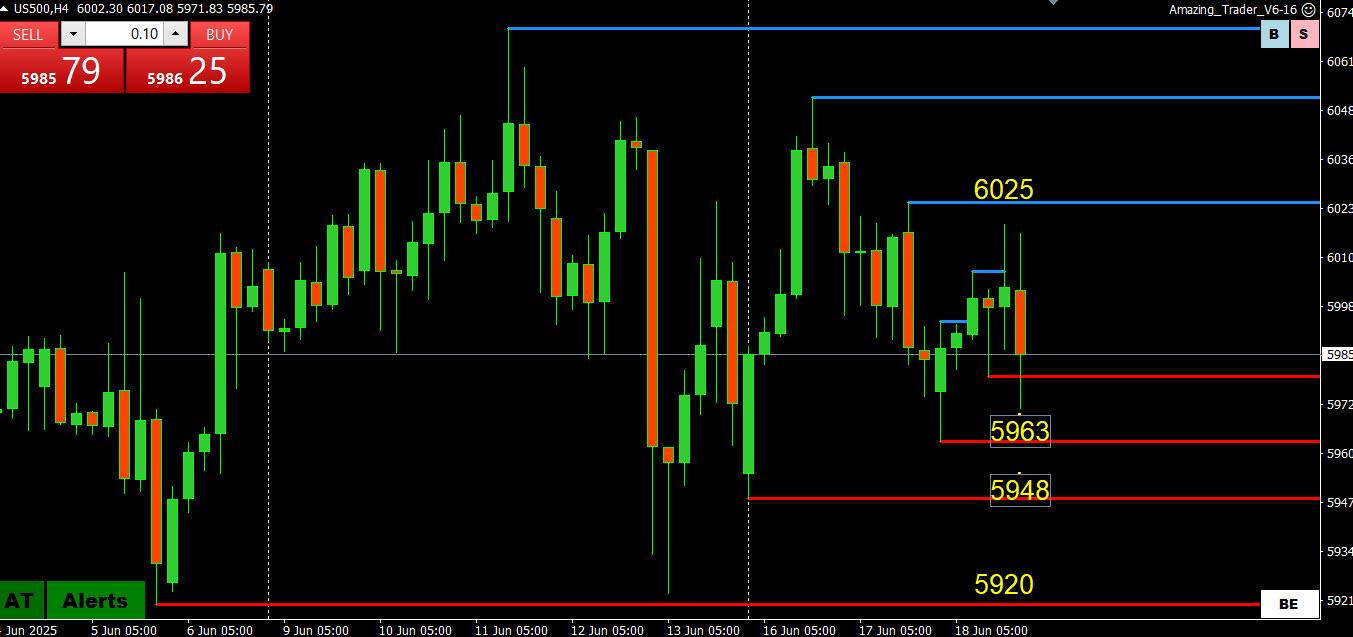
US500 (SP500)
Those in the US without access to CFDs opened their platforms and saw stocks up today. What they missed wasa US500 closing the day just above a 5915 low.
In any case, 6000 remains pivotal, 6025-52 the resistance zone and risk off has been given a repieve in what is now a wait-and-see market
US500 4 HOUR CHART
 June 19, 2025 at 6:59 pm #26507
In reply to: Forex Forum
US Futures Fall Further on Juneteenth Holiday
US stock futures fell further during Thursday’s Juneteenth holiday as heightening geopolitical conflict in the Middle East trimmed riskier positions, while markets continued to assess stagflationary risks from the Fed’s SEP. The three main averages were nearly 1% lower following Wednesday’s flat close.
The Federal Reserve held interest rates steady, with Chair Jerome Powell striking a cautious tone amid rising geopolitical and economic uncertainty.
Powell reaffirmed a data-dependent approach, pointing to unclear inflation impacts from President Trump’s tariffs and the risk of stagflation.
Fed projections now include two rate cuts in 2025, alongside downgraded growth expectations and higher inflation forecasts.
Investor sentiment was further dampened by escalating tensions in the Middle East, as the ongoing Israel-Iran conflict stoked fears of deeper US involvement.
Seven of the 11 S&P 500 sectors ended Wednesday day in the red, led by declines in energy, while technology outperformed.
SP500 chart
 June 18, 2025 at 8:06 pm #26465
In reply to: Forex Forum
June 17, 2025 at 8:25 pm #26411In reply to: Forex Forum
June 17, 2025 at 1:43 am #26365In reply to: Forex Forum
June 16, 2025 at 7:40 pm #26355In reply to: Forex Forum
June 16, 2025 at 3:36 pm #26341In reply to: Forex Forum
June 12, 2025 at 7:44 pm #26211In reply to: Forex Forum
June 12, 2025 at 1:11 pm #26180In reply to: Forex Forum
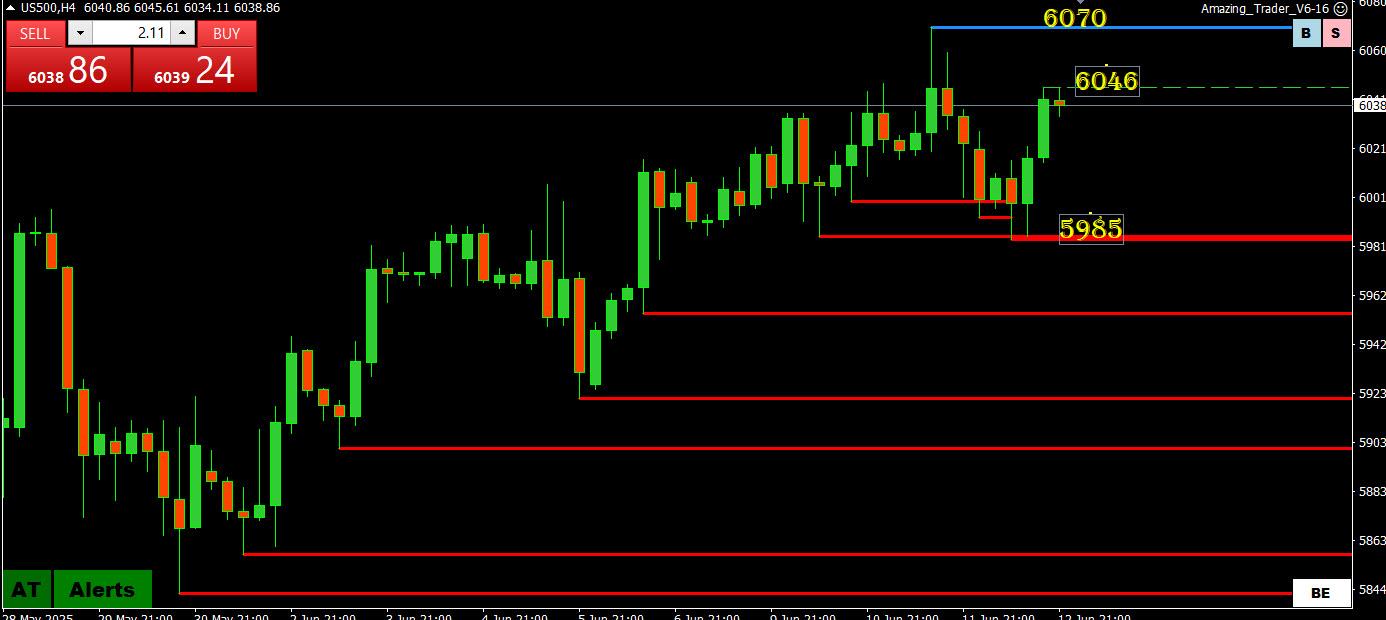
US500 (SP500)
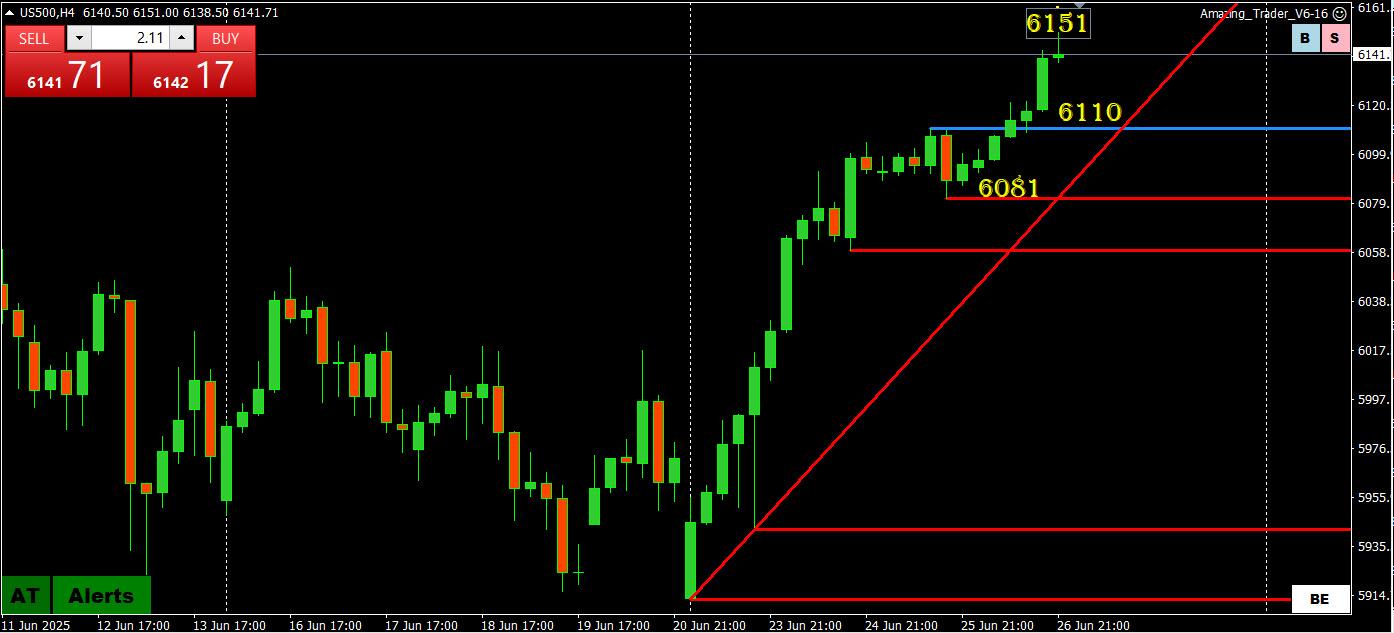
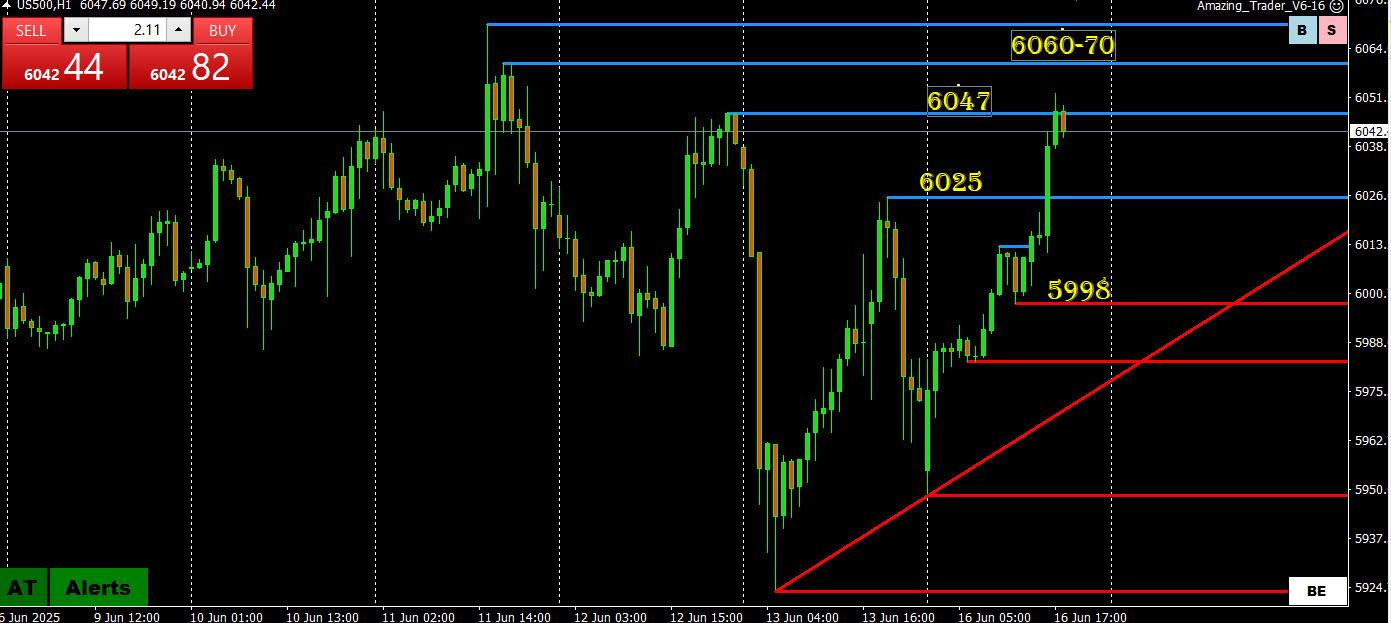
US500 getting a reprieve from lower yields following US data but only a break of 6070 would shift the focus from 6000 as the ultimate bias setter.
I posted this last night and another example that levels matter – low today so far 5986 but trendline has been broken
Trend up BUT
Disappointing after extension of its high to 6070 failed to follow through.
Now dependent on 5986 -00 and the trendline holding to keep a bid.
US500 (SP500) 4 HOUR CHART
 June 12, 2025 at 8:59 am #26164
In reply to: Forex Forum
Using my platform as a HEATMAP shows…
.. the dollar trading weaker, led by the EUR, JPY, CHF while GBP follows with a lag as mood turns to risk off .
Exceptions are AUD , NZD, CAD, NXN
What caught my eye is the USD did not get safe haven flows in rising Middle East concerns. Not mentioned as a factor but use of military to quell immigration protests is not helping the US image
US stocks are down,,, WATCH sp500 6000 AS PIVOTAL
US bond yields extending retreat following tame US CPI yesterday
Gold backed off after early spike higher but keeps a bid
Crude oil backing off a touch after sharp spike higher yesetdray
Data focus today:
US weekly jobless claims and PPI
 June 11, 2025 at 8:23 pm #26149
In reply to: Forex Forum
June 11, 2025 at 2:15 pm #26126In reply to: Forex Forum
June 10, 2025 at 8:19 pm #26084In reply to: Forex Forum
June 10, 2025 at 1:50 pm #26061In reply to: Forex Forum
June 9, 2025 at 7:49 pm #26028In reply to: Forex Forum
June 9, 2025 at 2:25 pm #26009In reply to: Forex Forum
June 9, 2025 at 10:33 am #25996In reply to: Forex Forum
June 7, 2025 at 3:05 pm #25970In reply to: Forex Forum
US Equity Indexes Rise in Week on Labor Market Resilience, Tech Gains, China Trade Talks
US equity indexes rose this week after a broad Friday rally on data signalling labor market resilience, along with gains by tech giants and easing US-China trade jitters.
* The S&P 500 rose to 6,000.36 on Friday from 5,911.69 a week earlier. The Nasdaq Composite climbed to 19,529.95 from 19,113.77, and the Dow Jones Industrial Average advanced to 42,762.87 from 42,270.07.
* Communication services and technology led sectors this week, while consumer staples posted the biggest drop. Meta Platforms META, Nvidia NVDA, and Amazon.com AMZN were among the top 10 gainers in a group of companies with a market capitalization of more than $200 billion.
* Nonfarm payrolls rose by 139,000 in May, the Bureau of Labor Statistics reported. The consensus was for a 126,000 increase, according to a Bloomberg survey. Gains for April were revised down by 30,000 to 147,000 and slashed by 65,000 for March.
* “Nonfarm payrolls remained resilient last month despite heightened trade policy uncertainty,” TD Economics senior economist Thomas Feltmate said in a note, referring to negotiations globally after Trump announced wide-ranging punitive import duties. While the downward revisions took “some of the shine off the headline payrolls print, it’s fair to say that the labor market is holding up better than expected,” he said.
* Investors awaited the Trump-Xi call amid concern trade talks had stalled. “I just concluded a very good phone call with President Xi, of China, discussing some of the intricacies of our recently made, and agreed to, Trade Deal,” Trump said Thursday. “The call lasted approximately one and a half hours, and resulted in a very positive conclusion for both Countries.”
* Top officials from the US will meet with a Chinese delegation in London on Monday to continue trade negotiations, Trump reportedly said Friday.
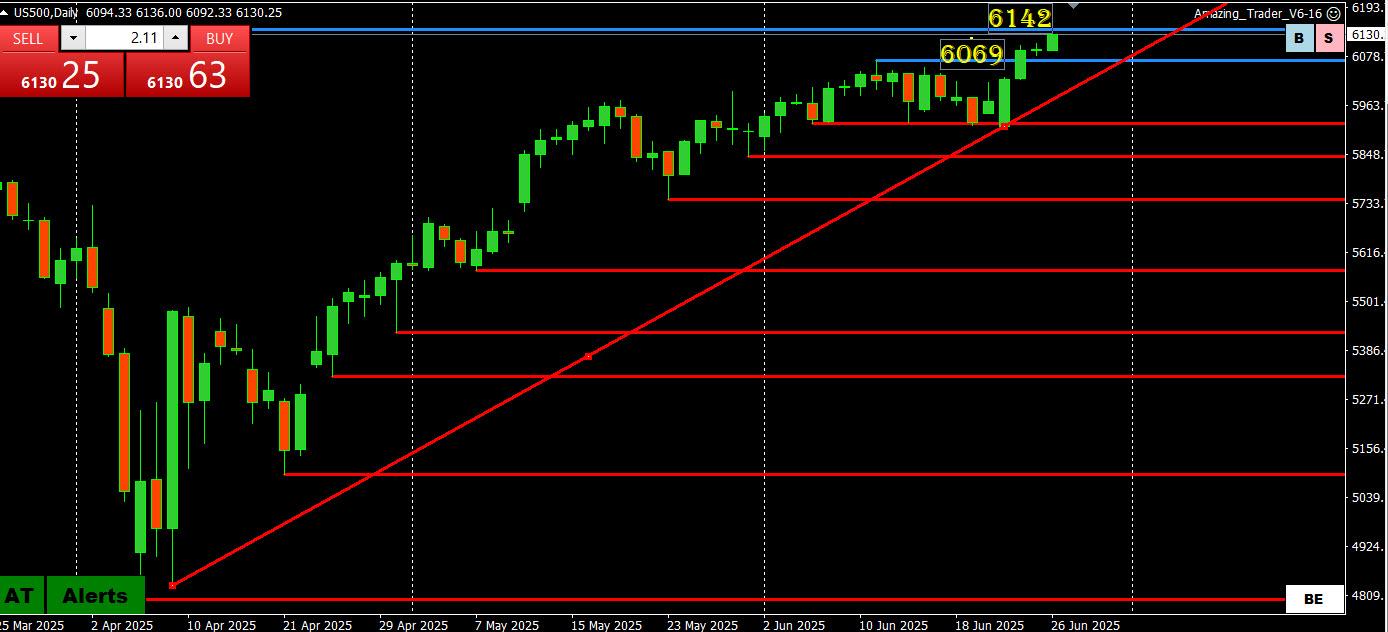
SP500 Chart
 June 6, 2025 at 3:20 pm #25949
In reply to: Forex Forum
-
AuthorSearch Results



Search
© 2024 Global View