
-
AuthorSearch Results
-
March 22, 2024 at 3:16 pm #3488
In reply to: Forex Forum
March 22, 2024 at 2:19 pm #3483In reply to: Forex Forum
March 22, 2024 at 11:39 am #3465In reply to: Forex Forum
March 22, 2024 at 11:31 am #3463In reply to: Forex Forum
March 22, 2024 at 10:17 am #3456In reply to: Forex Forum
EURUSD 4 HOUR CHART – Magic level a focus]

The failure to test 1.0945 has seen EURUSD retreat in line with a firmer USD.
The key chart support, as I noted yesterday, is 1.0795 but the magic 1.08 level is probably equally important as it will dictate the tone going forward.
On the upside back above the broken 1.0831, at a minimum, would be needed to ease the risk to 1.08.
No data from the US today.
March 21, 2024 at 2:05 pm #3415In reply to: Forex Forum
EURUSD 4 HOUR CHART

I like to look at longer time frames even though I rarely trade using them. What it does is put the current price moves in perspective and help me determine which side to trade from.
What still amazes me looking at this chart is how Amazing Trader algo levels, which I would not have put on a chart drawn manually, often hold, such as the 1.0945 level in this chart (and I created the program).
Looking at the chart, 1.09 will continue to be a focal point until it is established on either side.
In the meantime, expect some support as long as it can hold above the 1.0877 level broken yesterday but on the other side, upside is limited unless 1.0945 is broken (high today 1.0942).
March 21, 2024 at 1:27 pm #3411In reply to: Forex Forum
March 21, 2024 at 1:23 pm #3410In reply to: Forex Forum
March 21, 2024 at 9:49 am #3399In reply to: Forex Forum
March 20, 2024 at 1:18 pm #3336In reply to: Forex Forum
Would anyone care to explain here how the FOMC decision and any speculation further on will reflect on USD…
What is going to happen with EURUSD if rates are cut ?
What if not ?
What if rates are raised ??
And why…what is behind the strength/weakness of USD i cases above ?
What is the logic of all of it ?
March 20, 2024 at 11:37 am #3331In reply to: Forex Forum
EURUSD Daily
Resistances : 1.08850 1.09450
Supports : 1.07950 1.07550
Aside of these obvious levels, and the fact that we are in Sell mode right now, there are few facts that has to be taken into account…
That downtrend line up there – it is more of a correction angle , then anything else…
So they still might try for the 1.10+ area
I would like to see it bellow 1.06 , before we declare the doom for EUR…and some real sharp angles as well.
Intraday – watch for 1.08350 support zone , and go with your Sell signals accordingly .
Tonight FOMC – Economic Calendar – stay clear of it !
 March 20, 2024 at 10:35 am #3327
In reply to: Forex Forum
EURJPY DAILY CHART
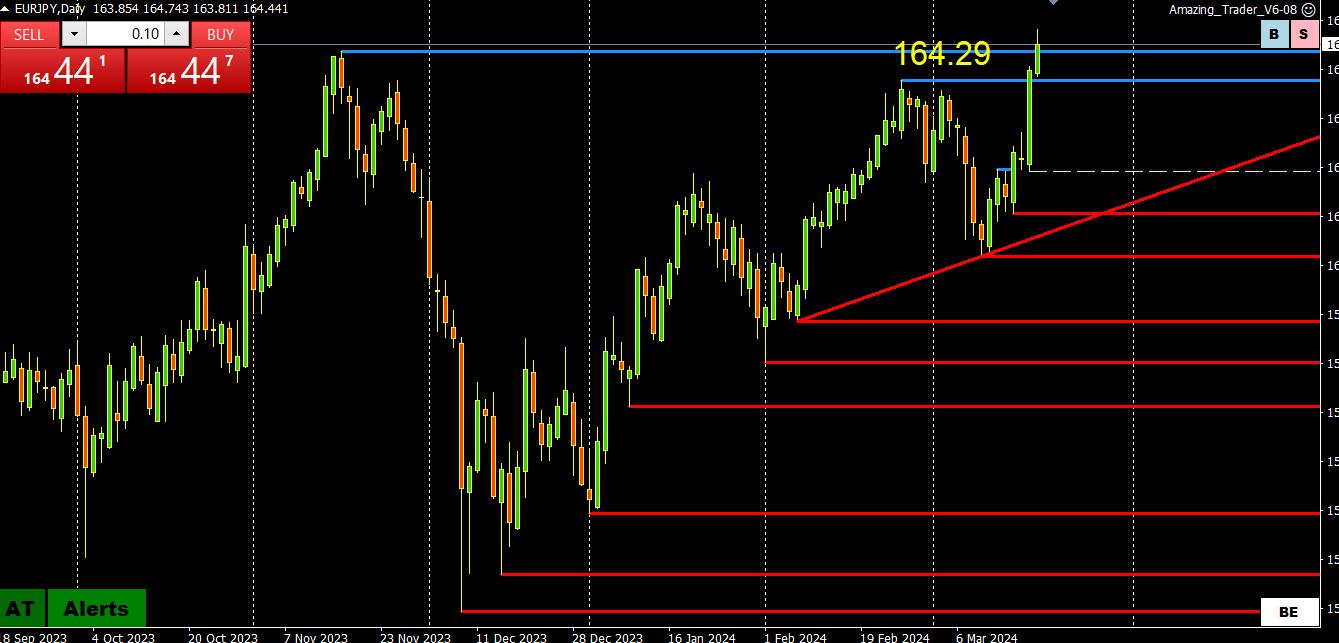
EURJPY is currently an outperformer, following the “path of least resistance:, trading above its major resistance at 164.29. This leaves the next target as guesswork (165 is one of those magic levels). Back below 164.29, at a minimum, would be needed to slow the move up.
Much might depend on whether USDJPY can trade similarly by taking out its major resistance at 151.92.
So far, offsets out of this cross are helping to keep EURUSD above its supports (see prior posts).
March 20, 2024 at 10:24 am #3326In reply to: Forex Forum
March 20, 2024 at 10:22 am #3325In reply to: Forex Forum
EURUSD 1 HOUR CHART

It took 17 1-hour candles to go from 1.0853 to 1.0873 and just 2 to break back below it. This tells you the current risk in a market that has had bouts of what we like to say “trading bid in an offered market” with buying driven more by its crosses (e.g. eurjpy) than outright vs the USD.
I don’t like to draw conclusions from a pair trading in a 43 pip range (1.0834-77) other than to say 1.0887 and 1.0906 would need to be broken to change the picture.
4 hour chart to follow .
March 18, 2024 at 9:29 pm #3230In reply to: Forex Forum
March 18, 2024 at 5:48 pm #3215In reply to: Forex Forum
March 18, 2024 at 5:42 pm #3213In reply to: Forex Forum
March 18, 2024 at 2:07 pm #3164In reply to: Forex Forum
March 18, 2024 at 1:18 pm #3155In reply to: Forex Forum
EURUSD 4 H
Without getting into Res & Sups now, problem with this picture is that the Trend line bellow was violated, but they NEVER closed bellow it. I don’t want to be a devil’s advocate here, just pay attention to it. Might mean nothing, but at the end looking at past performance one would always say : of yes, they have never closed below the trend line…it was obvious…
So, as long as the Support stays intact, be very very careful.
 March 18, 2024 at 12:27 pm #3154
In reply to: Forex Forum
 EURUSD 30 Minute Chart – YAWN
EURUSD is so far winning the tug-of-war, trading just above 1.09 in what is still a market on hold ahead of key events. Note the red AT lines showing the risk has been on the upside, now dependent on 1.0896 holding to keep a bid, stronger if 1.09 can become support.
As the chart shows, with little above the market until 1.0946, there is little to go for in terms of stops, leaving the focus on 1.09 to set the tone
March 18, 2024 at 11:02 am #3152In reply to: Forex Forum
USDJPY 4 HOUR CHART
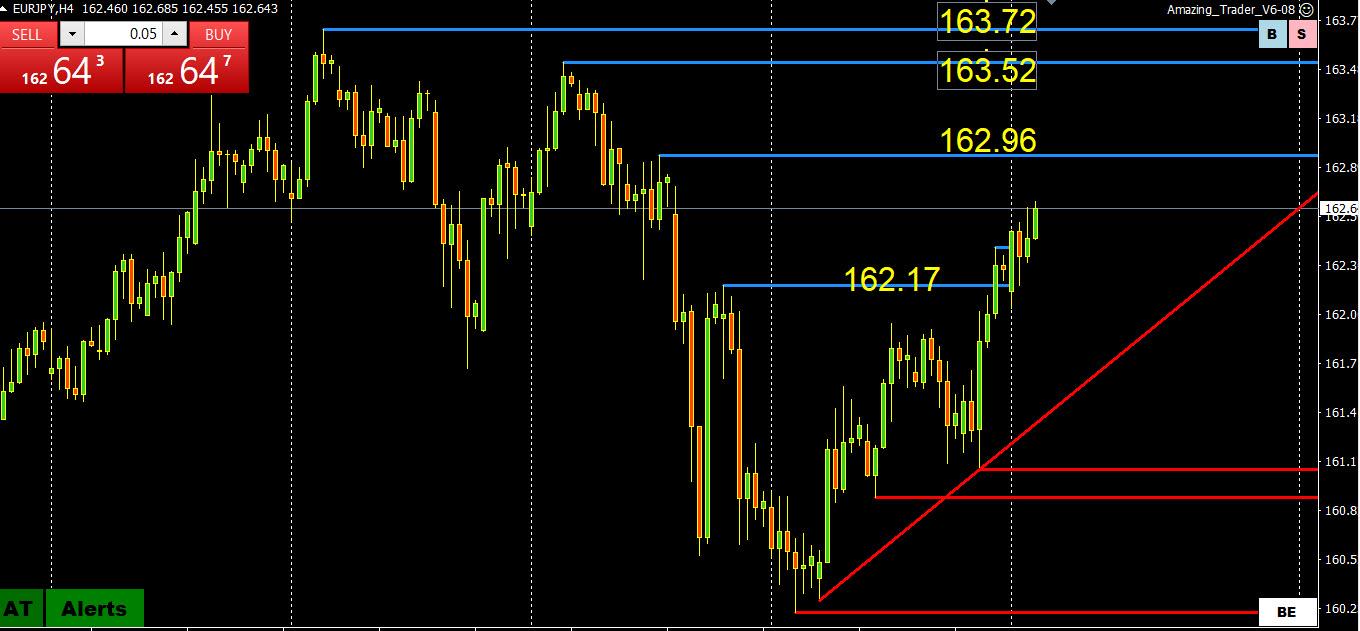
The key flow giving EURUSD support is a firmer EURJPY ahead of the BoJ decision early Tuesday.
If you want to sell JPY and not force the BoJ to intervene, one way is to follow the path of least resistance, which is on its crosses.
The chart shows 3 levels of resistance above the market and on the downside, needing to hold the 162.17 level to keep a bid.
As SF Monege pointed out. the prudent approach is to step back and let the dust settle on the BoJ decision as all that is certain is that there should be volatility following it.
March 18, 2024 at 10:54 am #3151In reply to: Forex Forum
EURGBO 1 HOUR CHART

Flows into EUR crosses seem to be behind the better EURUSD tone (testing 1.09,) in a market biding its time ahead of key monetary policy decisions this week.
This created a tug-of-war with the USD caught in the middle.
One of the crosses is a firmer EURGBP (in a tight range), so far pausing just below .8560 resistance, which stands in the way of the .8578 level, the top of the current range.
It looks like this cross finds a bid on dips as long as it stays above .8545-50.
March 16, 2024 at 8:42 am #3100In reply to: Forex Forum
March 15, 2024 at 3:40 pm #3072In reply to: Forex Forum
EURJPY 4 HOUR

I was asked why the dollar is not moving up with higher yields today.
My answer: Look at the JPY where weak crosses are giving other currencies, such as the EURUSD, some offset support.
So, take a look at EURJPY, which is testing the next resistance at 162.18.
161.70 is now the key support.
March 15, 2024 at 1:40 pm #3063In reply to: Forex Forum
EURUSD 4H
Eur just couldn’t close bellow that support trend line…
This looks very bearish, and calls for at least another attempt for previous low , or near it.
I’ll give it all the way to 1.08650, and if taken out, we are on the road to 1.07950
However, if it holds, we can witness few days of Sideways to Up. Even 1.09200
I am not going to Buy it no matter what.
Sell small time frames
 March 15, 2024 at 12:26 pm #3057
In reply to: Forex Forum
March 15, 2024 at 10:45 am #3050In reply to: Forex Forum
USDJPY 4 HOUR CHART
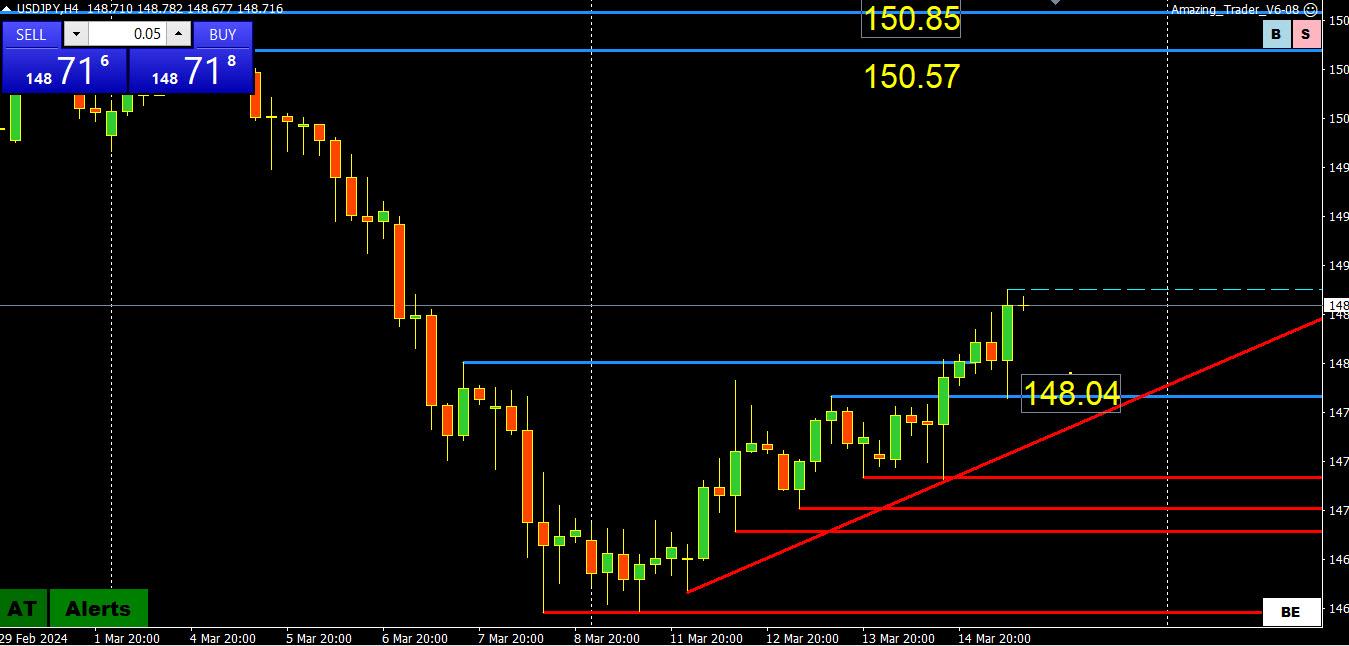
Some pre-BoJ meeting cold feet have JPY trading weaker
Offsets out of EURJPY buying are helping so far to keep EURUSD above 1.0867 (see post below)
Rising red AT lines show risk to the upside as long as it stays above 148.00-04 but…
Major resistance is not until the upper 150+ so not close to key levels.
March 15, 2024 at 1:37 am #3043In reply to: Forex Forum
March 14, 2024 at 8:18 pm #3031In reply to: Forex Forum
March 14, 2024 at 2:30 pm #3012In reply to: Forex Forum
 EURUSD 4 HOUR – 1.10 FAILURE?
The failure to reach 1.10 has put EURUSD on the defwnive with an offered bias today as long as it stays below 1.0945.
Key level is at 1.0900 with 1.0867 as the next target below it.
This has been a week of chop and false starts but it looks like the upside has lost its steam.
-
AuthorSearch Results


Search
© 2024 Global View