
-
AuthorSearch Results
-
February 16, 2024 at 12:37 pm #1665
In reply to: Forex Forum
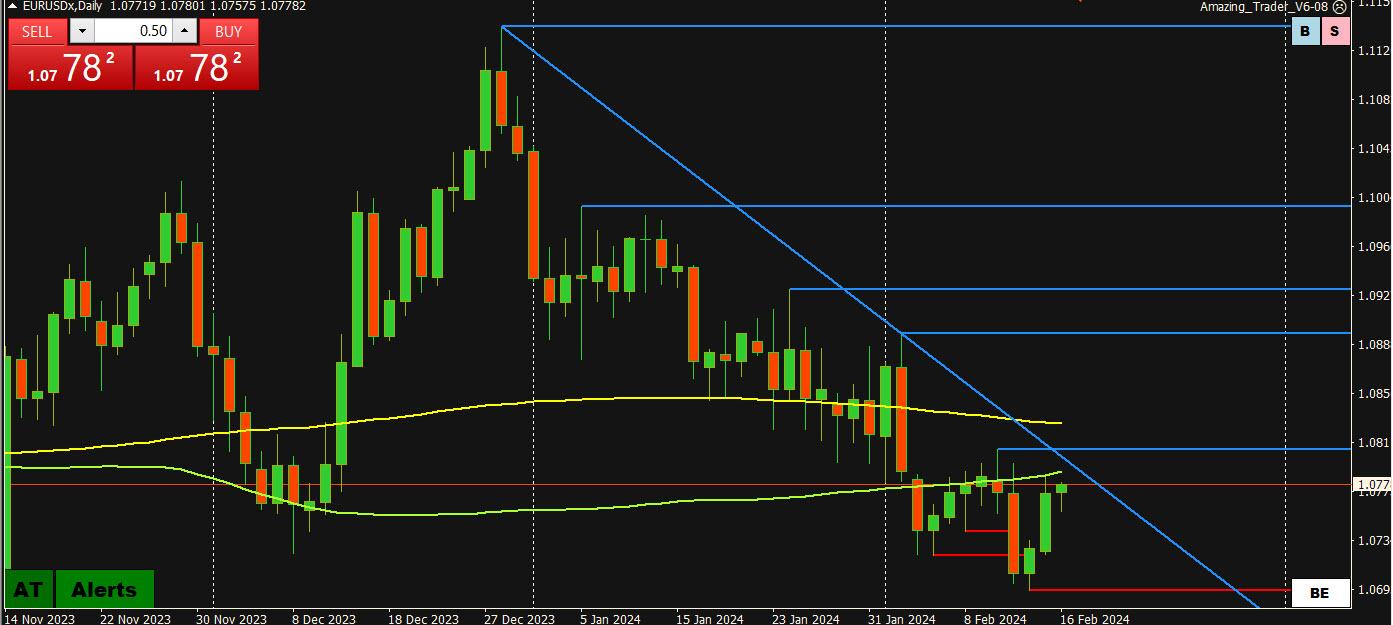
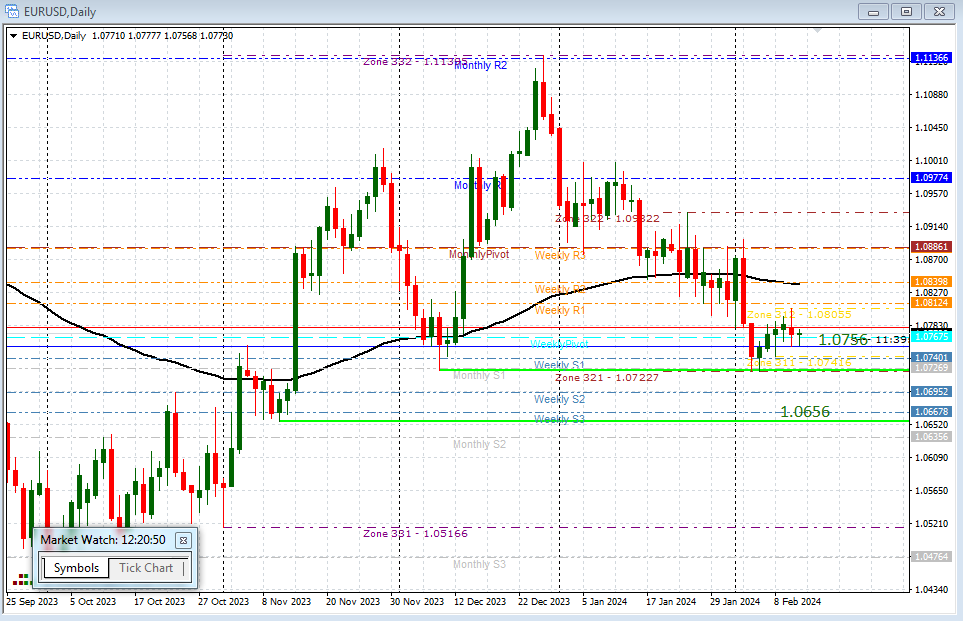
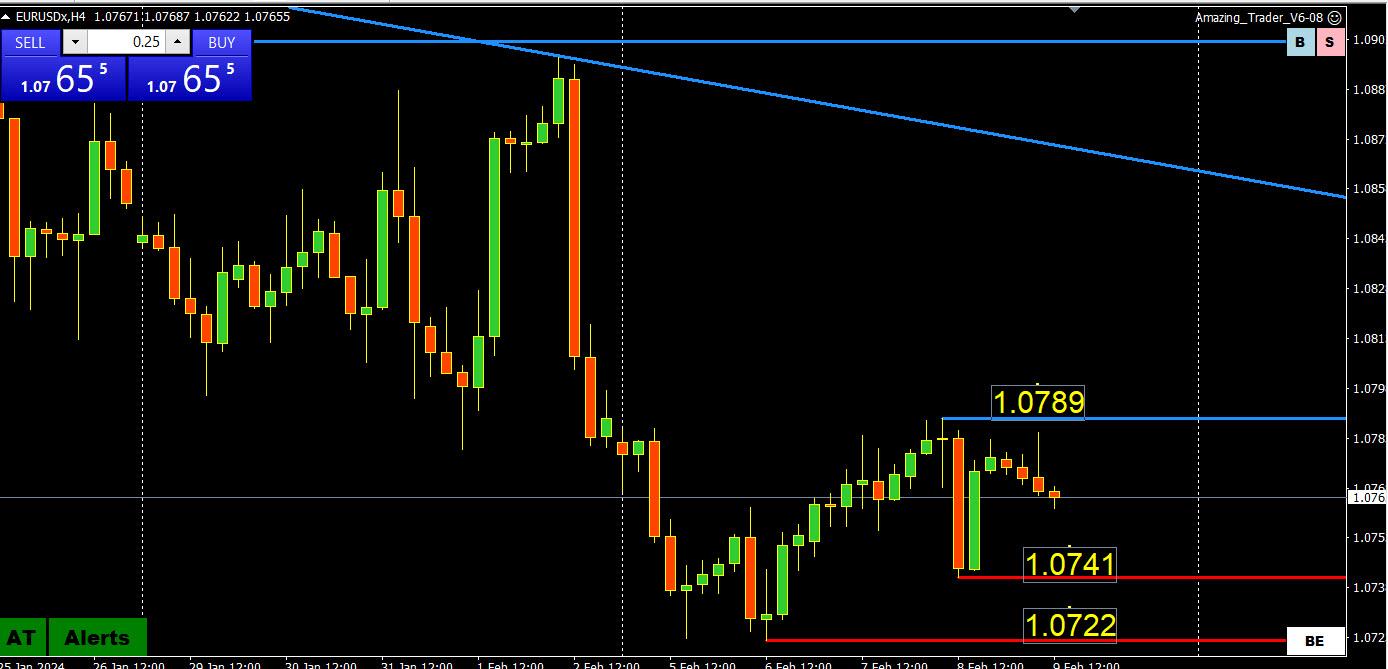
EURUSD – looking at the chart bellow, and in my own station, I have to admit that time wise – Rule of Thumb – there is a chance for the pair to break Up and change two months old trend ( Daily chart)
I am pretty sure that the solution will present itself after today’s data.
But what I also see is the fact that on the Monthly chart, the pattern suggests that we are in the early stages of a New Downtrend creation, that if comes through will open the road for as low as 0.75 area…Lots , I know…
Of course this is not helping in our daily trades, but just wanted to shine some light on the issue.
What I know for sure ( from the experience ) is that we can break above that downtrend line, even spend some time above 1.08 , but if that happens , 1.09450 will come up as a next level for unloading the EUR….and then we’ll all see clear downtrend forming .
February 16, 2024 at 11:59 am #1664In reply to: Forex Forum
February 15, 2024 at 4:00 pm #1645In reply to: Forex Forum
February 15, 2024 at 2:47 pm #1640In reply to: Forex Forum
February 15, 2024 at 2:32 pm #1637In reply to: Forex Forum
February 15, 2024 at 10:48 am #1623In reply to: Forex Forum
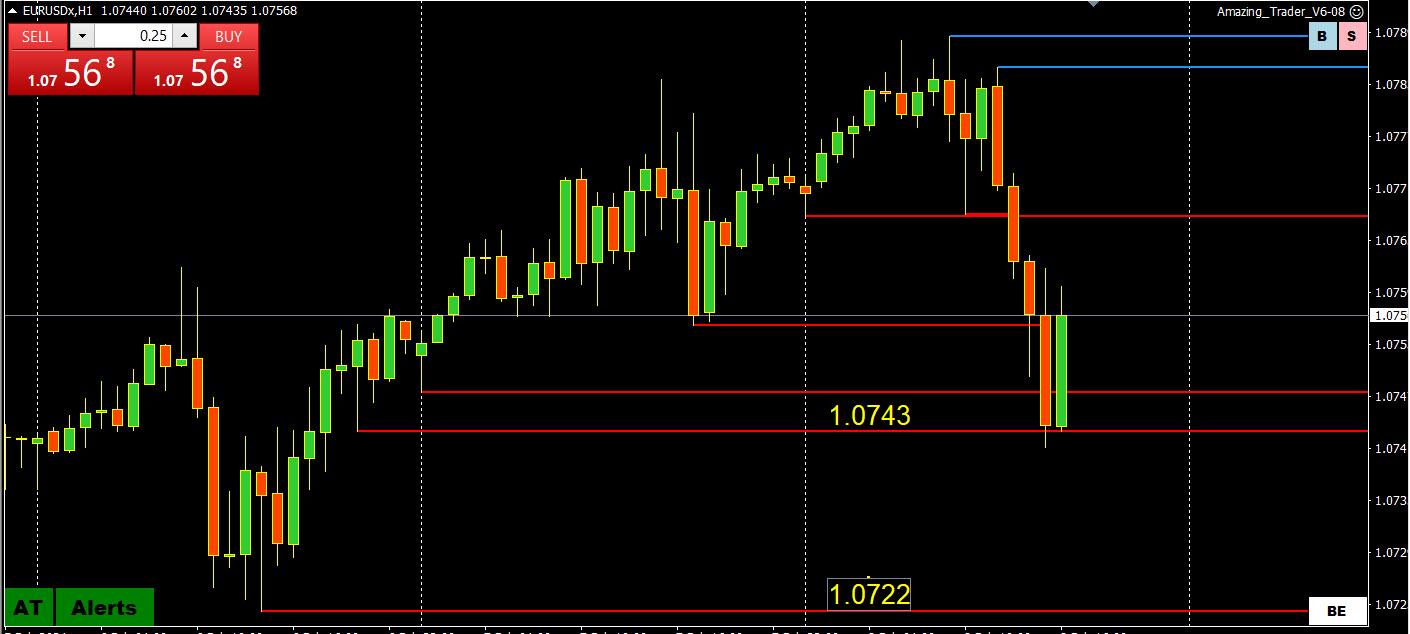
EURUSD
After reaching the new low yesterday, another sideways to Up formation is in the creation.
Immediate support is at 1.07250/300
It is trying to reach 1.07650 , and it should, prior to the next leg down.
Albeit, we can see some brief tests of 1.07000 area, but we need that Uptick to be done , for the downtrend to continue in full force.
 February 15, 2024 at 2:07 am #1619
In reply to: Forex Forum
EURUSD Analysis: Downtrend Continues, Resistance and Downside Targets
The EURUSD pair remains below a falling trend line on the 4-hour chart, indicating the continuation of the downtrend from 1.1139.
 As long as the price remains below the falling trend line, it is likely that the downside move will persist. The next target area for the pair would be around 1.0670, followed by 1.0600.
The initial resistance level is located at 1.0750. A breakthrough above this level would suggest a consolidation phase for the downtrend is underway. In such a scenario, the price could retest the 1.0805 resistance level. If this level is surpassed, it may trigger further upside movement towards the falling trend line.
It is important to note that only a break above the trend line resistance would indicate the completion of the downtrend.
In summary, the EURUSD pair remains in a downtrend, with the price staying below a falling trend line on the 4-hour chart. Downside targets have been identified, while resistance levels have also been highlighted for potential retracements. The completion of the downtrend would require a significant break above the trend line resistance.
February 14, 2024 at 4:58 pm #1613In reply to: Forex Forum
EURGBP firmer => weaker GBPUSD => firmer EURUSD
The GBP’s reaction in GBP (weaker) to a miss in UK CPI underscores an ultra-sensitivity to any data that shifts expectations of rate cuts.
Look at this EURGBP chart where demand for the cross is one reason why EURUSD has taken on a bid.
EURGBO 15-minute chart’
EURGBP => weaker GBPUSD => former EURUSD
The GBP’s reaction in GBP (weaker) to a miss in UK CPI underscores an ultra-sensitivity to any data that shifts expectations of rate cuts.
Look at this EURGBP chart where demand for the cross is one reason why EURUSD has taken on a bid.
I call this “Using crosses to help trade spot fx“”
EURGBO 15-minute chart’
 February 14, 2024 at 3:39 pm #1607
In reply to: Forex Forum
February 14, 2024 at 12:43 pm #1591In reply to: Forex Forum
February 14, 2024 at 10:55 am #1584In reply to: Forex Forum
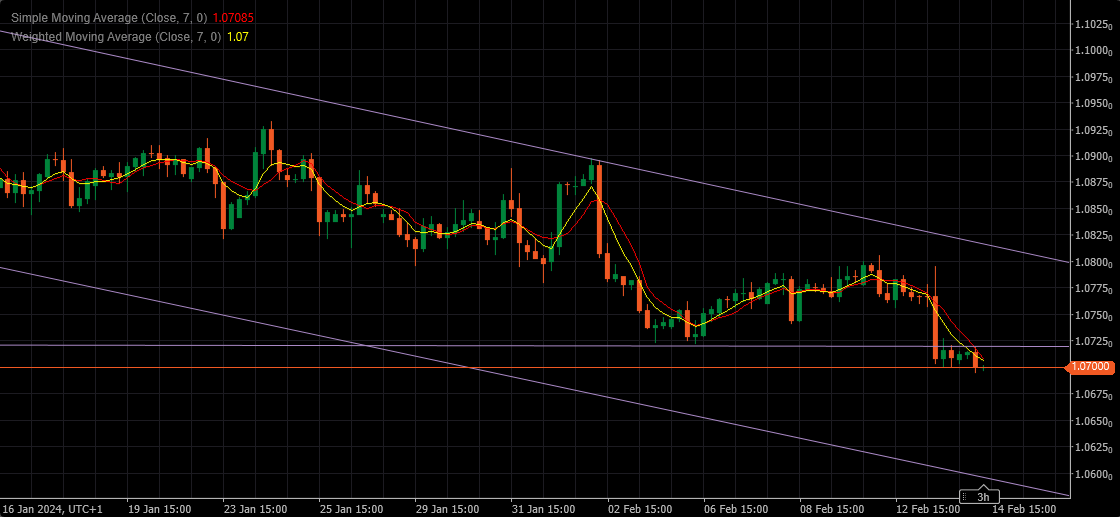
EURUSD
The pair behaved on the dot in last 24h.
Now what we have next…for the move to continue Down, it has to stay bellow 1.07100 !
1.07200 is of course the Major resistance , but for the slide to continue in coming hours we need that 1.07100 to hold.
As you can see from the chart, the target is in 1.05900 area – Do Not be overly greedy.
We have today some interesting data – Economic Calendar – stay away just prior to it !
Happy hunting.
 February 14, 2024 at 2:51 am #1576
In reply to: Forex Forum
EURUSD Analysis: Break Below Support and Potential Further Decline
The EURUSD pair has broken below the 1.0723 support level and extended its downward movement from 1.1139, reaching as low as 1.0700.
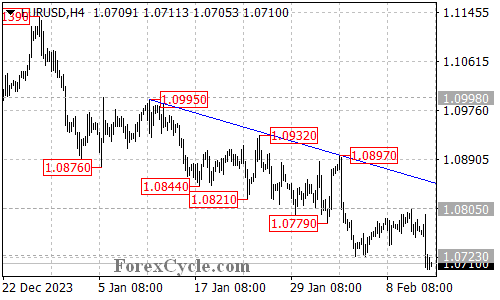
Based on this development, it is likely that further decline could be expected in the coming days, with the next target area around 1.0670, followed by 1.0600.
The initial resistance level is located at 1.0750. A breakthrough above this level could lead to a retest of the 1.0805 resistance level. If this resistance is surpassed, it may trigger additional upside movement towards the falling trend line on the 4-hour chart.
In summary, the EURUSD pair has broken below key support levels, indicating a potential continuation of the downward trend. The next targets for decline have been identified, while resistance levels have also been highlighted for potential retracements.
February 14, 2024 at 1:10 am #1574In reply to: Forex Forum
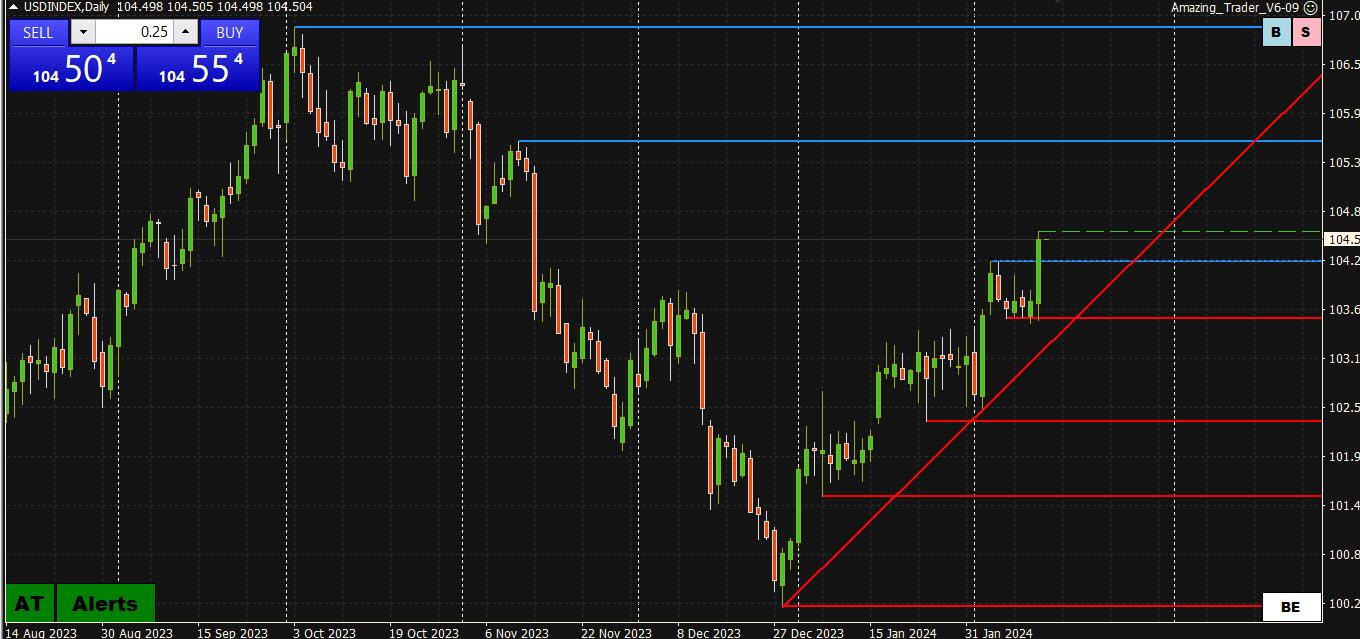
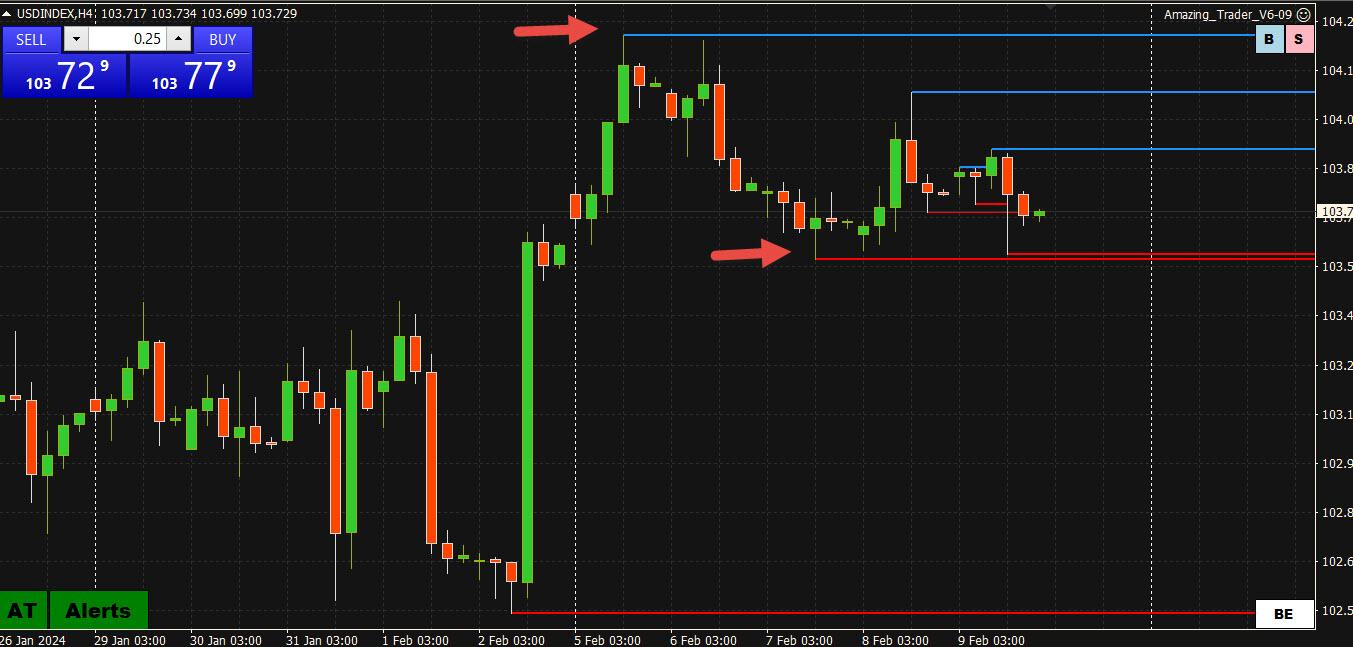
USDX (US Dollar Index
If you don’t trade it, why do traders track the USDX?
With the EURO representing 57.6% of the index, it can be used as a quasi EURUSD as the correlation between EzURUSD and USDX is very high.
USDX Daily Chart
New high for the year.
Trend = strong up (note rising red lines)
Targets at blue lines as long as the most recent ted Lind holds ax support
(contact me to learn more)
 1.0694February 13, 2024 at 8:28 pm #1568
In reply to: Forex Forum
February 13, 2024 at 7:19 pm #1564In reply to: Forex Forum
February 13, 2024 at 1:51 pm #1544In reply to: Forex Forum
February 13, 2024 at 1:49 pm #1542In reply to: Forex Forum
February 13, 2024 at 1:22 pm #1539In reply to: Forex Forum
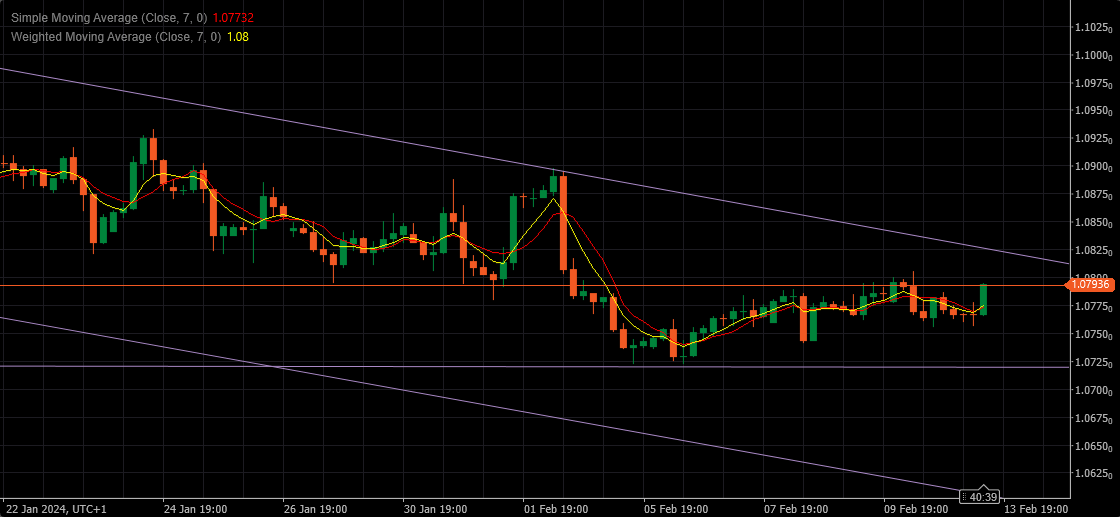
EURUSD
Resistances : 1.08050 1.08250
Supports : 1.07750 1.07200
I’ve been writing these numbers ( or very similar) almost 8 days. One can get lost in intraday swings and small moves, but when you move to a bit bigger time frame, things become clearer.
Two decades ago, I would declare fully confident that this is a Tail for Sale – but one also becomes if not smarter, but a bit wiser and way more experienced, so I am going to avoid calling big shots and stay with the reasonable.
Pattern wise, it is The Tail for Sale, so we should see a bit sharper move up, followed by even sharper decline. If happens , the main test will be the support at 1.07200…The pattern suggests that it will be broken and we’ll slide to 1.06000 area.
For a move up, serious change of the prevailing trend , we should see a sharp drop, and then we can talk about the big Bounce and change to the Up trend.
But more funny stuff have occurred on the market, and especially on this pair.
So we are going to follow it on Intraday level and when any real change happens, you’ll be the first to know.
 February 13, 2024 at 10:43 am #1533
In reply to: Forex Forum
February 13, 2024 at 10:30 am #1531In reply to: Forex Forum
February 12, 2024 at 10:19 pm #1525In reply to: Forex Forum
EURUSD Day ahead
Resistances at : 1.07800, 1.08050 and 1.08300
Supports at : 1.07550, 1.07400 and 1.07200
The difference between Tuesday and today is in possibility to see overnight slide towards supports.
Yet again we can witness euro buying , but generally we should visit 1.07200 – most important line right now – if bellow opens a road for 1.06000 area.
I prefer continued selling as long as downtrend line holds it’s ground.
 February 12, 2024 at 3:29 pm #1499
In reply to: Forex Forum
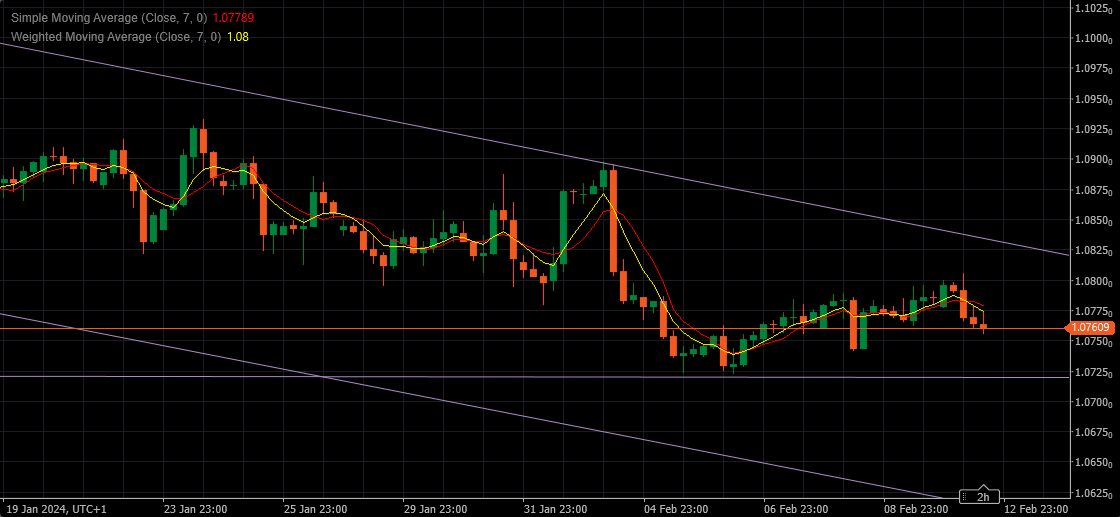
Re: my post from the last night :
EURUSD Day ahead
Resistances : 1.07950 and 1.08350/400
Supports : 1.07800 , 1.07700 and 1.07200
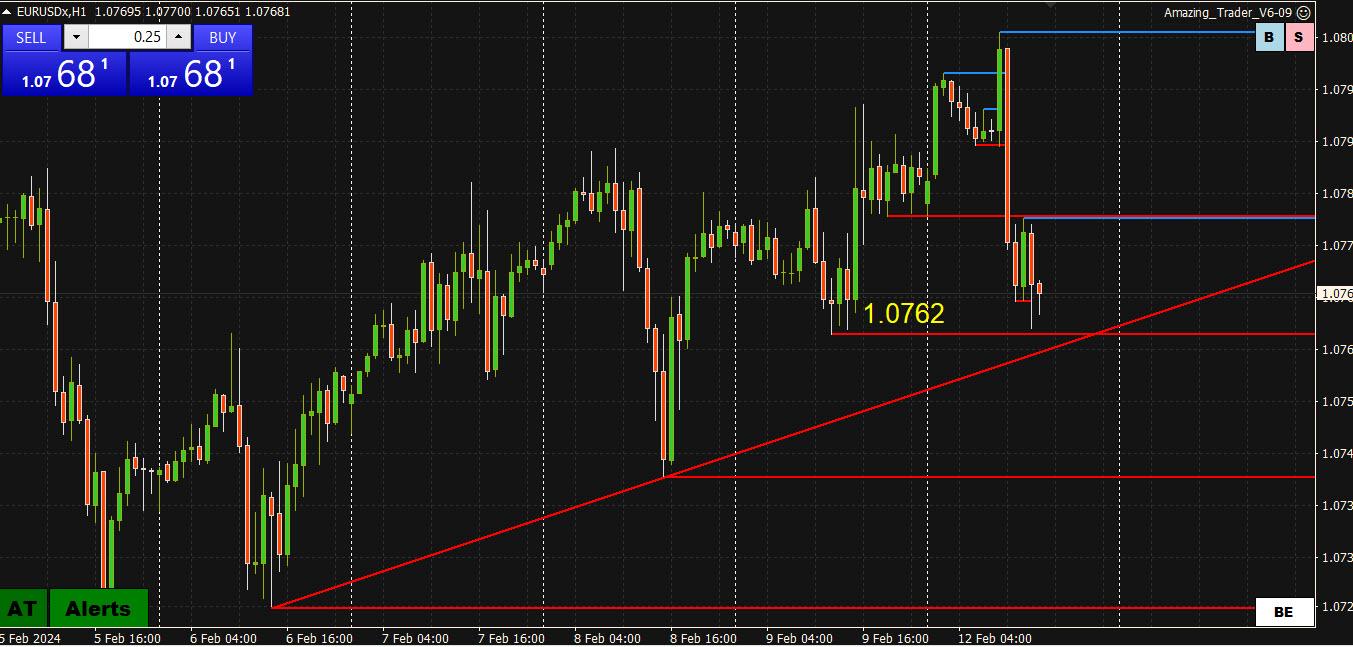
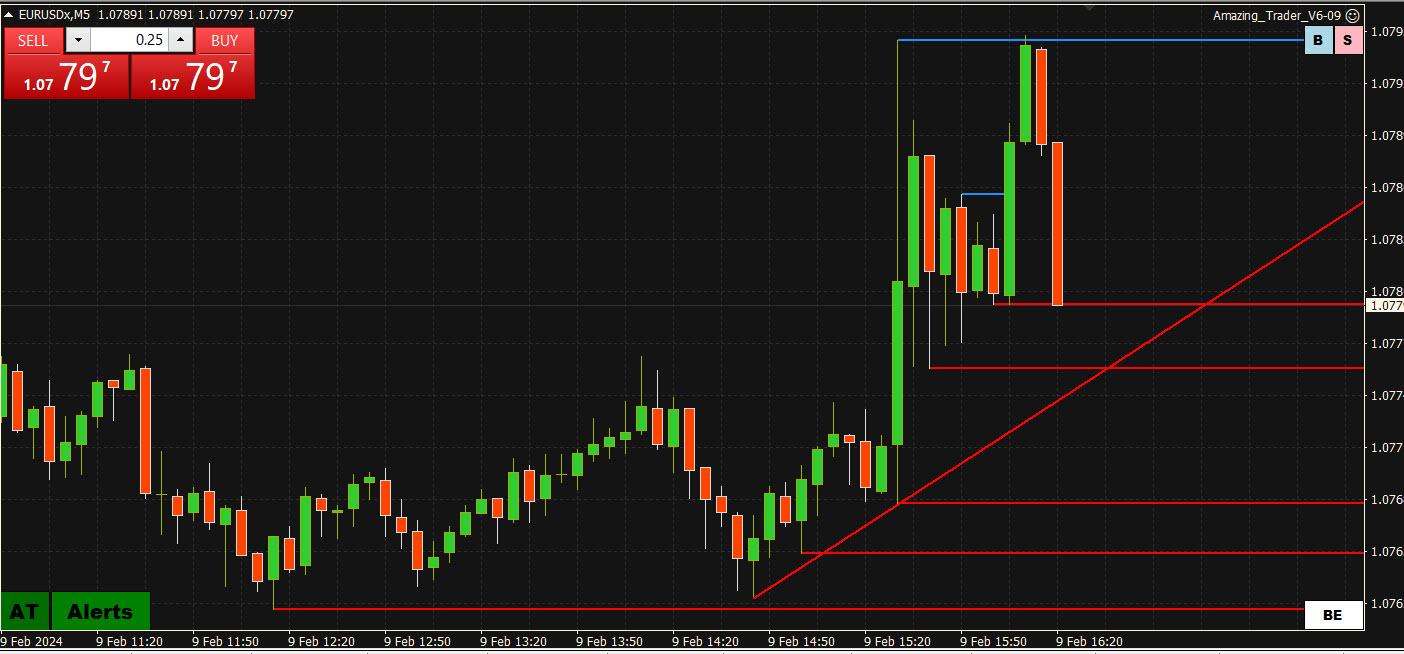
Judging by the current pattern, we should see the attack at the supports tomorrow, but expect as always for Europe to do some buying early euro morning…if they break through 1.07950 we should see at least 1.08200 ( depending on how they spent their weekends…)
Same goes for other two postings – JPY and GBP….Bellow is a current chart for EURUSD
 February 12, 2024 at 12:21 pm #1475
In reply to: Forex Forum
February 11, 2024 at 9:11 pm #1460In reply to: Forex Forum
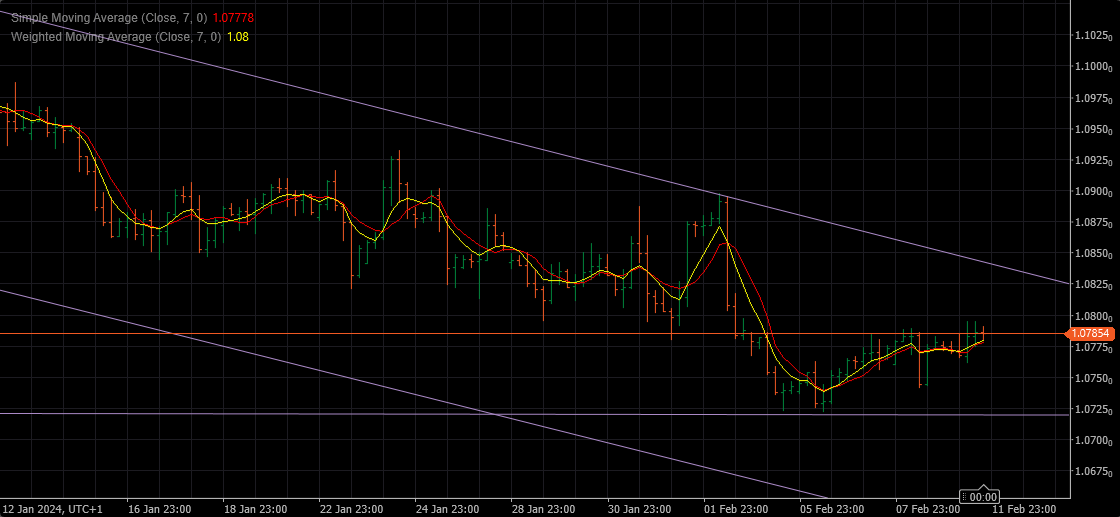
EURUSD Day ahead
Resistances : 1.07950 and 1.08350/400
Supports : 1.07800 , 1.07700 and 1.07200
Judging by the current pattern, we should see the attack at the supports tomorrow, but expect as always for Europe to do some buying early euro morning…if they break through 1.07950 we should see at least 1.08200 ( depending on how they spent their weekends…)
Always check the Economic Calendar, to be sure you are not engaging when you shouldn’t.
 February 10, 2024 at 1:02 pm #1430
In reply to: Forex Forum
February 9, 2024 at 5:23 pm #1420In reply to: Forex Forum
February 9, 2024 at 2:25 pm #1407In reply to: Forex Forum
February 9, 2024 at 10:31 am #1389In reply to: Forex Forum
February 8, 2024 at 6:06 pm #1379In reply to: Forex Forum
EURUSD Daily view
Resistances are at 1.07900 and 1.08450/500 – break of would open the road for Up Trend and the test of Major 1.11000 area. That would be a game changer.
Supports are waiting at 1.07550 and 1.07150 , break of targets directly ( ideally ) 1.06100 over period of 2-3 days.
Outcome for tomorrow – if we get a close bellow 1.07700 tonight, there is a higher possibility for immediate continuation of the down move. There is always a possibility to see uptick up to 1.08200 , and then down.
 February 8, 2024 at 2:38 pm #1359
In reply to: Forex Forum
-
AuthorSearch Results


 %
%
Search
© 2024 Global View