
- This topic has 28,344 replies, 54 voices, and was last updated 3 hours, 46 minutes ago by GVI Forex 2.
-
AuthorPosts
-
February 16, 2024 at 10:16 pm #1699Anonymous
connected ?
–
Jamie Dimon believes U.S. debt is the ‘most predictable crisis’ in history—and experts say it could cost Americans their homes, spending power, and national security – Fortune 11/02/202412:10 PM Fed’s Daly: “Navigating Geopolitical Turbulence and Domestic Uncertainty”
Don’t know who’s jamie dimon and just read the name here a few times but nevertheless… That’s why I said… keep buying paper… if US markets lose anymore of their credibility then the world is headed for even more geo-political turbulence…
February 16, 2024 at 9:57 pm #1698AnonymousFebruary 16, 2024 at 8:44 pm #1697AnonymousFebruary 16, 2024 at 8:44 pm #1696February 16, 2024 at 7:21 pm #1689February 16, 2024 at 6:54 pm #1688February 16, 2024 at 6:35 pm #1687and markets zzs
–
Three rate cuts in 2024 is a ‘reasonable baseline,’ San Francisco Fed President Mary Daly saysFed’s Daly says patience is needed to finish the job on inflation – By Greg Robb
February 16, 2024 at 5:37 pm #1686Our friends @GTWO3 are looking for EUR/JPY to turn lower from the 162.00 area as the rally from 12/27 is short covering rather than new buyers …
February 16, 2024 at 4:57 pm #1685EURJPY Daily Chart

Testing res at 161.86
Question is can EURJPY make a run at…
Key res 163.71 and 164.30
To do so, either USDJPY would need to move sharply higher, EURUSD would need to move sharply higher, a combination of the two or EURUSD would need to lag a sharp move up in USDJPY. It’s simple algebra.
Whatever the case, given broader USD trends, it would probably take JPY weakness for the key EURJPY resistance to come into play.
February 16, 2024 at 4:27 pm #1684February 16, 2024 at 4:10 pm #1683February 16, 2024 at 4:07 pm #1682February 16, 2024 at 3:59 pm #1681February 16, 2024 at 3:57 pm #1680February 16, 2024 at 3:50 pm #1679February 16, 2024 at 3:41 pm #1678February 16, 2024 at 3:31 pm #1677Our friends @GTWO3 remain of the opinion that March futures are bullish under 1.0750, as price decline from 12/28 high is longs liquidating, not new sellers
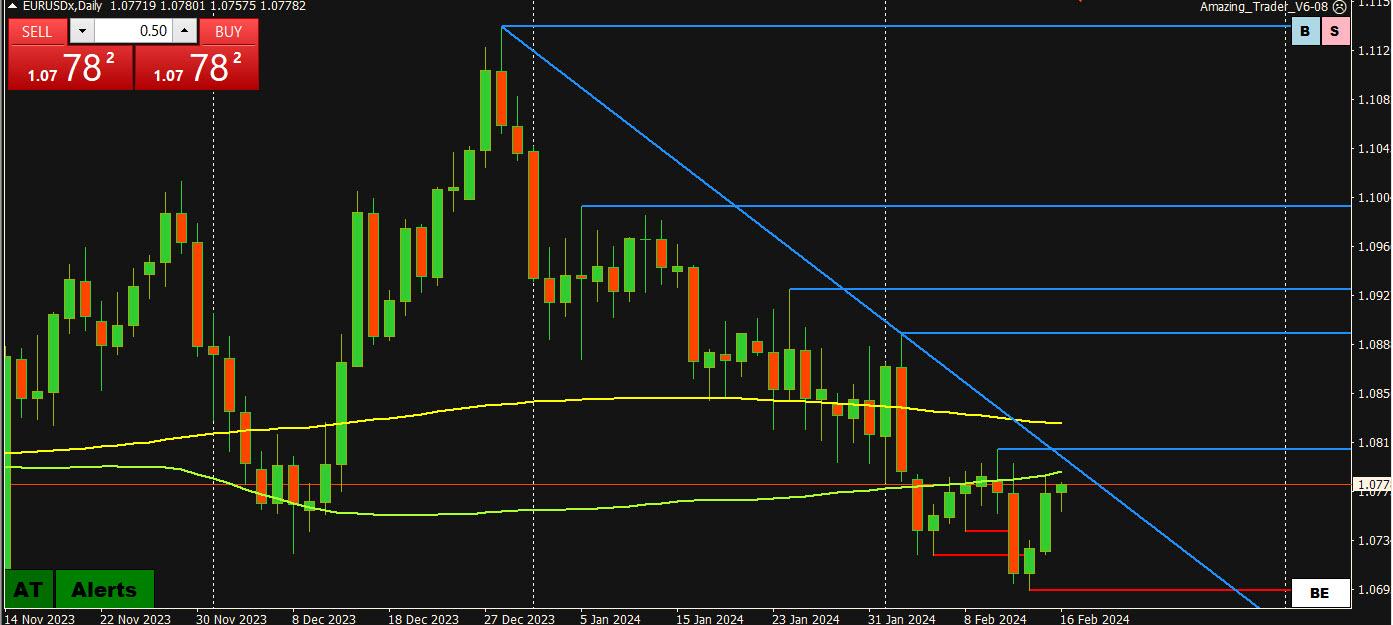
February 16, 2024 at 3:28 pm #1676February 16, 2024 at 3:25 pm #1675February 16, 2024 at 2:01 pm #1674February 16, 2024 at 1:47 pm #1673February 16, 2024 at 1:35 pm #1672February 16, 2024 at 12:52 pm #1666February 16, 2024 at 12:37 pm #1665EURUSD – looking at the chart bellow, and in my own station, I have to admit that time wise – Rule of Thumb – there is a chance for the pair to break Up and change two months old trend ( Daily chart)
I am pretty sure that the solution will present itself after today’s data.
But what I also see is the fact that on the Monthly chart, the pattern suggests that we are in the early stages of a New Downtrend creation, that if comes through will open the road for as low as 0.75 area…Lots , I know…
Of course this is not helping in our daily trades, but just wanted to shine some light on the issue.
What I know for sure ( from the experience ) is that we can break above that downtrend line, even spend some time above 1.08 , but if that happens , 1.09450 will come up as a next level for unloading the EUR….and then we’ll all see clear downtrend forming .
February 16, 2024 at 11:59 am #1664February 16, 2024 at 11:42 am #1663February 16, 2024 at 9:34 am #1661Focus on US Data next
PPI
Housing Starts
Univ of Mich Consumer Sentiment (and inflation expectations)
Fed officials speakingSee our Economic Calendar
February 16, 2024 at 7:03 am #1660
To add a few more lines to the picture usd/cad looks like range. Trapped between the upward sloping trendline as resistance and the 200 period mov avg (the yellow line) which it seems to show a good degree of respect for. The upward sloping nature of everything leaves me biased towards upside. Until it’s not (below yellow line)…
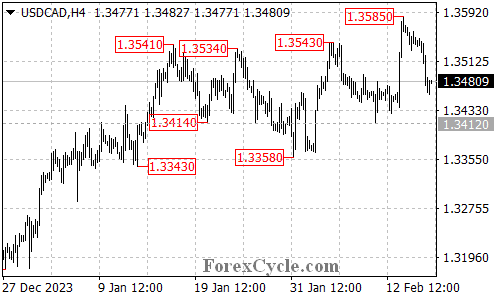
February 16, 2024 at 3:12 am #1659USDCAD Swings Lower: Range Trading or Downtrend Resumption?
USDCAD has experienced some volatility recently, breaking above resistance, pulling back, and now testing support. Let’s analyze the technicals to understand what this means for the pair’s near-term direction.
From Breakout to Range Trading?
Resistance Breached: USDCAD initially broke above the key resistance level of 1.3543, suggesting potential upside.
Pullback and Support Test: However, the pair has since pulled back and broken below the 1.3510 support level.
Range Trading Possibility: This price action suggests a potential range trading scenario between 1.3358 and 1.3585.Further Downside or Bounce in Sight?
Next Support Level: If the downtrend continues, the next potential support level to watch is 1.3412.
Breakdown Implications: A breakdown below 1.3412 could signal a resumption of the downtrend from 1.3176, with targets at the key support of 1.3358 and potentially even lower at 1.3300 and 1.3176.Hope for Upside Rebound?
Initial Resistance: If the sellers lose momentum and buyers step in, the initial hurdle to overcome is the 1.3520 resistance level.
Upside Potential: Reclaiming this level could trigger a retest of the previous resistance at 1.3585.
Overall SentimentThe technical picture is mixed for USDCAD. While the breakdown below 1.3510 suggests potential downside, the possibility of range trading within a defined range cannot be ruled out. Monitoring the price action around the mentioned support and resistance levels will be crucial to confirm the pair’s next move.
Disclaimer: This analysis is for informational purposes only and should not be considered as investment advice. Please conduct your own research before making any trading decisions.
February 15, 2024 at 10:38 pm #1658 -
AuthorPosts
 XAUUSD 4-Hour Chart
- You must be logged in to reply to this topic.
Search
© 2024 Global View