
- This topic has 28,291 replies, 54 voices, and was last updated 28 minutes ago by GVI Forex 2.
-
AuthorPosts
-
July 11, 2025 at 3:28 pm #27412
XAUUSD – Gold
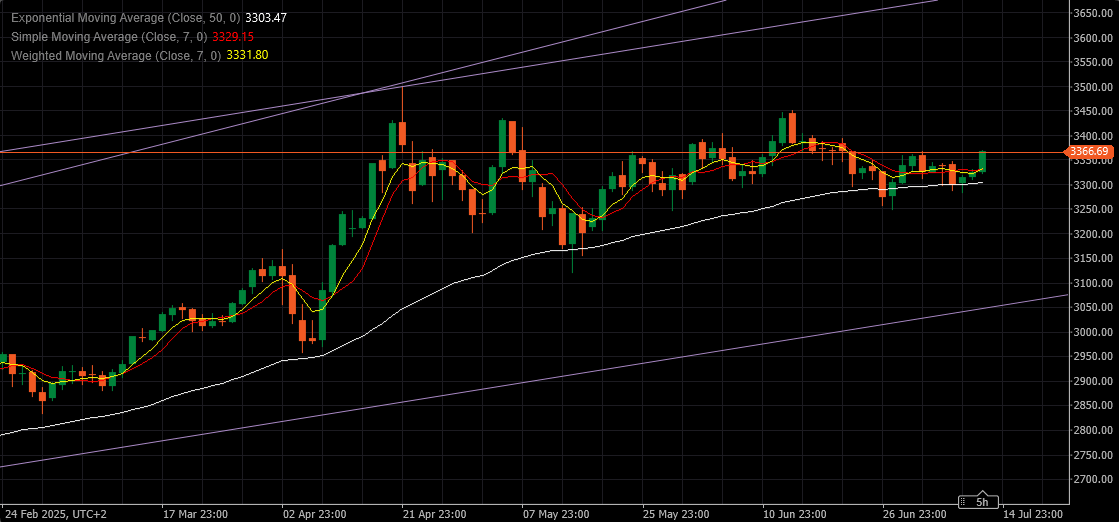
And Gold shines again – 3365.00 briefly breached, but needs to go above it and stay there.
Resistances: 3365.00, 3395.00 & 3450.00
Supports: 3350.00, 3330.00 & 3305.00
If Gold manages today to overcome decisively that zone at 3365.00 , this should be a start of renewed Bullish trend, with the target at 3695.00 area
Too bad it is Friday, so all action will soon be cut short…
 July 11, 2025 at 3:22 pm #27410July 11, 2025 at 3:11 pm #27409
The Week in Oil: U.S. Tariffs, OPEC+ Output in the Spotlight
Here’s a look at what happened in oil markets in the week of July 7-11 and what the focus will be on in the days to come.
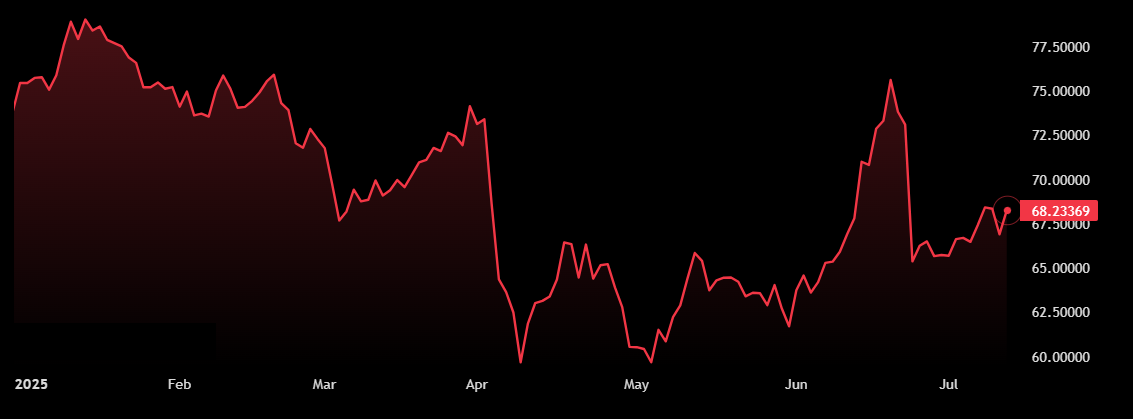
OVERVIEW: Oil prices traded sideways this week, with Brent crude hovering near $70 a barrel as investors weighed the impact of U.S. tariffs, geopolitical developments and OPEC+’s supply increases. Uncertainty surrounding President Trump’s tariff plans and lingering concerns about a looming oversupply continue to weigh on sentiment. However, short-term indicators suggest the market remains tight, lending support to prices. Brent crude is on pace to post a 2% gain for the week, while the U.S. oil gauge West Texas Intermediate is up 1% on week.
MACRO: Trade tensions escalated this week after Trump announced a new wave of tariffs, including levies on Canada and Brazil and a 50% duty on copper imports to the U.S. starting Aug. 1. The U.S. President also plans to impose blanket tariffs of 15% or 20% on most trade partners, despite broader concerns that such a move could drive up inflation and slow global economic growth. Meanwhile, minutes from the Federal Reserve’s June policy meeting revealed officials are split over the outlook for interest rates.
GEOPOLITICAL RISKS: Oil found support after Yemen’s Houthi rebels attacked a merchant ship in the Red Sea–a development that raised concerns over supply disruptions in the region and added to the geopolitical risk premium. Prices were also lifted by fresh U.S. sanctions targeting Iranian oil and news that the Trump administration is in talks with Congress regarding a bill that would authorize steep sanctions on Moscow–including a tariff on Russian oil and other commodities.
SUPPLY AND DEMAND: Concerns over weak demand and excess supply persist, but near-term indicators continue to point to a tight market.
The oil market largely shrugged off OPEC+’s decision to approve another supersize production increase, as strong summer demand is expected to absorb the additional supply. The group is broadly expected to increase oil production again in September and then take a pause, according to market watchers.
In its latest monthly report, the International Energy Agency said futures markets remain in steep backwardation–meaning near-term prices exceed later-dated contracts–and summer travel demand is keeping refining margins healthy.
Meanwhile, the latest data from the Energy Information Administration showed U.S. crude oil inventories rose for a second consecutive time last week, while gasoline stocks fell as demand picked up ahead of the Independence Day holiday.
WHAT’S AHEAD: On the macro front, investors will be closely watching a slate of key U.S. economic indicators next week, including June CPI figures on Tuesday, PPI data on Wednesday, and retail sales and jobless claims due Friday. Speeches from Federal Reserve officials will also be closely monitored for clues on the central bank’s policy outlook.
A wave of Chinese economic data is also set for release, with some analysts expecting stronger-than-anticipated second-quarter growth, which could bolster market sentiment. Meanwhile, OPEC is scheduled to publish its monthly oil market report on Tuesday, offering fresh insights into supply-demand dynamics and the group’s production outlook.
Brent Crude Oil
 July 11, 2025 at 3:07 pm #27408
Bitcoin Surges to Record High Above $118,000. Where the Crypto Goes Next
Bitcoin rallied to a record above $118,000 overnight, the latest high in a stellar week for the cryptocurrency.
The world’s largest token by total market capitalization was trading at $118,111 early Friday, up 6.3% over the past 24 hours, according to data from CoinDesk. It rose as high as $118,740 earlier in the session.
Bets on a September Federal Reserve interest-rate cut, inflows into spot crypto exchange-traded funds, and regulatory tailwinds have all helped to spur this week’s rally, powering Bitcoin to its first record highs since May.
It’s only a matter of time before the token tops $120,000, particularly given that U.S. lawmakers are due to consider several digital-asset proposals next week, Pepperstone strategist Dilin Wu said Friday in a research note.
The House is set to review three pieces of legislation: The CLARITY Act, which aims to establish a regulatory framework for cryptos; the Genius stablecoin bill, which sets out to regulate tokens that are pegged to the dollar and other fiat currencies; and the Anti-CBDC Surveillance State Act, which bans Federal Reserve banks from issuing central bank digital currencies to individuals.
“If legislative momentum remains strong, ETF inflows persist, and the Fed signals dovish intent, Bitcoin retesting the $120,000 mark before August would not be far-fetched,” Wu wrote.
Bitget Research analyst Ryan Lee said in a research note that he believes the crypto can hit $120,000 by the end of July.
Other tokens were also racking up gains early Friday. Ethereum jumped 7.4%, Solana rose 4.7%, and XRP gained 10% over the past 24 hours, according to data from the crypto exchange Kraken.
 July 11, 2025 at 3:03 pm #27407
Trump Tariff Talk Damps European Bourses Midday
European bourses tracked solidly lower midday Friday, after President Donald Trump late Thursday indicated a letter may be sent to European Union officials before the weekend, with new tariff schedules.
Trump also said late Thursday that he is planning a 35% import levy on Canadian products, although certain goods, covered under an existing trade agreement, would be exempted.
Tech stocks led broad market declines on continental trading floors, although oil issues held firm.
Investors also eyed Wall Street futures flashing red, and choppy closes overnight on Asian exchanges.
In economic news, wholesale prices in Germany rose by 0.9% in June on year, reported the Federal Statistics Office.
The pan-continental Stoxx Europe 600 Index was off 1% mid-session.
The Stoxx Europe 600 Technology Index was down 0.9%, and the Stoxx 600 Banks Index lost 1.9%.
The Stoxx Europe 600 Oil and Gas Index was steady, but the Stoxx 600 Europe Food and Beverage Index fell 0.7%.
The REITE, a European REIT index, fell 0.7%, while the Stoxx Europe 600 Retail Index was down 0.7%.
On the national market indexes, Germany’s DAX was down 1%, and the FTSE 100 in London lost 0.4%. The CAC 40 in Paris was off 0.9%, and Spain’s IBEX 35 eased 0.8%.
Yields on benchmark 10-year German bonds were higher, near 2.68%.
Front-month North Sea Brent crude-oil futures were up 0.8% at $69.19 a barrel.
The Euro Stoxx 50 volatility index was up 8.7% to 17.39, still indicating below-average volatility for European stock markets in the next 30 days, a positive signal. A reading above 20 indicates choppier markets ahead, while below 20 suggests calmer exchanges.
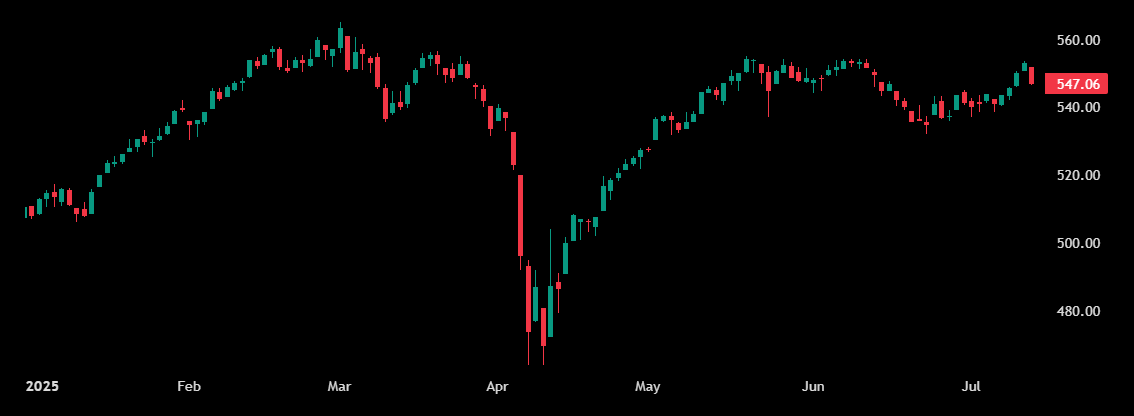
Stoxx Europe 600
 July 11, 2025 at 3:00 pm #27406
US Stocks Lower on Friday
The S&P 500 lost 0.5% and the Nasdaq dropped 0.3% on Friday, after closing at a record high the day before.
Also, the Dow Jones was down almost 300 points, as investors weighed renewed tariff threats from the Trump administration.
The US President announced a 35% tariff on Canadian imports starting August 1st and signaled plans to impose broad-based tariffs of 15% to 20% on most other trading partners, up from the current 10% rate.
The EU is expected to receive formal notice of the applicable tariff rates shortly.
Meanwhile, traders are also bracing for the start of earnings season next week, along with key economic data, including the CPI. All sectors were in the red but materials and health led the losses.
Megacaps were mixed, with Microsoft (-0.4%), Apple (-0.8%), Meta (-1.4%), Broadcom (-0.6%), Alphabet (-0.3%), and Tesla (-0.8%) in the red while Nvidia (0.6%) and Amazon (0.7%) traded higher.
For the week, the S&P 500 and Nasdaq were little changed, while the Dow slipped 0.4%.
 July 11, 2025 at 12:55 pm #27405July 11, 2025 at 12:47 pm #27404July 11, 2025 at 12:00 pm #27403July 11, 2025 at 11:29 am #27400
DAX
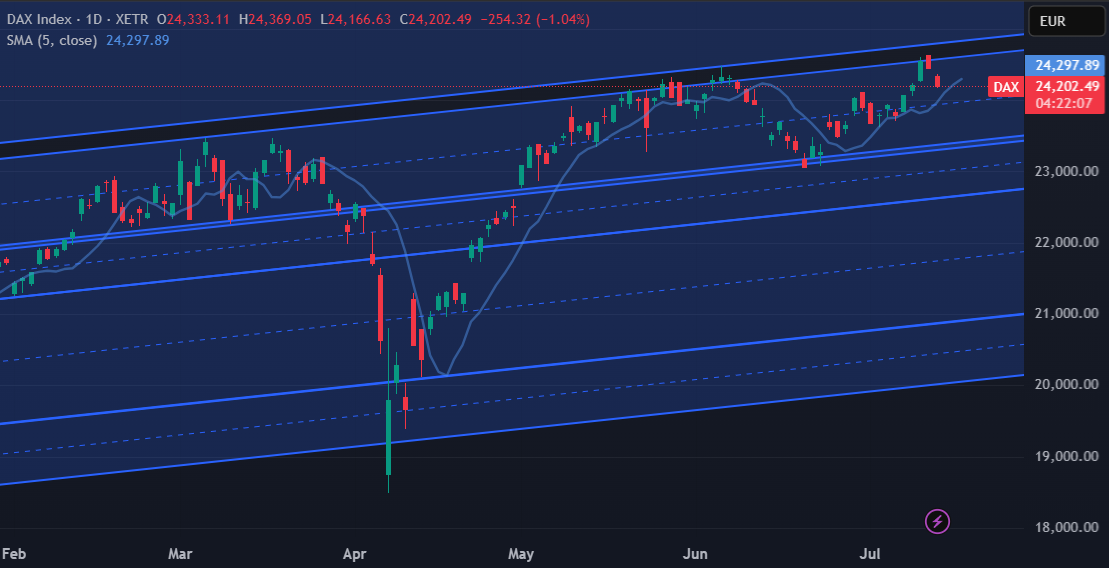
After reaching the new all time high at 24.640 , just a bit short of resistance at 24.775 Dax took a dive
Obviously that channel resistance line is the most important one right now – it separates DAX from getting into brand new universe with levels as high as 30K
Supports now come at: 24.120, 24.025 & 23.700
23.300 stays as most important underpinning level.
 July 11, 2025 at 11:20 am #27399
BTCUSD – Bitcoin
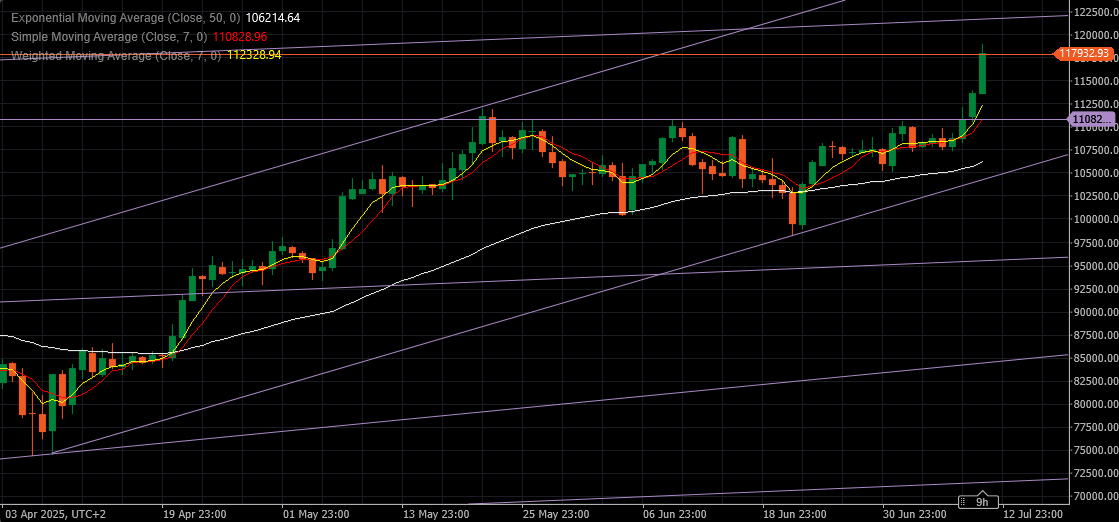
As the target at 121.550 is approaching and fast, let us discuss the possible outcomes:
– We face a heavy profit taking and BTC dives sharply – correction phase that would lead back to 110.800 and eventually even 105.000
– BTC goes through that level like through the butter and continues towards 130K without any interruptions
In my personal opinion, it is just starting a rally that should lead to around 185K, but that’s just an opinion and you shouldn’t try to trade an opinion like EVER…
For now we go step by step and position based on combination of Daily and 4h charts
That said , 4h – watch now if 116.325 will hold any attempt for lower
 July 11, 2025 at 11:06 am #27398
EURUSD 4h
Intraday pressure currently Up
Resistance: 1.16950, 1.17050 & 1.17200
Supports: 1.16850, 1.16700 & 1.16600
Major supports is at 1.16500 and represents the trendline of sharper angle trend that started exactly two months ago.
As long as that one holds, EUR will be in a position to advance more and eventually break above 1.18450
However, if below that Major support, there are bunch of other ones that will keep EUR in an Uptrend, but in that case the advancement would be delayed and we could see levels as low as 1.14
I will give a big picture over weekend in an article for our Blog – all that you need to know 😀
 July 11, 2025 at 10:53 am #27397July 11, 2025 at 10:50 am #27396July 11, 2025 at 10:47 am #27395
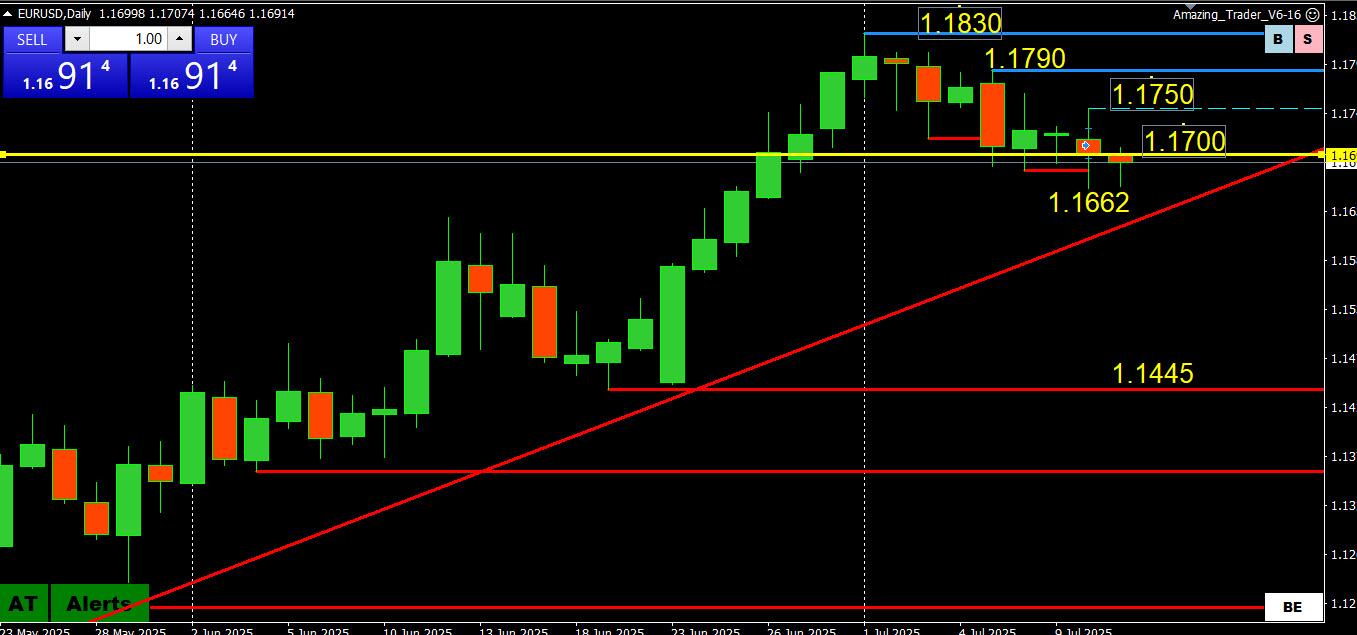
EURUSD
Momentum tilted down but still a retracement that has traded on both sides of 1.17 for 5 days in a row,
While 1.17 is not one of my magic big figure levels, the longer this pattern goes on the more likely it will send a signal for the next directional move (i.e. further retracement or a run back towards 1.18) once it is broken.
EURUSD DAILY CHART
 July 11, 2025 at 10:20 am #27394July 11, 2025 at 10:10 am #27393
NAS100 (NASDAQ)
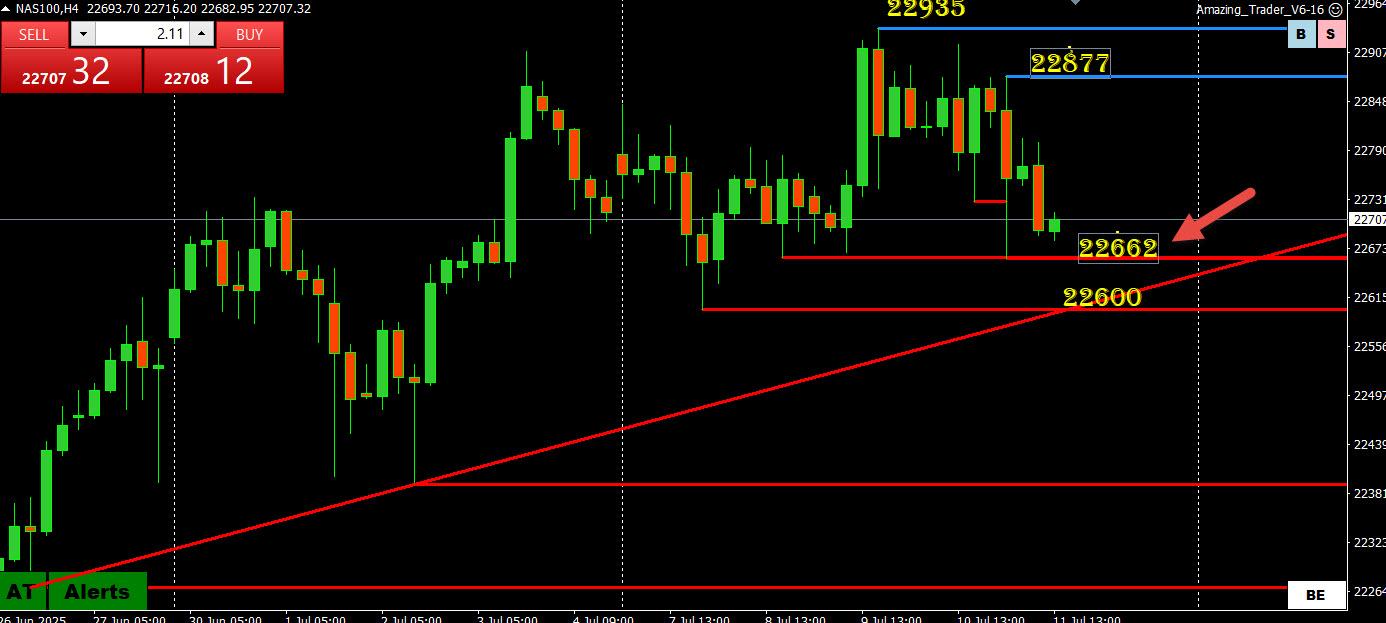
I posted this last night and so far 22662 has checked the downside. For those interested, this is an Amazing Trader chart and looking at it you can see why I say its levels matter.
I would be remiss by not pointing out a potential top/change of directional risk pattern formed by the 2 blue AT lines after not testing its record 22935 high.
This patter, HOWEVER, would only be confirmed by a break of 22600-22662.
Expect support as long as it trades above 22600-22662. Would re-assess if that support is broken.
NAS100 4 HOUR CHART
 July 11, 2025 at 9:55 am #27392
BTCUSD (BITCOIN)
Surging further into record high territory. No reason to look for a pause until the daily pattern (6 green up candles in a row) is broken.
Technical levels of little use so:
If 118K becomes support, risk next is for 120K
If 118K fails to hold, 115K becomes the focus.
Support on any deep dips long as it trades above 110-112:/
BTCUSD DAILY CHART
 July 11, 2025 at 9:54 am #27391July 11, 2025 at 9:44 am #27390
USDJPY
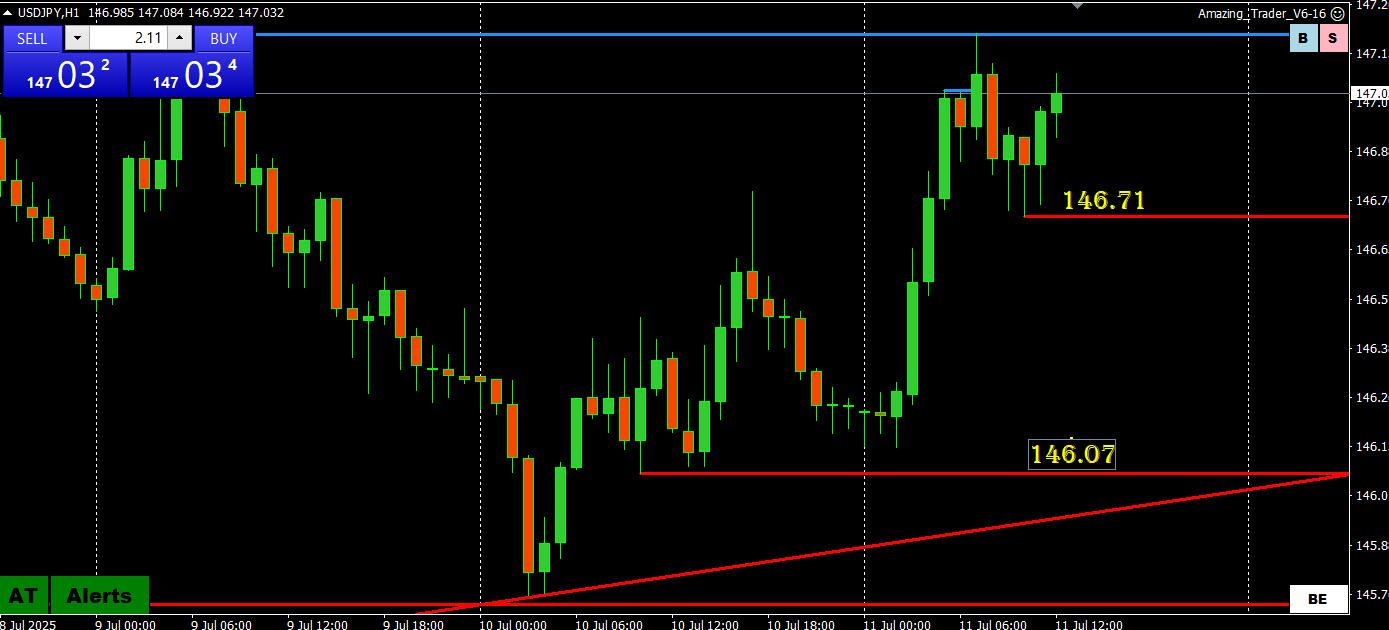
The underperformer today but so far pausing around 147.19 for a double top.
If looking for stops, they will likely be above 147.19, which looks tough as it is the obstacle to exposing 1`148.
On the downside, there is little other than 146.71, a minor support but one if broken would ease the intra-day risk to 147+.
USDJPY 4 HOUR CHART
 July 11, 2025 at 9:36 am #27389
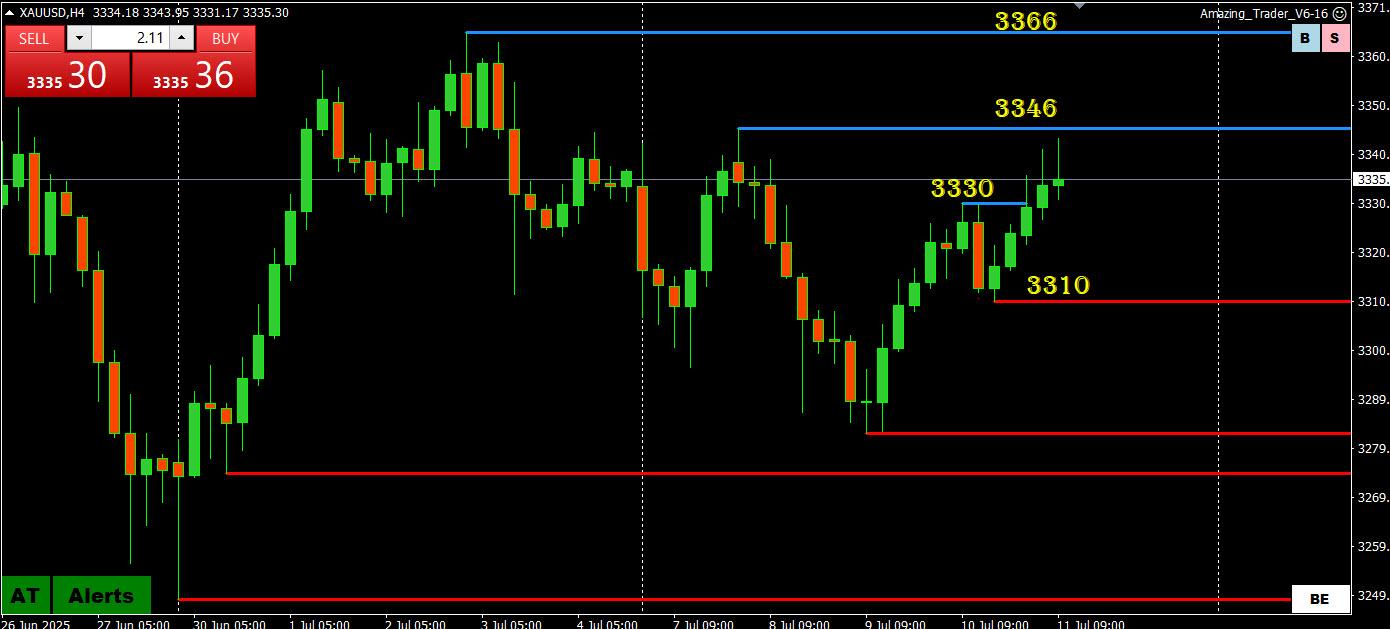
XAUUSD (GOLD)
Still struggling to break out of its range but another day above 3300 is a bullish sign.
Resistance 3346-66, above the upper end needed to build momentum to the upside.
Supports 3310-30, needs to hold above 3330 for a strong bid but supported below it as long as 3310 is untouched.
XAUUSD 4 HOUR CHART
 July 11, 2025 at 9:25 am #27388
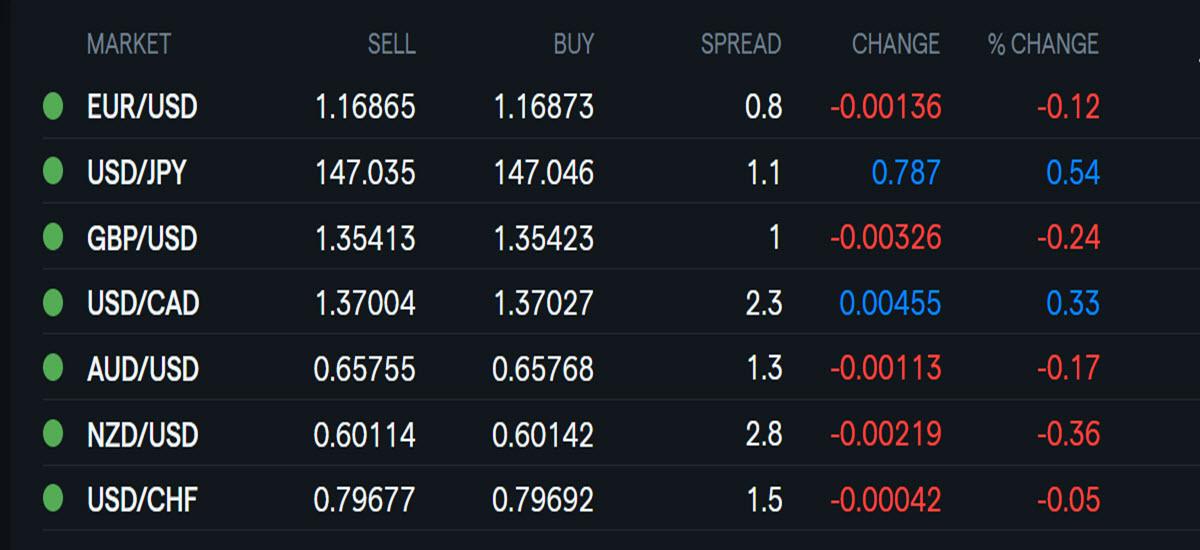
Using my platform as a HEATMAP shows…
Another move in early Asia, this one blindsided the market and triggered by more Trump tariffs news
Dollar is firmer but below early highs… in this ordere )weakest to firmkest)… JPY, CAD. GBP, AUD, EUR. CHF
Gold is up but still in its range
US stocks are lower
US bond yields higher
Bitcoing extendng its record high
No US data due, CDA jobs report
 July 11, 2025 at 8:52 am #27386July 11, 2025 at 5:47 am #27385July 11, 2025 at 4:40 am #27382July 11, 2025 at 1:40 am #27381July 11, 2025 at 12:45 am #27380July 11, 2025 at 12:43 am #27379July 10, 2025 at 11:14 pm #27378
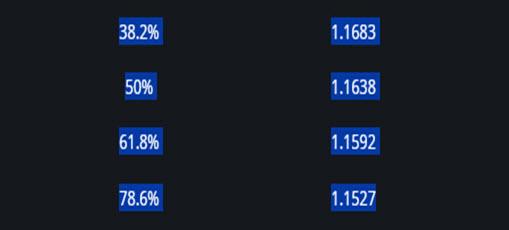
This is a Global-View classic and after seeing EURUSD run stops through 1.1680 and then eventually reverse course, it is a must read for any serious trader
Forex Trading Tip: Watch Out for Stops and Use Them to Your Advantage!
 July 10, 2025 at 10:38 pm #27377
-
AuthorPosts



- You must be logged in to reply to this topic.
Search
© 2024 Global View