
-
AuthorSearch Results
-
March 7, 2024 at 12:04 pm #2627
In reply to: Forex Forum
EURUSD
Supports at 1.08850 1.08700 and 1.08300
Resistances at 1.09100 1.09250 and 1.09350
Now it all comes to the ECB later on.
If we just put aside that little fact, what is obvious is the Ascend Angle from the February 12th – it is Corrective and not exactly Bullish.
It might prove exactly right after ECB decision …we’ll see – anyways I do not trade just prior to such a big events ( even when I know they are hollow ones – but maybe that is even more dangerous )
March 6, 2024 at 5:14 pm #2586In reply to: Forex Forum
March 6, 2024 at 4:48 pm #2583In reply to: Forex Forum
March 6, 2024 at 1:15 pm #2541In reply to: Forex Forum
March 6, 2024 at 1:06 pm #2540In reply to: Forex Forum
March 6, 2024 at 11:29 am #2537In reply to: Forex Forum
March 5, 2024 at 4:05 pm #2469In reply to: Forex Forum
March 5, 2024 at 3:48 pm #2467In reply to: Forex Forum
March 5, 2024 at 2:26 pm #2457In reply to: Forex Forum
March 5, 2024 at 1:16 pm #2448In reply to: Forex Forum
March 5, 2024 at 11:54 am #2434In reply to: Forex Forum
March 5, 2024 at 11:25 am #2433In reply to: Forex Forum
March 4, 2024 at 7:51 pm #2402In reply to: Forex Forum
March 4, 2024 at 2:08 pm #2384In reply to: Forex Forum
March 4, 2024 at 10:51 am #2370In reply to: Forex Forum
March 3, 2024 at 2:22 pm #2360In reply to: Forex Forum
EURGBP DAILY CHART
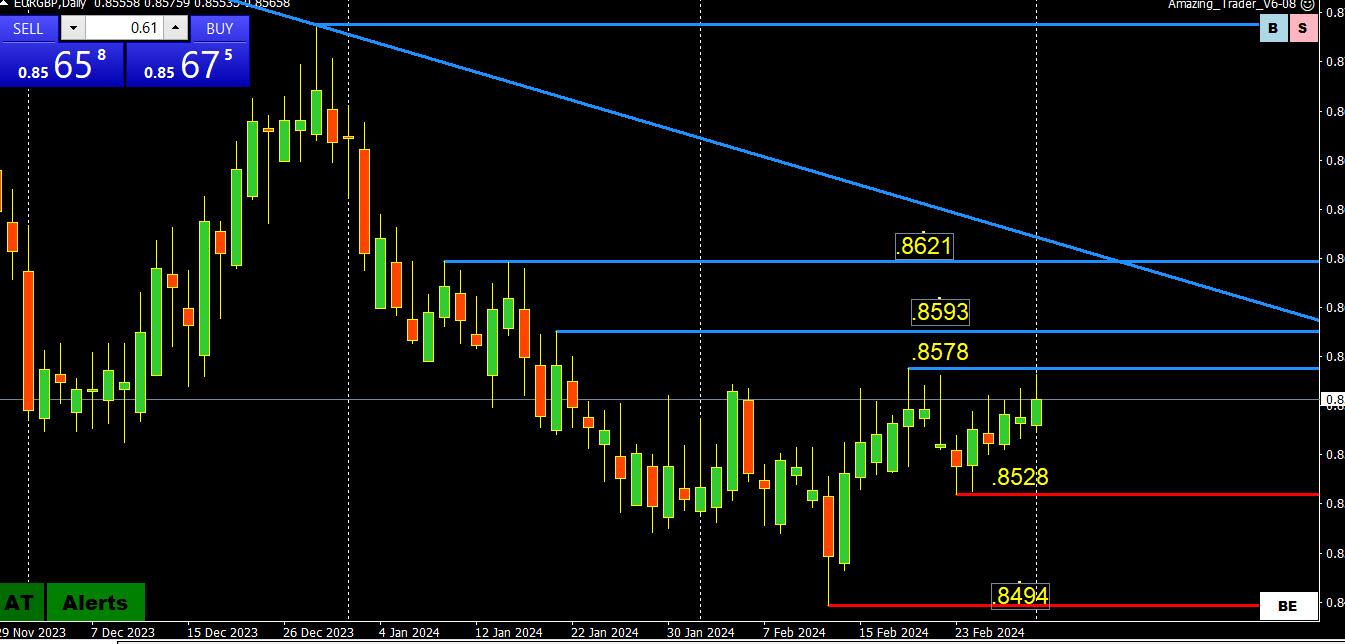
Higher red AT lines off the low show some risk on the upside but would need to get through the top of the current .8528-78 range to expose .8593-/8621
However, to confirm a break in trend, the key trendline (see chart) would need to be taken out.
Looking at shorter time frames, support at .8550-55 would need to hold to keep a bid.
The bounce in EURUGBP is one reason why EURUSD is finding some suppot.
March 2, 2024 at 11:18 pm #2353In reply to: Forex Forum
Key event week with Fed Powell Powell testifying on Wed and the ECB meeting on Thurs so let’s take a look at the EURUSD
EURUSD AT Daily Chart

2 higher red support lines show a risk to the upside that requires a break of 1.0896 to give legs to the upside.
Whatever the case, 1.08 is the current bias setter, and only back below it would put the 1.0760 support in play again.
March 2, 2024 at 12:16 pm #2348In reply to: Forex Forum
EURUSD Daily – Week Ahead
Supports at : 1.08200 1.07950 1.07250
Resistances at : 1.08500 1.08900 1.09350 and 1.10850
Friday’s close indicates a probable move to the Resistances first. The pattern calls for a test of 1.08900.
I am going to be free to say that I can see 1.09350 reached already on Monday – that is what I see….and I don’t have a crystal ball 😀
For that to happen, EURUSD should not go bellow 1.08200 .
 March 1, 2024 at 11:24 am #2297
In reply to: Forex Forum
EURUSD Analysis: Key Support and Resistance Levels to Watch
The EURUSD pair is currently testing the 1.0789 support level once again. A breakdown below this level would suggest that the upside move from 1.0694 has concluded at 1.0887. In such a scenario, the next target levels would be at 1.0750, followed by 1.0694.
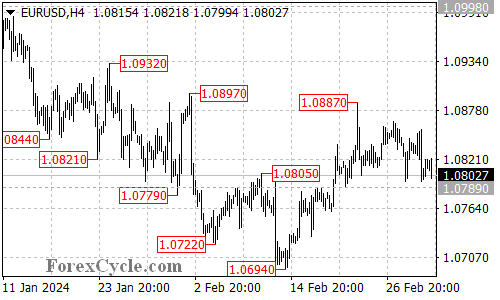
However, if the 1.0789 support level holds, the pullback from 1.0887 could potentially be a consolidation phase for the uptrend from 1.0694. In this case, another rise towards the 1.0950 level is still possible after the consolidation.
The initial resistance level is at 1.0840. A breakthrough of this level could potentially take the price to the next resistance level at 1.0887. Above this level, the price could aim for 1.0950.
March 1, 2024 at 10:39 am #2292In reply to: Forex Forum
February 29, 2024 at 5:23 pm #2272In reply to: Forex Forum
AnonymousFebruary 29, 2024 at 4:23 pm #2268In reply to: Forex Forum
February 29, 2024 at 8:55 am #2226In reply to: Forex Forum
February 29, 2024 at 7:38 am #2224In reply to: Forex Forum
February 29, 2024 at 3:26 am #2220In reply to: Forex Forum
EURUSD Analysis: Sideways Move Continues, Key Levels to Watch
The EURUSD pair failed to break below the 1.0789 support level and has been moving sideways within a trading range between 1.0789 and 1.0887. This suggests that the pair is still in the uptrend from 1.0694, and the sideways move is likely a consolidation phase for the uptrend.
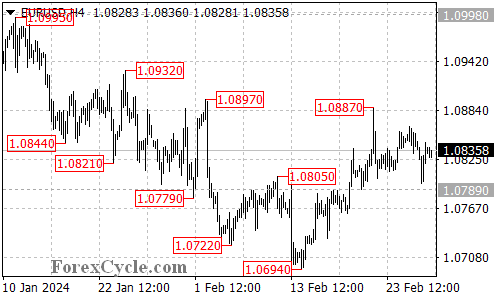
As long as the 1.0789 support level holds, the upside move could be expected to resume. A breakthrough of the 1.0887 resistance level could trigger further upside movement towards the 1.0950 area.
On the downside, a breakdown below 1.0789 would confirm that the upside move from 1.0694 has already completed at 1.0887. In this case, the next target would be at 1.0750, followed by 1.0694.
February 28, 2024 at 7:20 pm #2209In reply to: Forex Forum
AnonymousFebruary 28, 2024 at 7:20 pm #2208In reply to: Forex Forum
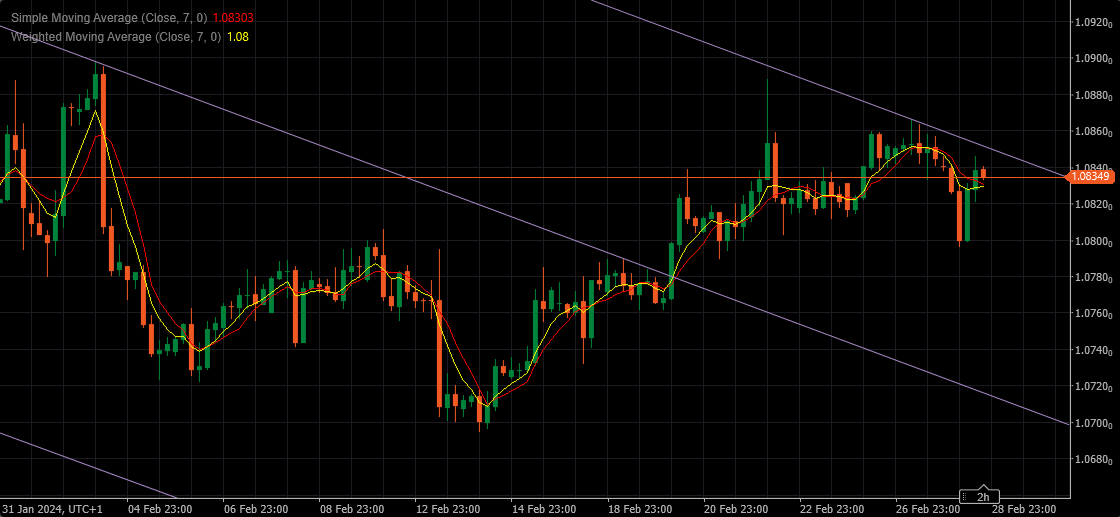
EURUSD 4h
Resistance at 1.08500 – if rejected at it, we are going in maybe not very deep correction, but still a correction phase for at least 24h.
But if 1.08500 gives a way, just to be stopped at either 1.08650 or 1.08900, we are going slowly to turn Down.
Support at 1.08300 and 1.07850 – bellow which we target 1.07000 and the whole previous Up move becomes questionable.
Close tonight above 1.08300 calls for retest of previous high, but not more than that…and that is my experience, instincts and pattern recognition talking.
 February 28, 2024 at 3:53 pm #2184
In reply to: Forex Forum
IEURJPY 30-minute chart – risk turns up
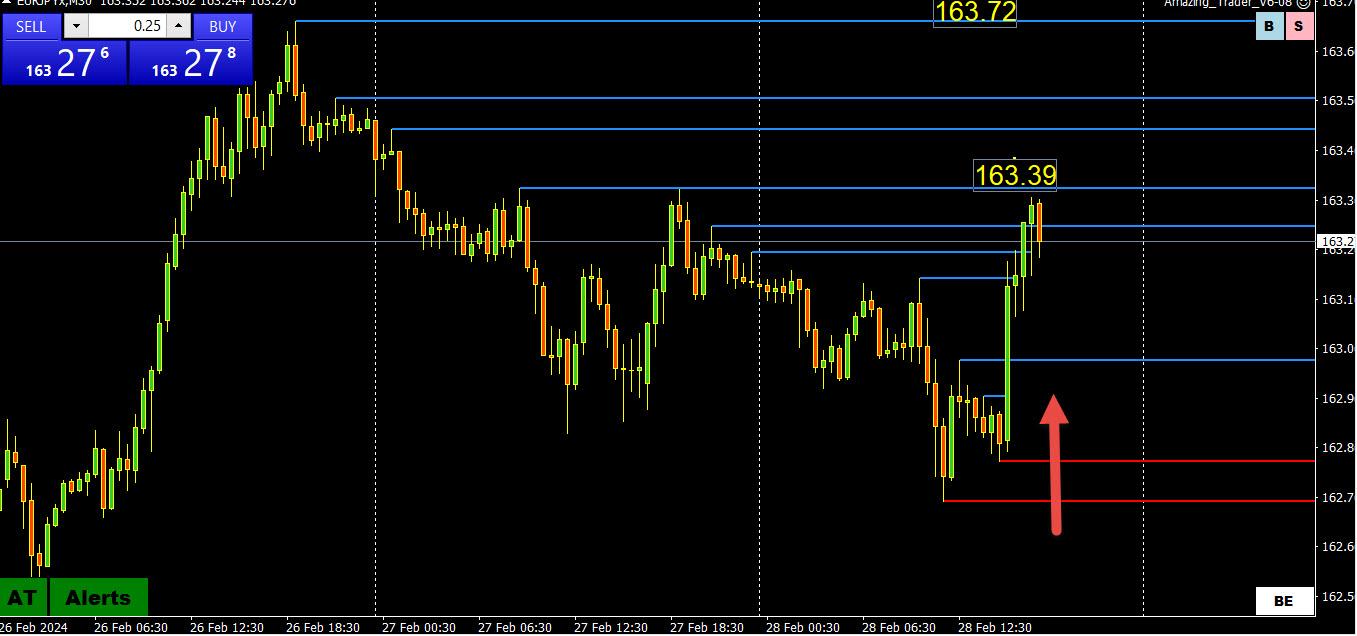
Simple algebra: EURUSD X USDJPY = EURJPY (Hint: One reason for the EURUSD bounce from 1.08)
Chart:
Two red lines drawn off the bottom showed a shift in directional risk to up
So far, pause just below 163.39
Recent and key resistance is at 163.72
Go to shorter time frames for intra-day supports
February 28, 2024 at 1:56 pm #2170In reply to: Forex Forum
February 28, 2024 at 1:51 pm #2169In reply to: Forex Forum
-
AuthorSearch Results



Search
© 2024 Global View