
- This topic has 28,558 replies, 54 voices, and was last updated 5 hours, 58 minutes ago by GVI Forex 2.
-
AuthorPosts
-
October 16, 2024 at 6:24 pm #13015
US500 4 HOUR CHART – Consolidation?

i POSTED THIS LATE YESTERDAY AND IT STILL HOLDS TRUE
IT IS NOW DEPENDENT ON 5800 HOLDING TO KEEP THIS CORRECTION IN CHECK.]
(although the key chart level on this CFD is at 5764)
Otherwise keeps a bid while above 5800 bur in consolidation while below the record 5874 high
October 16, 2024 at 5:20 pm #13007EURUSD 15 MINUTE CHART – Simply Amazing

I really don’t like to post this far after the fact but you have seen me talk about The Amazing Trader and here is another example of how uncanny its levels can be. Then note how the blue resistance lines formed what we call a ladder pattern to the downside.
Join the Global-View Trading Club and get a 50% discount to The Amazing Trader as a member benefit (contact me after joining to claim your discount).
October 16, 2024 at 4:00 pm #13006October 16, 2024 at 3:00 pm #13005October 16, 2024 at 2:58 pm #13004My initial thought was China mouthing off about easing restrictions caused a big chunk of money flow into Asian markets, which distorted the flows on a global scale. But it was temporary as it lacked detail. So then half of it poured back out and landed in places like Singapore (I have been intently observing) and ultimately back into western areas. This is why certain commodities are being impacted of late, some good some not. China started it.
There is also war risk that is very real. Remember, I was military at a not so small level. Hence my comment yesterday about beepers about to go off again. And low and behold the main article on Reuters today is about beebers going off.
I think maybe paying attention to me is worth something in spots.
October 16, 2024 at 2:48 pm #13003October 16, 2024 at 2:39 pm #13002October 16, 2024 at 2:35 pm #13001October 16, 2024 at 2:33 pm #13000October 16, 2024 at 2:26 pm #12999October 16, 2024 at 2:25 pm #12998Jay this may be the first time ever I disagree with you lol. I nailed Sterling because of what I saw, which I have seen before. I think many currency traders discount the effect of stock flows just as stock traders discount currencies and/or futures. I certainly have and is one of my mistakes. You could see it plain as day. The hard part was hanging in there when it reversed a little. Had to be up late at night.
October 16, 2024 at 2:16 pm #12997SF, there is not a disconnect but EURGBP seeing GBPUSD fall and EURUSD lag as the cross rose post- UK CPI.
Since then, EURGBP, while still up on the day, came off its high, removing a support for the EURUSD.
No change in GBPUSD that ot upside is limited as long as it i below 1,3050.
Now market will start looking ahead of tomorrow’s ECB meeting.
October 16, 2024 at 2:03 pm #12996October 16, 2024 at 1:41 pm #12995GBPUSD 5 Minute Chart – Held support

You can see by this chart why I posted “Support at 1.3010 blocks a return to 1.30 or below” (see prior post)
You can also see why I keep highlighting The Amazing Trader and it uncanny ability to identify key chart levels and patterns to trade
October 16, 2024 at 12:48 pm #12992October 16, 2024 at 11:06 am #12977GBPUSD Daily
Supports : 1.29800 , 1.28750 & 1.27350
Resistances : 1.30800 , 1.31050 & 1.31750
If it doesn’t break 1.29800 within next 24h, we’ll be in for a sharp turn UP.
1.31050 still the Major point on the Upper side.
Pattern – Time Wise : this can be an ideal situation for the counter move – I am not saying it is going to happen for sure, but be aware !
 October 16, 2024 at 10:43 am #12973
Newsquawk’s NY Open report (full report and podcast available for subcsribers)
Sentiment hit by poor tech and luxury earnings; Gilts fuelled by softer CPI
Good morning USA traders, hope your day is off to a great start! Here are the top 4 things you need to know for today’s market.
(Click below to read the full report and listen to the guys doing the podcast).
4 Things You Need to Know
European bourses are mostly lower, with sentiment hit following poor LVMH/ASML results; the FTSE 100 leads after the region’s cooler-than-expected inflation metrics.Dollar is flat, GBP is the clear underperformer after headline/services inflation figures declined more than expected.
Bonds continue to build on the prior day’s gains, with upside also fuelled by the aforementioned UK CPI report, which has led to clear outperformance in Gilts.
Crude is modestly lower, XAU/base metals both gain.
Try Newsquawk for 7 Days FreeOctober 16, 2024 at 10:35 am #12972A look at the day ahead in U.S. and global markets from Mike Dolan
World markets struggled to find a footing on Wednesday after Europe’s ASML (ASML.AS), opens new tab sideswiped the global chip sector late yesterday with a surprisingly weak orders outlook and investors prayed the flub was a one-off as third-quarter earnings updates stream in.
There was better news for bond markets – with yields declining on a mix of falling oil prices and significant European disinflation that underscores expectations of another European Central Bank interest rate cut on Thursday.
Morning Bid: Stocks stunned by ASML curveball, pound plunges
October 16, 2024 at 8:59 am #12971October 16, 2024 at 8:52 am #12970October 16, 2024 at 7:29 am #12969EURGBP 4 HOUR CHART – NEWS MATTERS
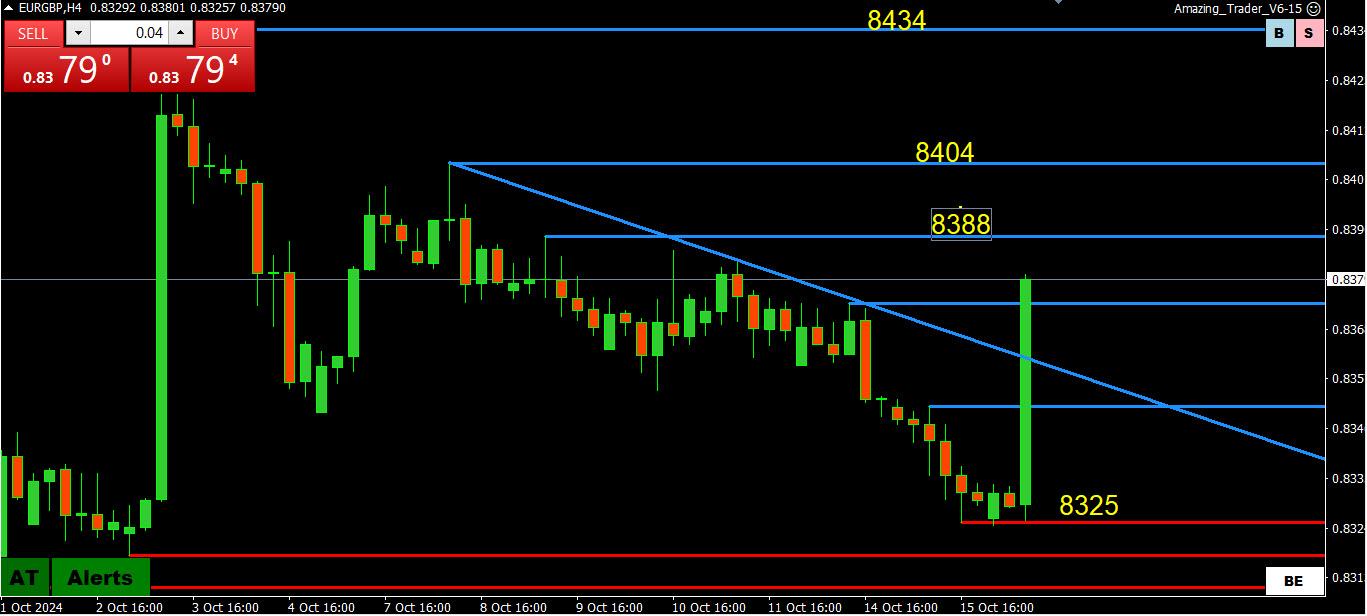
The reaction to the weaker UK CPI has seen EURUGBP spike higher after failing to reach .8300-18, suggesting the bottom is in for now.
Key levels are at .8404 and .8434 so damage not yet fatal but certainly caught the shorts (ahead of the ECB) wrongfooted.
If you are wondering why EURUSD is lagging, look at this cross.
October 16, 2024 at 6:58 am #12967October 16, 2024 at 6:55 am #12966October 16, 2024 at 6:27 am #12965October 16, 2024 at 4:16 am #12963I am really nailing Sterling and Yen right now and it is important to understand I was a CTA on the phone filling orders through many houses with large contracts and the competition was intense, but you just behave solid. So I am seeing repetitive patters right now in these pairs and if you have any common sense I would pay attention. At times I will shout something like “long Yen” that means with your brokers you are selling Yen. It is very fast and there are major banks filling orders so you must be on you toes. That said, if you just relax you can see what they are doing.
October 16, 2024 at 4:04 am #12962October 16, 2024 at 2:57 am #12961October 16, 2024 at 2:21 am #12960October 16, 2024 at 12:13 am #12959Regarding Yen. I am waiting for them to run the figure and the stops and then come in hard on the buy side. Not nice Japanese data earlier at all.
Side note, reading the common sense post by Jay, is gold.
Dide note, listening to Mary Daly San Francisco Fed earlier I am fully convinced she is completely full of it and trying to make a duck look like an eagle.
October 16, 2024 at 12:03 am #12958USDJPY 149.07
puppy frollicked with 150 and that – wants the degenerates’ rumour mill – is oiki yoyki scary of intervention kabooki
and as if by devine coincidence GV’s calendar shows
21:30 JPY BoJ Adachi Speech and apparently of “Low” potential impact.maybe …
you wanna get taste of adachi’s yakings, suggest google BoJ Adachi board member -
AuthorPosts


- You must be logged in to reply to this topic.
Search
© 2024 Global View