
- This topic has 28,410 replies, 54 voices, and was last updated 23 minutes ago by GVI Forex 2.
-
AuthorPosts
-
October 9, 2024 at 10:53 am #12673October 9, 2024 at 10:44 am #12672
US500 4 HOUR CHART – Correlation?

In the absence of fresh economic news, markets are like steering a boat without a rudder.
This leads to looking for correlations to steer the boat. In this regard, early USD strength seemed to correlate with weaker stocks, which have since recovered and the USD has backed off its day highs.
Note, correlations work until they stop working so keep an eye on Stocks to see if the pattern continues (or not).
As for U5500, trading with a bid (while above 5700) but consolidating unless 5758-73 are taken out.
‘October 9, 2024 at 9:38 am #12671Posted by JP:
EURO 1.0955 = Sup
the Qtn is . will it holdand the A is __
JP, the answer to your question depends on whether there are stops below 1.0950. Right now there is a double bottom, suggesting someone defending this level but the more times a level is tested the weaker it becomes unless of course if it holds rock solid.
As I noted, test may have to wait until US CPI but in any case, a 50 pip range is too tight to last for long.
October 9, 2024 at 9:26 am #12670USDJPY 4 HOUR CHART – Key levels cited
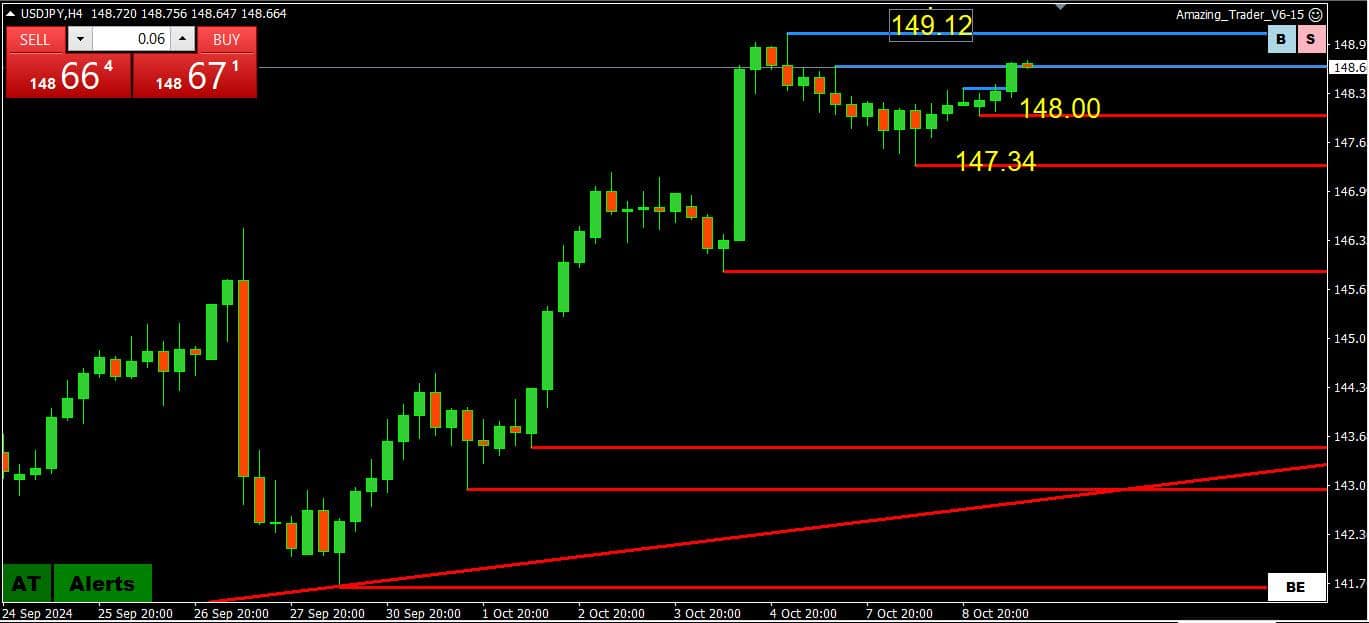
As noted yesterday, key levels are at 147.20-149.37 and tests of both side at 147.34-140.12) have paused within this band.
Pivotal level is clearly 148, which will dictate the next directional move.
For those still looking at this as a retracement, here are the FIBO levels for 161.93-139.58
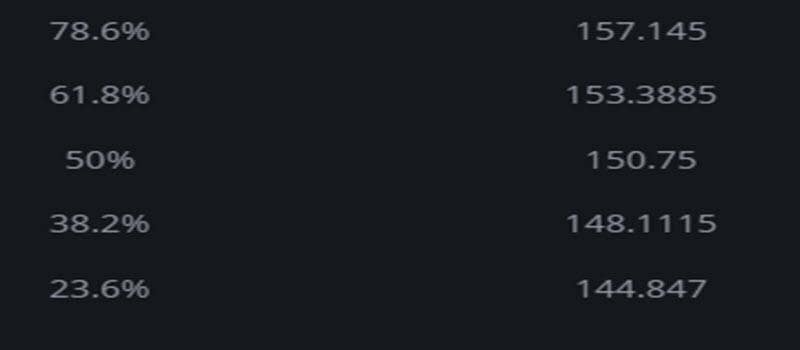 October 9, 2024 at 9:14 am #12669
EURUSD 4 HOUR CHART – POWER OF 50

Turing on my screen what popped out was EURUSD making another run at 1.0950 (1.0951 double bottom).
The significance is not only the psychological 1.0950 level but the 1.0949 key chart support just below it.
Lending potential support could be caution at some stage ahead of tomorrow’s US CPI report although the focus will soon shift to next week, ECB meeting, where a 25 bps rate cut is widely expected.
On the other side, there is the ongoing Middle East situation with traders waiting for the other shoe to drop (Israel reprisal against Iran).
In any case, our view that EURUSD will stay defensive as long as it trades below 1.10 has so far worked out. a firm break of 1.0949 would put 1.0881 on the radar as next key support.
October 9, 2024 at 9:04 am #12668AUDNZD DAILY CHART – RBNZ FALLOUT

It is the reaction to news that matters played out overnight with the NZDUSD falling sharply (down about 1%) after the RBNZ, as generally expected, cut rates by 50bps
AUDNZD reaction (up) would need to establish above 1.1056 to expose the Major level at 1.1151.
Otherwise, range is to 1.0980-00,
October 9, 2024 at 8:48 am #12667October 9, 2024 at 12:16 am #12666JP – at 10:18 pm
If I may. There are times there is too much caffeine in the tea. I am waiting for the glowing jobs report to have another almost 1 million job loss revision they tried to bury under the rug.
If Powell is smart is will continue to play their game in order to survive.
My approach of late is to choose the most sensitive currencies to purchase which would benefit from sudden shock.
Because these people in charge are not in charge. If you think so you are smoking Payote.
October 8, 2024 at 10:18 pm #12662earlier today bostic
–– Says Fed Aiming to Balance Risks to Both Inflation, Jobs
– Eyes Hurricane Fallout as Economic Risks Remain Balanced
– U.S. labor market is ‘slowing, but not slow,’
– Economy Is Close To Fed’s Targets And ‘Moving Closer’; Inflation Rate Is Still ‘Quite A Ways’ Above 2%and something about wanting a pony too
October 8, 2024 at 8:42 pm #12639October 8, 2024 at 8:23 pm #12633Brent Crude Oil
Oil Prices Fall as Israel’s Response to Iran’s Attack Fails to Materialize and China Declines to Add Further Stimulus
Oil prices dropped on Tuesday for the first time in six sessions as traders await Israel’s response to Iran’s Oct.1 missile attack and China avoids new stimulus measures to revive a flagging economy.
West Texas Intermediate crude oil for November delivery was last seen down US$1.40 to US$75.74 per barrel, while December Brent crude, the global benchmark, was down US$1.43 to US$79.50.
Oil gained 13% in the five sessions after Iran’s attack as traders worried Israel response would hit at Iran’s oil infrastructure, potentially cutting into the country’s 1.7-million barrels per day of exports. Fears abound also that a wider war in the oil-rich Persian Gulf is on the horizon and could threaten nearly a third of global oil output. However the risk premium may be fading given the delay in Israel’s response.
 October 8, 2024 at 7:33 pm #12616
NAS100 DAILY CHART – BACK ABOVE 20k

NAS100 back above 20K but any high other than a new record high will be a disappointment.
It feels like markets in general are waiting for Israel’s reprisal to get the focus away from geopolitical risks.
Stocks, meanwhile , are trading with a bid ahead of earnings in the hope that current lofty valuations can be justified.
October 8, 2024 at 7:04 pm #12615XAUUSD DAILY CHART – Range or retracement?

As I have been pointing out it has been glaring that GOLD has not gotten a safe haven bid despite geopolitical tensions and risks.
As also pointed out, if you t=assume a 2600-2700 range then 2650 wills et the tone, below it increasses the risk of a retracement.
Now we see id 2600 holds. If not, then support is at 1545-85.
October 8, 2024 at 6:14 pm #12612Being active in the Asian session is a constant for me since being on the West Coast of the US provides good time zone benefits. The prior Asian session was initially inspiring, with China announcing less restriction and more stimulus as well as efforts which, one might argue, would create a surge in retail trading and investment that sticks.
I got what I wanted. But the verbiage lacked detail and so the aggressive 11% gain in mainland China stocks fizzled rapidly to under 6%. Still good but quite a reflection.
There is something called “predictive volatility” as noted by London regulators which basically states volatility across markets is here to stay when considering such factors as the speed of information output and the chaos present across continents.
But then you have continuing elements such as Kiersten Todt, a rightfully highly renowned cyber-security executive pointing out a dramatic increase in communication infrastructure hack efforts against every western nation by the People’s Republic of China at a sovereign scale. In past decades this would be an act of war.
What a lot of people would like to see is for China to concretely open domestic market participation, because if and when it does the surge of retail money in China would be historic, which would also serve to slow the impact on price activity from high impact data due to the increased volume present across markets.
Theoretically.
October 8, 2024 at 5:06 pm #12611October 8, 2024 at 4:10 pm #12595Let me start out by saying where you place a stop is more important than where you enter a trade. Understand this concept and you are on your way to changing the way you look at trading
Let’s see if this turns around the way you look at trading
This Will Change the Way You Look at Trading
 October 8, 2024 at 4:02 pm #12594
US500 4 HOUR CHART

When you compress this chart you can see US500 has been in a range and consolidating for more than a week.
It feels like markets in general are waiting for Israel’s reprisal to get the focus away from geopolitical risks.
Stocks, meanwhile , are waiting for earnings to see if current lofty valuations can be justified.
In any case, risk of a recession has faded and question is whether the uS economy is headed for a soft landing or no landing (i.e. continued growth).
October 8, 2024 at 3:50 pm #12593October 8, 2024 at 3:18 pm #12592Forward are selling on the outside contracts and buying on the nearby contracts for both UsdJpy and EurUsd. Dow Puts are being dominated by calls. Reflective of a slight risk on condition. Bear in mind there are often delayed reactions with relation to those elements and since the end result is mixed then if there is an unforeseen purst it is likely to be on the sell side in Euro if/when participating algorithms and fund managers etc begin to decide they should hedge risk.
October 8, 2024 at 3:02 pm #125912-10 yield curve widens by 4bps to 0.06

Source: CNBC
A positive yield curve indicates that long-term debt interest rates are higher than short-term debt rates.
A positive yield curve can mean that the economy is expected to grow in the future. This is because a rational market will generally want more compensation for greater risk, and long-term securities are exposed to greater risk.(AI Overview)
October 8, 2024 at 2:56 pm #12590GVI at 2:42 pm — It depends on the source for the worth. Human nature for sardines to want to know where the other sardines are in the water so maybe you have a chance of survival.
If it is a retail broker it has no worth to me. If it is institutional that says something. But institutional brokerages would lose their clients fast if they did that absent of a market-wide data output without someone being fired. Been there to see it.
October 8, 2024 at 2:42 pm #12589October 8, 2024 at 2:41 pm #12588October 8, 2024 at 1:55 pm #12584There are times when 1 + 1 = 3
This feels like one of them in the absence of fresh economic news
Middle East tensions simmer with Israel reprisal vs Iran looming at any time
US bond yields up, stocks up – no ign of risk off
Commodity currencies still struggling – sign of risk off
‘
GOLD unable to catch a safe haven bidAs for FX, use the anti-dollar EURUSD 1.10 as a USD strength/weakness indicator…. last at 1.0975
October 8, 2024 at 12:15 pm #12580EURGBP 4 HOUR CHART – REVERSAL OIF FORTUNE

Retreat from .8404 helping to give GBPUSD a bid while EURUSD lags after a tepid attempt at 1.10, on a reversal of the price action seen yesterday.
With key support at .8349, .8350-00 seems more like a no man’s land so watch this cross as it is influencing EURUSD and GBPUSD.
October 8, 2024 at 12:06 pm #12579Reuters Pollsays 68 out of 75 economists see the ECB cutting the deposit rate by 25bps in October and December. Median show ECB to cut deposit rate to 2.0% by end 2025 (prev 2.50% in Sept poll)… Newsquawk.com.
October 8, 2024 at 11:29 am #12578EURUSD 4h
Waiting from yesterday to see 1.10 and reaction to it – lame…
Supports : 1.09750 , 1.09500 & 1.08850
Resistances : 1.10000 , 1.10350 & 1.10500
Close of this Bar above 1.09850 would be Bullish short term – another leg Up
Close below 1.09800 would indicate possible continuation of the Downtrend
 October 8, 2024 at 10:41 am #12577
A look at the day ahead in U.S. and global markets from Mike Dolan
World markets painted a messy picture on Tuesday, with recently pumped-up crude oil prices retreating sharply and disappointment surrounding China’s economic stimulus already setting in – knocking Hong Kong shares (.HSI), opens new tab back almost 10%.
The return of mainland Chinese markets after a week’s holiday there did see the CSI300 (.CSI300), opens new tab index play catch-up with another jump of about 6%. But the Hang Seng, which had remained open for much of the week and rallied significantly during that time, turned tail.
October 8, 2024 at 10:24 am #12576October 8, 2024 at 9:51 am #12575XAUUSD DAILY CHART

Since setting a record high 9 days ago, XAUUSD has traded either side of 2650 in the following 8 days.
This is clearly the pivotal level, especially if you view the current range at 2600-2700.
‘
GOLD has been aa disappointment in that it is not benefiting from safe haven flows but it remains to be seen if it is just biding its time, In any case, 2650 will eventually dictate whether the current move is just a pause or the start of a retracement, -
AuthorPosts

- You must be logged in to reply to this topic.
Search
© 2024 Global View